
Surface Tension and Its Measurement
Adhesion is a phenomenon that takes place at the interfaces of adherends and adhesives. An understanding of the forces that develop at the interfaces is essential in the selection of the right adhesive, proper surface treatment of adherends, and effective and economical processes to form bonds. This chapter is devoted to the discussion of the thermodynamic principles and the work of adhesion that quantitatively characterize surfaces of materials.
Keywords
Surface tension; interface; surface free energy; adhesion; measurement
2.1 Introduction
Adhesion is a phenomenon that takes place at the interfaces of adherends and adhesives. An understanding of the forces that develop at the interfaces is essential in the selection of the right adhesive, proper surface treatment of adherends, and effective and economical processes to form bonds. This chapter is devoted to the discussion of the thermodynamic principles and the work of adhesion that quantitatively characterize surfaces of materials.
2.2 What is an Interface?
Two solid or liquid phases in contact have atoms/molecules on both sides of an imaginary plane called the interface. The interfacial particles differ energetically from those in the bulk of each phase because of being on the phase boundary and interactions with the particles of the other phases. The composition and energy vary continuously from one phase to the other throughout the interface. This region has a finite thickness, usually <0.1 μm [1].
2.3 Surface Tension
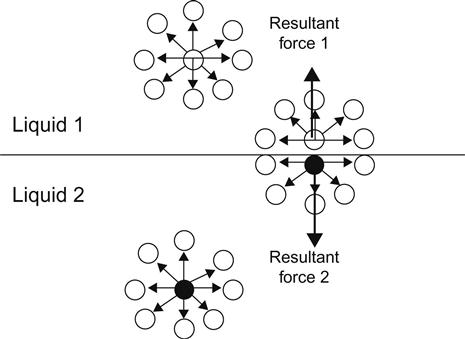
The molecules of a liquid are held together by attractive forces. The sum of all attractive forces on any molecule present in the bulk of a liquid averages zero. The net force (also known as cohesion force) on a surface molecule is a non-zero quantity in the direction towards the bulk (Figure 2.1). This is the force that must be counteracted to increase the surface area; the energy consumed by this process is called surface energy. The unbalanced forces on the interface cause it to contract to a minimum surface area value. Therefore, water droplets are spherical because a sphere has the minimum surface area of all shapes for a given volume. Surface tension and surface free energy of a liquid are equal while the same is not true for a solid surface.
Surface tension is the work required to increase the area of a surface isothermally and reversibly by a unit amount. Surface tension (γ) is expressed as surface energy per unit area and alternatively as force per unit length. Surface tension of liquids can be measured directly and expressed in the units of work or energy per unit area (erg/cm2), which is then simplified to dyne/cm (erg/cm2=dyne cm/cm2=dyne/cm). Chapters 2 and 3 review methods for the measurement of surface tension. The challenge has been to find methods to determine the surface tensions of solid surfaces (see Chapter 3).
Surface tension of polymers can be divided into two components, polar (γp) and dispersion (γd), to account for the type of attraction forces at the interfaces [2]. The chemical composition of the surface determines the relative contribution of each component to surface tension. The polar component is comprised of various polar molecular interactions including hydrogen bonding, dipole energy, and induction energy, while the dispersion component arises from London dispersion attractions. The attractive forces (van der Waals and London dispersion) are additive, which results in the surface tension components being additive: γ=γp+γd.
2.4 Surface Free Energy
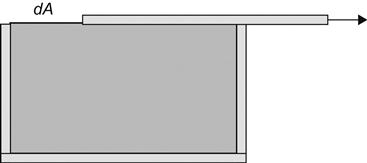
A hypothetical example is used to describe the concept of surface free energy. Suppose a box with a sliding cover is filled with a liquid (Figure 2.2). The sliding cover is assumed to have no interfacial tension with the liquid. If the cover is slid back to uncover a surface area of dA, the necessary reversible work will be (γdA). For a pure substance, the increase in the free energy of the system at constant temperature and pressure is defined by Eq. (2.1).
(2.1)
The total free energy of the system is comprised of the energy of the bulk liquid and the surface liquid. The latter is equal to the surface free energy per unit area (GS) multiplied by the surface area as shown in Eq. (2.2). Combining Eqs. (2.1) and (2.2) results in Eq. (2.3), which illustrates that the free surface energy of a pure substance is equal to its surface tension.
(2.2)
(2.3)
In a reversible system, the heat (q) associated with the elimination of the new surface can be related to entropy (S) or surface entropy (Eq. (2.4)), where SS represents surface entropy per unit area. Equation (2.5) is a thermodynamic relationship applied to the liquid surface in which T represents absolute temperature. Equation (2.6) is obtained by substituting for GS from Eq. (2.3).
(2.4)
(2.5)
(2.6)
The total surface energy (ES in Eq. (2.7)) can be calculated by applying the enthalpy relationship (HS) with Gibbs free energy and entropy to the liquid surface.
(2.7)
Equation (2.8) is the result of substitution from Eq. (2.6) into Eq. (2.7).
(2.8)
Surface tension of most liquids decreases with increasing temperature in a linear manner. A well-known equation (Eq. (2.9)) defining the relationship between temperature and surface tension has been attributed to EÖTVÖS [3].
(2.9)
V is the molar volume, k has the same value for most liquids (2.1 erg/K), Tc is the critical temperature of the liquid, and T is the liquid temperature. The expectation is that surface tension of a liquid approaches zero at its critical temperature. There are other equations that express the behavior of liquids as a function of temperature [1].
2.4.1 Surface Energy of Solids
A solid is defined as a material that is rigid and resists stress. A solid surface may be characterized by its surface free energy and surface energy. Surface energy (tension) of a solid cannot be measured in a similar manner to that of a liquid, due to the difficulty caused by the reversible formation of its surface. The methods for determining the surface energy of solids are described in this chapter.
Solid material surfaces can be divided into one of two categories: high or low surface energy [4]. High surface energy materials include metals and inorganic compounds such as oxides, silicates, silica, diamond, and nitrides. Surface tension of high-energy materials is 200–500 dynes/cm. Low-energy materials are mainly comprised of organic compounds including polymers with critical surface tension <100 dynes. Polymer surfaces have been classified [5] as low, medium, or high surface energy. Low surface energy solids have critical surface tension in the range of 10–30 dynes/cm, medium energy from 30 to 40 dynes/cm, and high energy >40 dynes/cm.
Low-energy materials such as oils are spontaneously absorbed by the high-energy surfaces, due to the reduction in the free surface energy of the system. This means that a clean, high-energy surface exposed to the normal ambient environment will not remain clean for long because the absorption of water and especially organic particulate matter from the environment will contaminate its surface. This is the reason a surface cleaning operation is included in many processes directly before the actual application of the adhesive or coating to prevent prolonged exposure of the cleaned substrate (adherend) to the factory environment. Some applications require coating the surface with a protective primer or corrosion inhibiting primer. Another approach is to apply a protective film to the clean surface, which is removed immediately prior to adhesive coating.
2.4.2 Work of Adhesion
The work of adhesion is defined as the reversible thermodynamic work required to separate the interface from the equilibrium state of two phases to a separation distance of infinity. Equation (2.10) shows the work of adhesion for a liquid–solid combination. This definition is attributed to the French scientist A. Dupre.
(2.10)
γL is the surface energy (tension) of the liquid phase, γS is the surface energy of the solid phase, γSL is the interfacialsurface tension, and Wa is the work of adhesion. A rise in the interfacial attraction results in an increase in the work of adhesion. Equation (2.10) can be rewritten to determine the work of cohesion (Wc) when the two phases are identical (γL=γS and γSL=0) and no interface is present as shown in Eq. (2.11) for a solid phase.
(2.11)
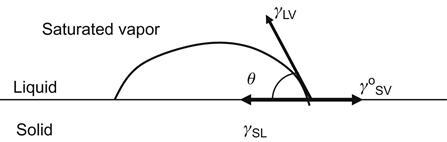
2.5 Contact Angle (Young’s Equation)
Most liquids wet solid surfaces and exhibit a contact angle. A contact angle in a static system can be measured at equilibrium. Figure 2.3 illustrates the contact angle in an ideal system where the solid surface is homogeneous, smooth, planar, and rigid. The interfacial tensions designated as γ represent equilibrium values at the point that three phases intersect. The subscripts L, S, V denote liquid, solid, and vapor phases. The γ° designation is used to indicate that the solid surface must be in equilibrium with the liquid’s saturated vapor; that is, a film of the liquid is absorbed on the solid surface. Young [6] described Eq. (2.12) without presenting a proof; it has been since proven by different researchers [7–9].
(2.12)
One route to proving Young’s equation is using the Gibbs free energy of the wetting, proposed by Poynting and Thompson [10]. After the liquid droplet forms the meniscus and reaches equilibrium, the variation in Gibbs free energy is zero. An assumption in Eq. (2.13) is the neglect of the gravitational force.
(2.13)
(2.14)
In Eq. (2.14), dA represents small incremental increases or decreases in the surface or interfacial area. Changes in the interfacial areas are given by Eqs. (2.15) and (2.16). Any increase in the solid–liquid interface is countered by a decrease in the solid–vapor interface. Substitution from these two equations into Eq. (2.14) will yield Young’s equation (Eq. (2.12)).
(2.15)
(2.16)
(2.12)
The difference between the equilibrium surface energy of solid–vapor and solid–liquid is sometimes called adhesion [11]. Note that the work of adhesion and adhesion tension involves the solid–vapor equilibrium rather than that of the solid–liquid:
Most surfaces have heterogeneous composition and are not perfectly smooth. Wetting of such a surface may reach equilibrium or remain in a metastable state. In the case of an ideal surface, the addition or removal of a small volume of liquid from the drop will result in the advancement or recession of the drop. The contact angle will return to its equilibrium value. In the case of a surface that may contain roughness and heterogeneity, there is a delay in the movement of the liquid drop in response to the addition or removal of liquid. This phenomenon, called hysteresis, requires a revision of the definition of contact angle.
The contact angle, formed as a result of the addition of liquid, is referred to as the advancing angle. The angle formed by the removal of liquid is called the receding angle. The contact angle of a liquid on a real surface is measured in both advancing and receding modes. Typically, after the addition or removal of the liquid, there is a delay followed by a sudden motion in the drop of the liquid. The maximum angle for the advancing mode and the minimum angle for the receding mode are defined, respectively, as advancing and receding contact angles.
Harkins and Livingston [12] have proposed a correction to Young’s equation when the surface of the solid carries a film of the liquid’s vapor. The surface energy of a solid surface that contains an adsorbed vapor layer (γSA) is less than that of a “clean” surface. This concept has practical significance because clean surfaces tend to adsorb the ambient vapors and oils and must therefore be protected prior to the application of adhesive. Harkins and Livingston’s correction, known as spreading coefficient (πE), is shown in Eq. (2.17), thus resulting in Eq. (2.18) after substitution into Eq. (2.12).
(2.17)
(2.18)
The spreading coefficient can be measured by a technique developed by Paddy. This method assumes that a sessile drop, when successively increased in volume, reaches some constant maximum height (h) for a given solid–liquid system, provided the system is aged to reach equilibrium. This maximum height is related to the spreading coefficient by Eq. (2.19), in which ρ is the density of the liquid and g is the gravitational acceleration.
(2.19)
Finally, by substituting for the interfacial tension from the modified Young’s equation (Eq. (2.12)) into the work of adhesion equation (Eq. (2.20)) for a solid–liquid system, the equation for the work of adhesion can be simplified to Eq. (2.21), also known as Young–Dupre’s equation.
(2.20)
(2.21)
This means that the work of adhesion can be calculated by measuring the contact angle and the surface tension of the liquid.
2.6 Effect of Temperature on Surface Tension
An important variable affecting surface tension is temperature, which has practical value during the adhesion bonding of plastics. Surface tension of both adhesive and polymer is influenced by temperature. Guggenheim’s equation (Eq. (2.22)) is applicable to liquids comprised of small molecules [13] and polymers. In this equation, γ0 is surface tension at T=0 K and Tc is the critical temperature (K) of the liquid. The values of γ0 and Tc values can be determined by fitting a line to the surface tension data as a function of temperature. According to the Guggenheim equation, surface tension decreases as temperature increases [14]. The rate of decrease of surface tension as a function of temperature is 0.1 dynes/°C cm for liquids with small molecules [13,15].
(2.22)
2.7 Surface Tension Measurement
Surface tension measurement techniques are divided into methods for solids and liquids. There are two modes for measuring surface tension of liquids: static and dynamic. Values reported in the literature are often static surface tensions of liquids. Tables 2.1–2.3 present a brief description of the common techniques for surface tension measurement of liquids and solids. Some of these methods are described in further detail.
Table 2.1
Static Surface Tension Measurement Methods for Liquids
| Technique | Brief Description |
| Du Nouy ring | Traditional method for the measurement of surface and interfacial tension measurement. Maximum pulling force on a ring by the surface is measured. Wetting properties of liquids have no influence on this technique. |
| Wilhelmy plate | This technique is broadly applicable to liquids, especially when surface tension must be measured over a long time period. A vertical plate with known perimeter is attached to a balance and submerged in the liquid. The force due to wetting is measured by the balance. |
| Spinning drop | Suitable for low interfacial tensions. The diameter of a drop within a heavy phase is measured while both are being rotated. |
| Pendent drop | Surface and interfacial tension are measured by this method. |
Table 2.2
Dynamic Surface Tension Measurement Methods for Liquids
| Technique | Brief Description |
| Bubble pressure | This method is used for determining surface tension at short surface ages. The actual measured variable is the maximum pressure of each bubble. |
| Drop volume | A method employed for determining interfacial tension as a function of time (interface age). The time between two consecutive drops is measured when liquid of one density is pumped into a second liquid of a different density. |
Table 2.3
Surface Tension Measurement Methods for Solids
| Technique | Brief Description |
| Sessile drop | This method involves measurement of the contact angle optically and is used to estimate wetting properties of a localized region on a solid surface. The angle between the baseline of the drop and the tangent at the drop boundary is determined. This technique is ideal for curved samples or when one side of the sample surface has different properties than the other side. |
| Dynamic Wilhelmy | This method requires uniform geometry for calculating average advancing and receding contact angles on solids. Both sides of the solid must have the same properties. Wetting force on the solid material is measured as the solid is submerged in, or withdrawn from, a liquid of given surface tension. |
| Single fiber Wilhelmy | This is a dynamic Wilhelmy method applied to single fibers to measure advancing and receding contact angles |
| Powder contact angle | This procedure allows the measurement of average contact angle and adsorption speeds of powders and other porous species. The change in the weight as a function of time is measured. |
| Liquid Homolog Method (Zissman) | Called critical surface tension, it is based on measuring the contact angle of several liquids and plotting the cosine of the angle versus surface tension of the liquids. The surface tension at which cosine of the contact angle is equal to 1, obtained by extrapolation, is the critical surface tension of the solid. |
Several standards specify methods for measuring contact angles for different applications (Table 2.4). These methods provide procedures for the comparison of surface energy of differing industrial materials.
Table 2.4
Standard Contact Angle Measurement Methods for Various Materials
| Technique | Title—Scope |
| ASTM D724-99(2003) | Standard Test Method for Surface Wettability of Paper. Method covers the quantitative determination of the resistance of paper surfaces to wetting by measuring the behavior of a drop of liquid applied directly to the paper surface. |
| ASTM D5725-99(2008) | Standard Test Method for Surface Wettability and Absorbency of Sheeted Materials using an Automated Contact Angle Tester. Method measures the contact angle of a test liquid on a flat sample of a film or a paper substrate under specified conditions. |
| ASTM C813-90(2009) | Standard Test Method for Hydrophobic Contamination on Glass by Contact Angle Measurement. Method covers the detection of hydrophobic contamination on glass surfaces by means of contact angle measurement. |
| ASTM D5946-09 | Standard Test Method for Corona-treated Polymer Films using Water Contact Angle Measurement. Method covers the measurement of contact angle of water droplets on corona-treated polymer film surfaces; the results are used to estimate the film’s wetting tension. |
| TAPPI T458a | Surface Wettability of Paper. In this method, the contact angle between air and liquid on a paper surface is taken as a measure of the resistance of the paper surface to wetting by the liquid. The initial angle of contact or initial wettability is considered to be a measure of the ruling quality of the paper. The rate of change in the wettability is considered to be a measure of the writing quality. |
aSee TAPPI (Technical Association of the Pulp and Paper Industry) web site: www.tappi.org.
2.7.1 Measurement for Liquids: du Nouy Ring and Wilhelmy Plate Methods
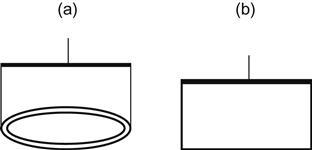
The du Nouy ring and Wilhelmy plate methods (Figure 2.4) are the two most frequently used techniques for measuring surface tension at a liquid air interface or interfacial tension at a liquid–liquid interface. Only the du Nouy method can be applied to measure interfacial tension. Both of these techniques are based on pulling an object with a well-defined geometry of the surface of liquids and measuring the pull force. These techniques are also known as pull-force methods. In the Wilhelmy method, a plate is the pull object, while in the du Nouy technique, a ring is used. These techniques are named after the two scientists who conducted some of the early research in the field of surface tension measurement. In 1863, Wilhelmy [16] described the measurement of capillary constants without a detailed calculation of surface tension. Lecomte du Nouy illustrated the shortcomings of the past surface tension determination methods in a paper published in 1919 [17].
Equation (2.23) shows the elements required for the calculation of surface tension by the du Nouy ring method. In this equation, PT is the total force on the ring, PR is the weight of the ring, R is the radius of the ring, and γideal is the ideal surface tension. In practice, a meniscus correction factor is required because the size and shape of the surface inside and outside the ring are not the same. Surface tension must, therefore, be corrected for the shape of the ring by a factor (f) as shown in Eq. (2.24). The correction factors have been determined and tabulated [15,18,19].
(2.23)
(2.24)
The Wilhelmy method does not require a correction factor for the meniscus shape, although it does require correction if the plate is partially or completely submerged in the liquid. In Eq. (2.25), PT is the total force on the plate being measured, PP is the weight of the plate, p is the perimeter of the plate, and γideal is the ideal surface tension. A buoyant force term must be added to or subtracted from the second part of the equation, depending on whether the plate is above or below the level of the free liquid. In Eq. (2.26), h is the height above or below the free liquid level, A is the cross-sectional area of the plate, and γ is the surface tension.
(2.25)
(2.26)
The total force (PT) acting on the ring (du Nouy) or the plate (Wilhelmy) can be measured by a balance connected to either device. Substituting for the total force and the other parameters in Eq. (2.26) allows the value of surface tension (γ) to be calculated.
2.7.2 Measurement for Solids: Liquid Homolog Series
Surface tension of solid plastics is determined indirectly, usually by contact angle methods. A problem with the direct measurement of surface tension arises from the difficulty in the reversible formation of a solid surface. Table 2.3 shows a list of methods that can be applied to measure the surface tension of solids.
An alternative method uses a concept called critical surface tension, proposed by Fox and Zissman [4,20,21], to characterize the surface energy of solids. A cosine plot of the contact angle (cos θ) and liquid–vapor surface tension (γLV) yields a straight line for a homologous series of liquids (Figure 2.5). Nonhomologous liquids yield a curved line that may not be easily extrapolated. The intercept of the line at cos(θ) equal to one is defined as the critical surface tension of the polymer (γc). Values of 18 dynes/cm for polytetrafluoroethylene and 30 dynes/cm for polyethylene are obtained according to this procedure (Figures 2.5 and 2.6). Tables 2.5 and 2.6 present surface free energies of solids and surface tension of liquids.
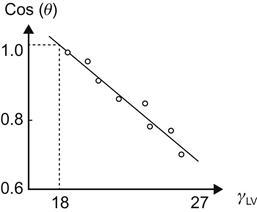
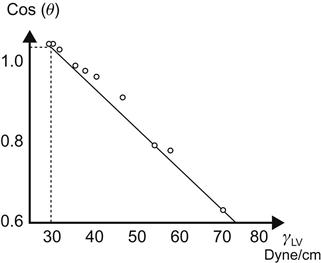
Table 2.5
Surface Free Energy of Select Plastics
| Plastic Material | Surface Free Energy, dynes/cm |
| Polytetrafluoroethylene | 18–19 |
| Polytrifluoroethylene | 22 |
| Polyvinylidene fluoride | 25 |
| Polyvinyl fluoride | 28 |
| Polypropylene | 29 |
| Polyethylene | 30–31 |
| Ionomer (low) polystyrene | 33 |
| Ionomer (high) polystyrene | 37 |
| Polymethyl methacrylate | 38 |
| Polyvinyl chloride | 39 |
| Cellulosics | 42 |
| Polyester | 43 |
| Nylon | 46 |
Table 2.6
Surface Tension of Select Liquids
| Liquid | Surface Free Energy, dynes/cm |
| n-Hexane | 18 |
| Alcohols | 22 |
| Cyclohexane | 25 |
| Toluene, xylene | 29 |
| Phenol | 41 |
| Aniline | 43 |
| Glycol | 47 |
| Formamide | 58 |
| Glycerol | 63 |
| Water | 72 |
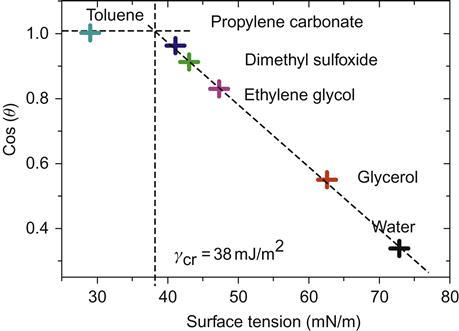
One can obtain a relationship (Eq. 2.27) between the critical surface tension and the solid–vapor surface tension by setting the contact angle to zero in Young’s equation (Eq. (2.12)). Critical surface tension is, therefore, smaller than solid–vapor surface tension. A Zissman plot for polymethyl methacrylate is given in Figure 2.7.
Surface energy of plastics decreases with increasing temperature. Consequently, a molten polymer has a lower surface than its solid form. Surface energies of a number of common polymers are presented in Table 2.7.
(2.27)
Table 2.7
Solid Surface Energy Data for Common Polymersa
| Name | CAS Ref. No. | Surface Free Energy (SFE) at 20°C in mN/m | Temp. Coefficient SFE in mN/(m K) | Dispersive Contrib. of SFE in mN/m | Polar Contrib. of SFE in mN/m |
| Polyethylene (PE)–linear | 9002-88-4 | 35.7 | −0.057 | 35.7 | 0 |
| Polyethylene (PE)–branched | 9002-88-4 | 35.3 | −0.067 | 35.3 | 0 |
| Polypropylene (PP)–isotactic | 25085-53-4 | 30.1 | −0.058 | 30.1 | 0 |
| Polyisobutylene (PIB) | 9003-27-4 | 33.6 | −0.064 | 33.6 | 0 |
| Polystyrene (PS) | 9003-53-6 | 40.7 | −0.072 | (34.5) | (6.1) |
| Poly-α-methyl styrene (PMS) (polyvinyltoluene [PVT]) | 9017-21-4 | 39.0 | −0.058 | (35) | (4) |
| Polyvinyl fluoride (PVF) | 24981-14-4 | 36.7 | – | (31.2) | (5.5) |
| Polyvinylidene fluoride (PVDF) | 24937-79-9 | 30.3 | – | (23.3) | (7) |
| Polytrifluoroethylene (P3FEt/PTrFE) | 24980-67-4 | 23.9 | – | 19.8 | 4.1 |
| Polytetrafluoroethylene (PTFE) (Teflon™) | 9002-84-0 | 20 | −0.058 | 18.4 | 1.6 |
| Polyvinyl chloride (PVC) | 9002-86-2 | 41.5 | – | (39.5) | (2) |
| Polyvinylidene chloride (PVDC) | 9002-85-1 | 45.0 | – | (40.5) | (4.5) |
| Polychlorotrifluoroethylene (PCTrFE) | 25101-45-5 | 30.9 | −0.067 | 22.3 | 8.6 |
| Polyvinylacetate (PVA) | 9003-20-7 | 36.5 | −0.066 | 25.1 | 11.4 |
| Polymethylacrylate (polymethacrylic acid) (PMAA) | 25087-26-7 | 41.0 | −0.077 | 29.7 | 10.3 |
| Polyethylacrylate (PEA) | 9003-32-1 | 37.0 | −0.077 | 30.7 | 6.3 |
| Polymethylmethacrylate (PMMA) | 87210-32-0 | 41.1 | −0.076 | 29.6 | 11.5 |
| Polyethylmethacrylate (PEMA) | 9003-42-3 | 35.9 | −0.070 | 26.9 | 9.0 |
| Polybutylmethacrylate (PBMA) | 25608-33-7 | 31.2 | −0.059 | 26.2 | 5.0 |
| Polyisobutylmethacrylate (PIBMA) | 9011-15-8 | 30.9 | −0.060 | 26.6 | 4.3 |
| Poly(t-butylmethacrylate) (PtBMA) | – | 30.4 | −0.059 | 26.7 | 3.7 |
| Polyhexylmethacrylate (PHMA) | 25087-17-6 | 30.0 | −0.062 | (27.0) | (3) |
| Polyethyleneoxide (PEO) | 25322-68-3 | 42.9 | −0.076 | 30.9 | 12.0 |
| Polytetramethylene oxide (PTME) (polytetrahydrofuran [PTHF]) | 25190-06-1 | 31.9 | −0.061 | 27.4 | 4.5 |
| Polyethyleneterephthalate (PET) | 25038-59-9 | 44.6 | −0.065 | (35.6) | (9) |
| Polyamide-6,6 (PA-66) | 32131-17-2 | 46.5 | −0.065 | (32.5) | (14) |
| Polyamide-12 (PA-12) | 24937-16-4 | 40.7 | – | 35.9 | 4.9 |
| Polydimethylsiloxane (PDMS) | 9016-00-6 | 19.8 | −0.048 | 19.0 | 0.8 |
| Polycarbonate (PC) | 24936-68-3 | 34.2 | −0.04 | 27.7 | 6.5 |
| Polyetheretherketone (PEEK) | 31694-16-13 | 42.1 | – | 36.2 | 5.9 |
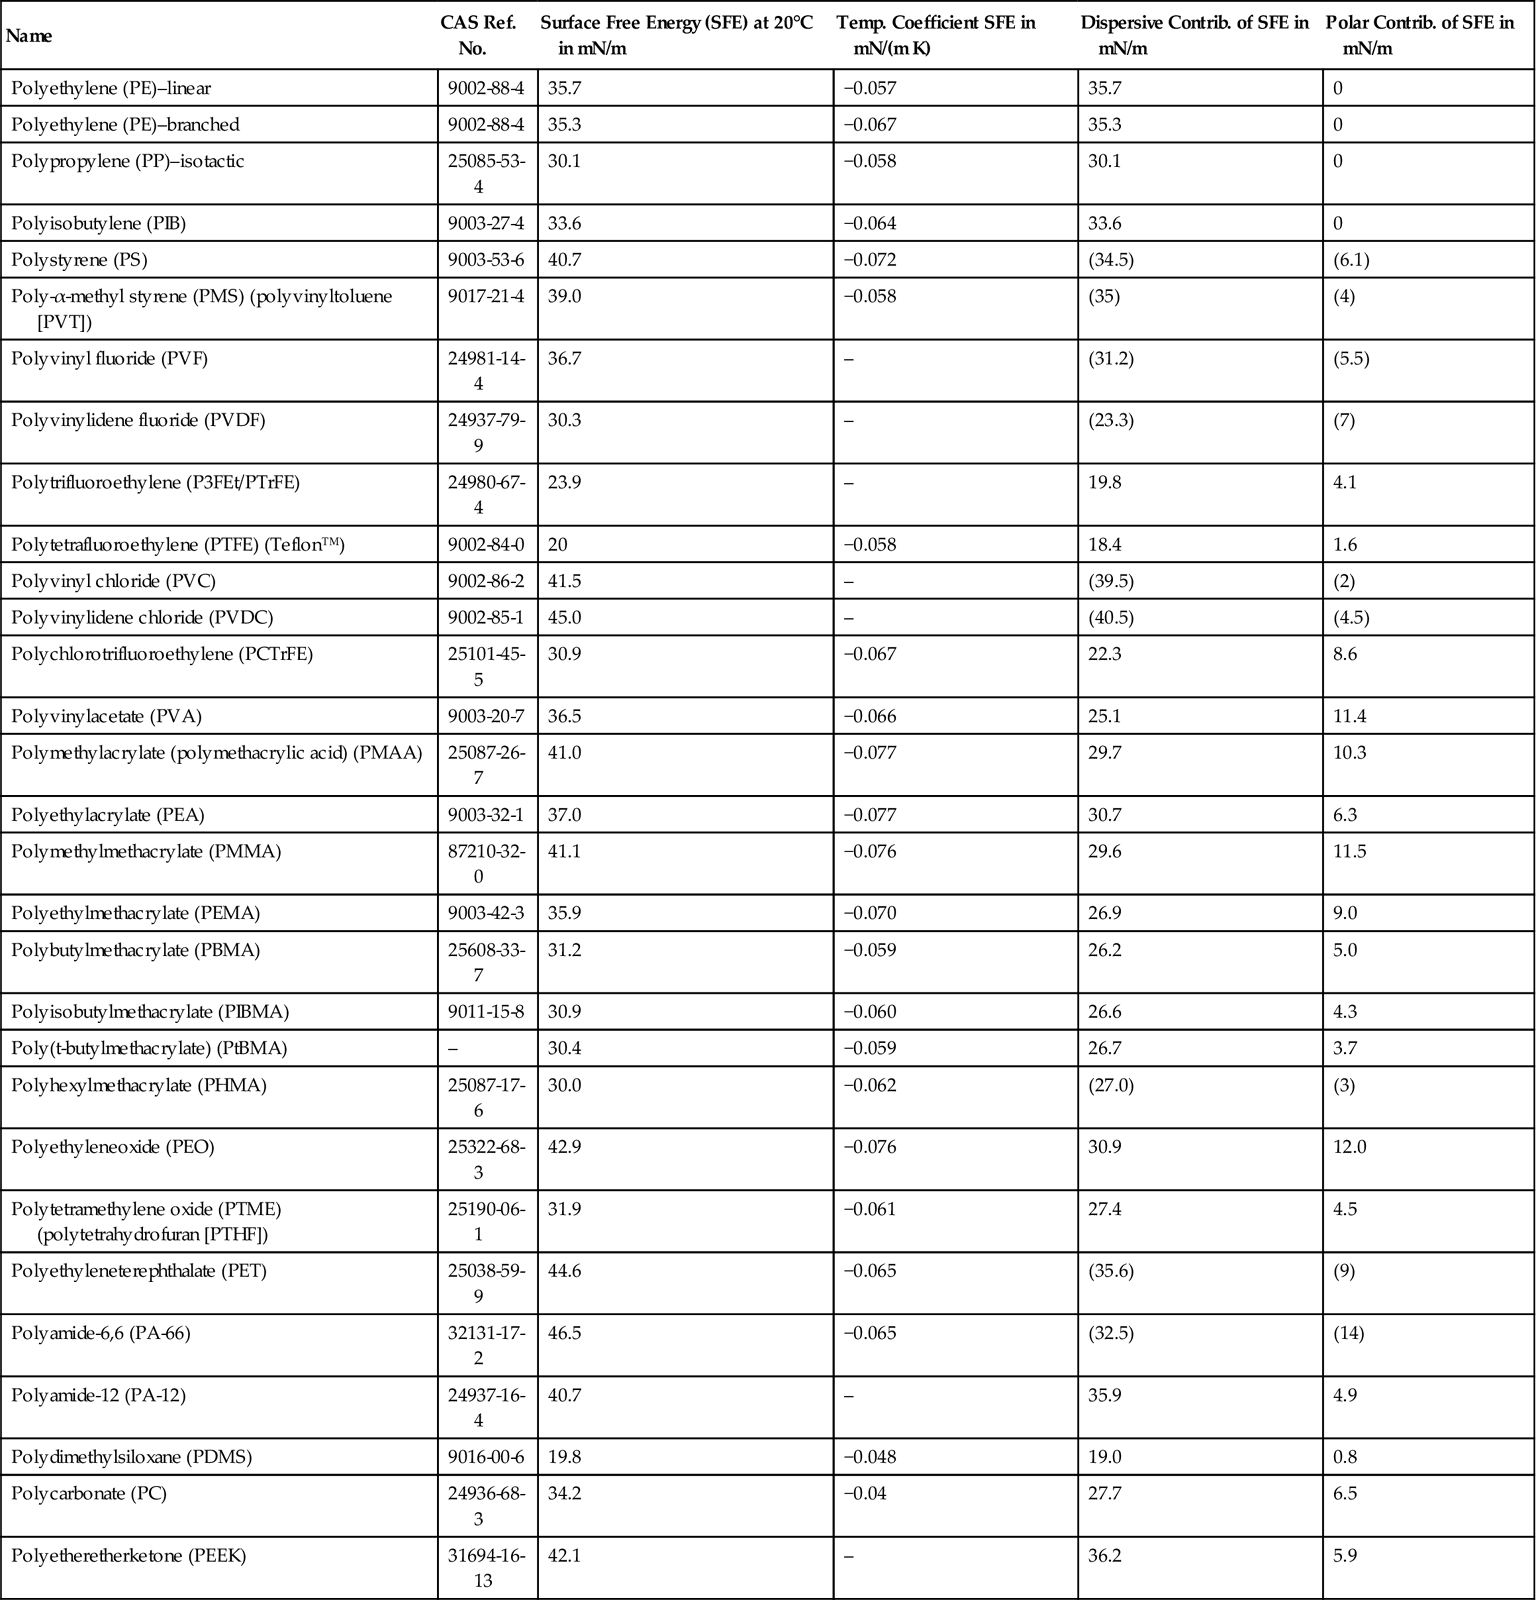
awww.surface-tension.de/solid-surface-energy.htm, February 2013.
In summary, the experimental and analytical methods described in this chapter enable the reader to both measure and calculate surface energy of liquids and solids. Surface preparation techniques often change the surface energy of materials, which can be determined by the methods provided in this chapter.