
Chapter 4
Building Models to Support Augmented Intelligence
Introduction
Building models is complex because it requires that you understand the business process you are focused on. In addition, models are dynamic. It is imperative that the best machine learning (ML) algorithms are selected, tested, and refined as new data is introduced. In this chapter, we discuss the different types of machine learning algorithms and some of the ways in which they are used. We explain what it means to build a model that will support augmented intelligence.
Augmented intelligence requires models that are constantly refined to capture new data that reflects both business process and new information changes. Once you have selected and prepared your data based on the business process you are addressing, the most important next step is to build your model by selecting the machine learning algorithm that best fits the task. Creating and executing a model is neither a one-step nor a one-time process; rather it is an iterative cycle. You begin by selecting an algorithm and then run the algorithm over the majority of the data to create the model. Once the model is created, the hard work begins, since you must evaluate the model using the portion of the data that was not used to build the model. Then, when your model is in use, you must continually retest it when the data changes. Significant changes in data may require you to rebuild your model.
Explaining Machine Learning Models
A machine learning model uses mathematical techniques to create a model from a data set. Subsequently, this model can be used to address a specific business problem or challenge. The model is built by using an algorithm that can find meaningful contextual patterns in the initial data. Once the model has been trained with the appropriate data, it is used to help the organization make predictions about their business as new data comes in. If executed well, these models can help guide human experts to make well-informed decisions. Data preparation is critical to ensuring that your model is indeed predictive.
Once you identify the information, you must choose an algorithm that is appropriate for the data, which will be discussed in detail in the next section. The algorithm runs on your data and builds a model that is then used for new data that comes from your business. However, first you must evaluate the model to ascertain that it works. Evaluation is not simply a process of feeding some data into the algorithm and getting a model with the assumption that results are correct. You need to be able to test the data to assume that the results are performing well. One important approach that helps you ensure the accuracy of a model is by training with data where the results are already known. At this point, you can continue to add additional well-understood data where the results are also known. Thereafter, when the model is in use, it must be tested periodically as your business data grows. What are you testing for? You need to test for both accuracy of results and hidden biases within those data sets that will give you results that will hurt your business. Because your data and your model are not static, this type of testing and evaluation will go on forever. As your business changes and new data is introduced—such as information about new products, new customers, and changing partnerships—you will inevitably need to change your model. Typically, business changes will result in business process changes that we discussed in Chapter 3. But you cannot leave this to chance. It is important that you establish a business process that establishes a way to initiate a new cycle of data testing and model reexamination.
Understanding the Role of ML Algorithms
All machine learning algorithms are computer programs that classify a set of examples into different categories. It is important to understand the differences between the many types of algorithms and how they are best used to build your models. Despite the fact that there are more than 40 machine learning algorithms, they fall into the following two categories:
-
Inspectable algorithms
-
Opaque or blackbox algorithms
Inspectable Algorithms
An inspectable algorithm allows you to review the results and understand what the model is doing. Decision trees are the only algorithm that enables a user to inspect and gain insights into the results produced by the algorithm. Decision trees have existed since the 1960s and continue to be used. However, they have a major limitation: Decision trees cannot support a large number of features or large data sets. Because of these scalability limitations, it can be difficult to ascertain the patterns that are at the heart of machine learning for large data sets. Despite the fact that inspectability or explainability is instrumental in successfully understanding what models are doing, decision trees serve as only one type of tool in the machine learning predictive toolbox.
Now let’s look a little closer at how decision trees work. By understanding them, you will recognize the value of a ML algorithm. Looking a little closer at how this algorithm functions, you will see that it captures relationships among categories by making decisions as it branches down the tree on what feature matters in the decision in the tree. The “leaf” or ends of the tree represent the categories.
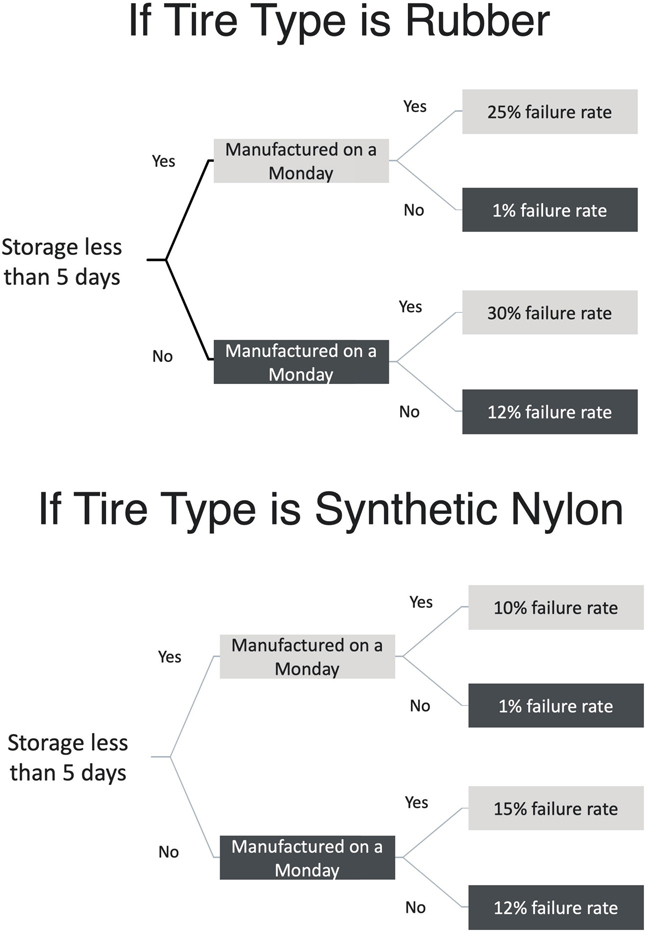
Let’s start with a hypothetical example. Suppose that a tire company wants to know the causes of tire failures at less than 6 months of age of their tires. The tire engineers must first create the data set for the algorithm to use. This process is not trivial and takes some guess work and a lot of data modeling to get the data ready to be used. The tire engineers guess that important features of the data could include the type of tire (model 01, 02, 03), the chemical types (assume these are rubber and synthetic nylon, for this discussion), the tire weight, and the length of time it was stored. Scientific articles suggest that the day of the week might also be a feature, because workers tend to be less productive and mindful on Mondays. The engineers decide to use as features for storage amounts of less than 5 days and equal to or more than 5 days. The same algorithm could be run with different time features to see what results occur. Although the discussion below uses terms such as rubber, synthetic, and days of the week, in fact those values would need to be turned into numerical forms (1 or 2 for tire type; 1–7 for days of the week, and so on) for processing in the algorithm.
The algorithm uses these features for each example in the data set it learns from. It creates the decision tree as it learns from examples in the data set provided by the company. The hypothetical resulting trees would look like the ones in Figure 4-1 on the next page.
Inspecting these results, one sees that (1) tire weight and model did not matter, as they are not factors in the decision trees; (2) overall rubber tires had higher failure rates than synthetics; and (3) storage and creation on Monday for both categories of tires were a problem but worse for rubber. The highest failure rates were for rubber tires stored more than 5 days and created on a Monday. There is no guarantee that using a larger data set with the same features would result in the same tree, but unless the smaller data set is anomalous in its examples, the larger data set might have slightly different results but not be fundamentally different. Checking that assumption is very important in using machine learning algorithms as well as trying different features of the tires. This decision tree tells the engineers what kind of failure rates they can expect for their tires depending on when they were made. However, over time, if the engineers improve their tire manufacturing, a new data set might show different results from the one in this example. So it is critical to keep collecting new data and seeing what results occur for that data.
Note that, importantly, decision tree algorithms are not widely used when there are a large number of features or when the data set is quite large because the algorithm runs too slowly to produce the model. So why use decision trees at all? In inspecting the decision tree, developers and business users can explain just how it is that a new tire will be categorized. Imagine if the tree was not inspectable. We would place a black piece of paper on the whole tree in the diagram and just leave the bottom leaves of the tree to look at. Then, when a given tire was run through the model, the results would simply show that it had one of the failure rates at the leaves of the tree. No one would know why that tire had that failure rate, or what features contribute to that failure rate, and they could not use the algorithm to decide what to change in their business process! Obviously knowing the predicted failure rate is useful, but knowing why is even more so. Furthermore, inspecting the tree may also help the human team see if there is bias in the original data, a matter we will elaborate upon in Chapter 5.
Black Box Algorithms
The vast majority of machine learning algorithms provide non-inspectable results. The algorithms are often called black box algorithms because unlike a decision tree, you can’t look inside to see how the algorithm works. Non-inspection means that the way that the algorithm makes its choices is not something that a data scientist or anyone else can look at, just like when we put black paper over the decision tree. As a result, black box algorithms require other methods to see whether they are producing reasonable results.
Opaque or black box algorithms do not provide the analyst with an understanding of why the algorithm produced its results. The algorithm makes choices and reaches conclusions based on how it interprets the data. Therefore, if an organization needs to explain how a conclusion was arrived at, it will require different methods to explain the results. For example, if a machine learning algorithm is used to make hiring recommendations, an organization may be required to explain why certain individuals were hired and why others were not considered.
There are two types of opaque algorithms: supervised and unsupervised. As we discussed in Chapter 2, a supervised model is one in which you begin with an established set of data that is already classified. This classified data has labeled features that define the meaning of the data. In contrast, unsupervised models are based on a large volume of unlabeled data that must be classified based on a pattern or cluster.
Supervised Algorithms
All supervised algorithms start with examples for which the data scientist knows how the classification should go (sometimes called the gold standard). The algorithm must learn this classification. However, because the rules the algorithm learns cannot be inspected, some of the examples must be set aside for later evaluation (called the test set or test data). The standard protocol for these algorithms is to have the algorithm train on the majority of the examples, called the training set or training data, which is often 90% of the examples. The remaining 10% of the data are the test set. The algorithm is never trained using the test set because it would eliminate the method of seeing how the algorithm performs on “new” data. When the algorithm finishes on the training set, it is then evaluated by testing it using a test set to see how well it performs.
Creating a Gold Standard for Supervised Learning
It is not enough to simply classify data. Ensuring the accuracy of models requires that subject matter experts understand the data being used to feed the model. Achieving accuracy requires a process that produces trust in the data and its model. Creating a gold standard for classification is one of the most predicable techniques. Gold standards allow the expert to guarantee that results are accurate. For example, a human can quickly ascertain that a human face is either a man, woman, or child. However, who the individual is in that picture is much more difficult; human experts can be wrong. So sometimes one needs three experts to make choices, after which their choices are compared to come up with a best-of-three decision. As a result, creating a gold standard may take a lot of time, human labor, and know how. Consider the tire example again. Data scientists and engineers must go through all of the tires in the data set and note which ones failed before and after 6 months. If the data team is missing information on failures or when the tires were made, the data can be “made up” using averages from the whole data set (although doing so may introduce errors that will show up when testing is done).
Once the data set is created, it must be divided in a random way to keep 10% for testing. Of course, there is always the chance that what appears in the test set is different in some way from the training set. If that happens, there will be a pattern that the model has not seen and will misinterpret. It is just such cases that testing is meant to check for. Simply said, the data team wants to know how well the model works on this test set. Another way to test the data is to choose the training and test sets 10 different times (called 10-fold cross validation). The algorithm is trained and tested on each group and then compared to see on average how well the tests performed.
Usually ML algorithms do not perform perfectly on test data sets, but performance above 85% is often taken as reliable. That percentage may not be reliable enough, and can be resolved by company managers making judgments based on such matters as the cost of errors. A business might be quite right to ask for performance above 95%. For example, returning to the tire failure scenario, suppose the learning algorithm predicts only 85% of the failures, which means it fails to predict 15% of the tire failures. If those failures cost the company significant time and money to replace (as well as affecting the company’s reputation), the learning algorithm may not be used. The data team will need to try again, by requiring additional features that were not previously considered or more data examples that provide more information and may lead to better performance.
How does augmented intelligence play a role in data testing? Simply said, testing does not happen only once. Over time, your business may change, and the data will reflect that change. The model used for the data will need to be retrained and retested to assume that it is still making good predictions. The team who works with the model will need to do periodic remodeling to see if the new model makes different predictions based on the combination of new and old data. Conclusion: You can’t just introduce a machine learning model into your business process and expect it to perform perfectly forever. You need human team members to “keep an eye” on the algorithm and make sure it still works well.
There are two supervised learning algorithms that are most often used in model building—k-nearest neighbors (k-NN) and support vector machines (SVM). K-nearest neighbors is the simplest and most often used type of classification algorithm. Support vector machines are used to analyze data for classification and regression analysis.
K-Nearest Neighbors
K-nearest neighbors works by taking an example’s value and then locating another example value that is close to it (thus the term nearest neighbor). What counts as close in distance depends on the particular features that the data scientist chooses. For the tire example, these features could be age (in whole numbers of 1 to 120), weight (in whole numbers or real numbers), and so on. This algorithm can create many clusters (not just failure or no failure for the tire business).
An important challenge for this algorithm is the size of k. The k in a k-NN algorithm stands for a number that is a positive integer that must be chosen when running the algorithm. If k is too small, the algorithm will overfit the data, which means it will fail to predict certain members of the clusters. Splitting into a training and test set, and keeping the test set large enough, helps to reduce overfitting. If k is too large, irrelevant examples will creep into clusters and make the algorithm unreliable. Irrelevant examples are referred to as outliers. Data scientists sometimes have ways of visualizing data (with graphs) that allow them to remove outliers from the data set before the algorithm works, but data sets with many features do not make this visualization straightforward. So data experts often try several different values of k in order to see how well the algorithm performs on the training set and the test set. Of course, test sets are never used for training data.
Support Vector Machines
A support vector machine is widely used when there are a small number of features to train on, where “small” depends on the number of features relative to the number of items in the data set. The tire example discussed so far has a much smaller number of features relative to the typical data set in most companies. A support vector machine makes its decisions not by simply drawing a line between the members of the data set. Instead, it chooses a margin around that line and looks to make the margin as wide as possible.
There are many kinds of support vector machine algorithms, which grow in complexity with the mathematics that govern them (from linear SVMs to ones with quadratic functions and beyond). Most data scientists prefer linear SVMs or ones that use quadratics because they are simpler to compute. SVMs have been used to classify texts (to determine which of a set of prespecified categories a text most closely fits), perform facial recognition (to find the face or faces in an image), image classification (again to pick the prespecified category in which the image fits), interpret handwritten letters, and to classify proteins. Note that in all of these applications, a set of classes is prespecified, not invented by the algorithm. Like other supervised machine learning algorithms, SVMs rely on people to provide the shape of the problem that the machine algorithm is to learn, and the algorithm provides the (non-inspectable) rules to predict which category an example will fit into.
Here we take a moment to consider a business problem application so that we can understand how algorithms might work with it. A cable television company that provides video content to viewers wants to know what advertisements to show to its customer viewers while they watch a show or movie. The data that the company has will include customer location, the show being watched, the history of other shows watched, the time of day (morning, afternoon, early evening, late evening, past-midnight), and the content package the customer pays for (for example, bare bones, many channels, special channels, etc.). The company may purchase information about the income level of the customer (such data is readily available), but it may still not have certain types of significant data, such as the gender and age of the viewer, and whether a group or a single individual is watching. This missing data might be crucial to the model and is a potential weakness in the model.
The company must determine what categories of advertisements it wants the algorithm to display using the data set and the categories of location, show, and so on. For example, does the company have six different categories of advertisements it wants to consider or does it not know what categories of advertisements it should use? When the company knows the categories of advertisements it wants to categorize its data into, it can choose a supervised algorithm. The algorithm will create a model that has learned a way to decide the categories of advertisements to show viewers as they watch a particular show. For example, the model might have learned that evening viewers watching shows about international travel should be shown advertisements about cars and household appliances. However, the cable company must also assure that both training and test sets contain representative data for each of the categories that the algorithm will learn from or else the learned model will make poor predictions for some viewers. If the company does not have a way to create such sets, it is best to turn to unsupervised algorithms. Furthermore, if the company does not know what categories it wants, it can use unsupervised algorithms to determine the categories and put values into each.
Unsupervised Algorithms
Unsupervised learning algorithms for clustering tasks fall into two broad classes: K-means clustering and hierarchical clustering. There are other types of tasks for unsupervised learning to reduce the dimensionality of a problem, but such tasks are often used by data scientists in order to simplify problems. K-means clustering is one of the simplest and commonly used unsupervised machine learning algorithms. The objective of K-means is to group similar data points in order to visually discover underlying patterns. K-means clustering starts by picking k centroids (the points around which each cluster will eventually form) and interactively finds points close to each cluster, moving the centroid as needed so that the centroid remains the average point for the cluster.
Hierarchical clustering also creates clusters/categories that have a hierarchical structure. In this case, the top of the hierarchy comprises the most general categories, and the subclusters have more specific categories. Hierarchical clusters begin with a number of clusters and proceed to merge them based on the proximity of cluster members to each other. Which of these two clustering techniques are to be chosen depends on the type of result the data scientist wants for the problem at hand. If you are trying to determine the best ads to display to a user of an online site with a general category such as clothing or furniture, then k-means clustering will be chosen. But if the company wants to have more specific categories as well as general ones (i.e., furniture and kitchen tables), then hierarchical clustering will be useful.
How are unsupervised algorithms evaluated for accuracy? Generally, creating a gold standard corpus is too labor intensive. For clustering techniques, one can measure how close each piece of data is to other pieces of data in the cluster and how far the centroids of each cluster are to other clusters. A number of other very mathematically sophisticated techniques have been explored by data scientists and will not be explained here.
Since all black box algorithms are non-inspectable, must it always be the case that you can’t learn how they work? There is considerable ongoing research to determine scalable and predictable ways to inspect black box algorithms. However, thus far no single approach has emerged as the solution to the interpretability or explainability of models.
Understanding Reinforcement Learning and Neural Networks
There are some important algorithms that function like a combination of supervised and unsupervised models. The most important of these are reinforcement learning and neural networks. Reinforcement learning is a model that receives feedback on its performance to guide it to a good outcome. The system learns based on trial and error. Neural networks are designed to emulate human brains. These networks consist of input nodes, hidden layers, and output nodes. Neural networks are being used in recommendation engines and speech recognition.
Reinforcement learning (RL) has only recently been used in business applications because the way it learns is not so easily adapted to business problems. In RL, the algorithm experiences positive and negative rewards as it makes choices and develops rules inside the model (its choices are called policies). Suppose that the algorithm is playing a simulated game of soccer, where it can kick the ball to another team player, try to kick a goal, or try to steal the ball from an opponent. It chooses an action based on features of the environment (which it chooses for itself) and then takes one of the three actions. If it fails, it gets a negative reward; if it succeeds, it gets a positive reward. It updates the reasons (the policies) for its choices based on the rewards and keeps going. Clearly, game-playing programs benefit from using RL, but other recent business applications have started to appear. For example, suppose our cable television company uses its unsupervised algorithm to decide which types of advertisements to show its customers and now it must bid on ads from several different companies that create ads. An RL model could decide on the basis of the cost of ads, length of ads, and whatever else it determines relevant to which ad to bid on. Then its reward is whether the customer watches the ad (positive reward), turns off the sound (negative reward), or turns off the show (negative reward). Based on those positive and negative rewards, it adjusts its policies for the next ad choices.
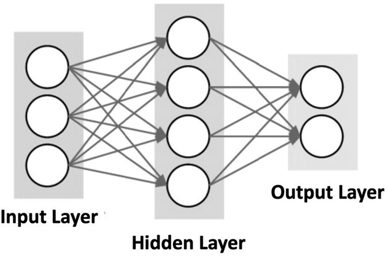
Neural network algorithms include so called “deep” neural network algorithms. These algorithms consist of a set of calculations done on “nodes,” each of which is linked to other nodes. In simple neural nets, there are a layer of input nodes, one middle layer of nodes (called the hidden layer), and one layer of output nodes. Figure 4-2 shows connections between the top nodes of the network and all the other nodes. Although a typical network only has three rows of nodes, it is possible to add many more.
This complex network was designed to work something like the neurons in the human brain, though these artificial neural networks are vastly simpler than human neurons and their networks.
The mathematics of neural network algorithms works in the following way. Each node has weights for each input value of that node and a summation function for all the weights. Each summation function has an activation function that determines what output will be provided for that node and its various inputs. Thus, every node in the network has summation and activation functions all making guesses at the correct answer and then adjusting the weights to reduce the error when the node guesses incorrectly.
The neural network is designed to optimize the weights to reduce the error in a correct output. Simple neural networks were, for much of their history, used as supervised learning algorithms, and so the outputs were known for each input. Much of the research in machine learning has explored a wide range of optimization algorithms and activation functions, which will not be discussed in this chapter. In addition, several more specialized types of neural networks have been invented, including feedforward and self-organizing map neural networks, to name just a few. Neural networks have been used for classification problems and clustering (the similarities of some set). Unsupervised simple neural networks have been used to recognize faces, perform speech recognition, make predictions for cancer diagnosis, and for long-term financial forecasting, to name a few examples.
American Express was one of the first companies in the 1990s to use machine learning algorithms to detect fraud in credit card use. American Express evolved their credit and fraud risk management practice from a manual process based on training individuals into a data- and science-based organization.1 The American Express project was intended to identify patterns of fraud in credit card transactions. The results proved that machine learning models could in fact identify fraud. The value came from American Express’s ability to feed the system with massive amounts of the right data. By detecting patterns that would result in fraud, American Express saved an enormous amount of money. To this day, American Express has continued to heavily invest in machine learning technologies and has industry-leading credit and fraud write-off rates. The success of the project was one of the early indications that machine learning and pattern-based algorithms could become an engine for business transformation. In addition to preventing fraud, American Express was able to offer credit to a broader range of individuals.
Currently, neural network algorithms have been devised to detect credit card fraud in real-time. However, such detection continues to be an active area of work for credit card companies who naturally do not share their algorithms publicly.
In recent years, attention has shifted to deep neural networks and the associated notion of deep learning. Rather than one hidden layer, deep neural networks have many hidden layers, only limited by the compute power to manage the computations. In essence, there is no theoretical way to define the correct number of layers for a given problem. The idea of these many layers is to have each layer train on a given feature and then pass its results to the next layer, which trains on another feature. Deep neural networks are put forward as dealing with highly complex data and finding structure in that data without supervision. Both simple and deep neural network algorithms require substantial data to do their decision making, and for deep neural networks, the amount of data needed is immense. In addition, the amount of computation for large simple neural nets and for any deep neural net can be extensive, so data and computation are major factors in using these kinds of learning algorithms.
The Value of Machine Learning Models
There are a variety of machine learning algorithms that are incredibly useful in helping organizations gain insights and value from their data and business processes. Applying the right type of algorithms can create models that are able to provide the right type of insights and context for the data. However, you need to recognize that a model in isolation can be risky since you cannot assume that you will be able to have 100% accuracy. Therefore, it is imperative that you include subject matter experts in your model-design process. One of the most effective uses of models for complex business decision making is to use them in collaboration with human experts.
Summary
In this chapter, we have discussed the process of building a model for a business problem from a machine learning algorithm running over well-prepared data. We have explored several types of machine learning algorithms—inspectable ones, especially decision trees, and black box ones, including supervised and nonsupervised algorithms, reinforcement learning, and neural networks. We have discussed the need for evaluating the data with training and testing sets for supervised algorithms and methods for evaluating nonsupervised algorithms. We have also discussed how augmentation occurs, that is, how business teams—both the data team and the team working with the algorithm every day—play a role in managing the data, the algorithm, and the model over time for business decisions.