
2.2.2.2 Health Insurance
Cutler and Zeckhauser (2000) review a large literature that tends to find a positive correlation between insurance coverage and risk occurrence in health insurance. Conditional on the menu of contracts offered to them, individuals with more health insurance tend to have higher medical spending than individuals with less insurance. This literature provides a nice example of the substantive importance of conditioning on the observable characteristics of the individual that determine the menu of contracts offered to him, as emphasized by Chiappori and Salanie (2000). In particular, since employer offering of health insurance is such a major determinant of coverage, some of the most convincing implementations of the positive correlation test compare health insurance coverage and medical spending among individuals within the same employer, who therefore all face the same option set. Indeed, without such conditioning, one can get the opposite result suggesting that the insured have lower medical spending than the uninsured, driven by the difference in who is offered health insurance.
In the case of health insurance, the potential moral hazard effects are non-negligible. There is compelling evidence—including results from randomized trials (Finkelstein et al., 2011; Newhouse & RAND Corporation, 1996)—that health insurance has a causal effect on medical spending. As a result, the large body of evidence on the “positive correlation” property in health insurance suggests that asymmetric information exists in health insurance, but does not itself provide direct evidence of selection.
The task of trying to separate selection from treatment effects is greatly aided by the availability of variation in the offered contracts that is uncorrelated with demand. Arguably the most compelling evidence of adverse selection in health insurance markets comes from observing “death spirals” brought about by changes in the contract set. For example, Cutler and Reber (1998) examine the response to a change in health insurance pricing at Harvard University that required employees to pay more on the margin for more comprehensive coverage. The introduction of this pricing change was staggered over time across different employees. They document a death spiral dynamic whereby the pricing change produced a decline in enrollment in the more comprehensive plan that was particularly concentrated among lower cost (specifically, younger) employees. This prompted a further price increase in the more comprehensive plan to prevent it from losing money, which in turn prompted further exit by disproportionately younger individuals. More recently, Einav et al. (2010a) implemented the “cost curve” test for selection using data from a large firm and variation across employees within the firm in the relative price they faced for more comprehensive coverage. They estimate a downward sloping marginal cost curve, providing direct evidence of selection distinct from moral hazard.
We conclude that in the market for acute medical insurance in the United States, there seems to be compelling evidence of the presence of adverse selection. The findings in two other health insurance markets—specifically Medigap and long-term care insurance—are more mixed. While there is compelling evidence of private information in these markets, the evidence suggests that the resulting selection is advantageous rather than adverse (Fang et al., 2008; Finkelstein & McGarry, 2006; Oster, Shoulson, Quaid, & Dorsey, 2010).
2.2.2.3 Disability Insurance, Unemployment Insurance, and Worker’s Compensation
In contrast to the study of selection in annuity and health insurance markets there is, to our knowledge, a dearth of work on adverse selection in several settings where there are important social insurance programs including disability insurance, unemployment insurance, and worker’s compensation.11 It would be interesting to test for selection in these markets, although the lack of a robust private market for these risks makes it much more challenging to implement the tests described above. To make progress, one would need to develop tests that—unlike the existing positive correlation or cost curve tests—do not require observing individual choices. In this respect, Hendren’s (2012) development of a method for characterizing the distribution of private information in a market where trade is not observed likely represents an important step forward for empirically based estimates of private information in non-existent or virtually non-existent markets. He develops a method to infer agents’ private information based on subjective probability elicitations which he models as noisy measures of their beliefs. His results provide, among other things, the first evidence of private information about risk type in the disability insurance setting.
2.2.3 Welfare Consequences
The tests for asymmetric information described above are relatively uninformative about the welfare impacts of interventions. Markets that appear to be “more adversely selected” by the positive correlation metric—i.e., in which there are larger differences between the expected costs of the insured and uninsured—are not necessarily ones in which there is a greater welfare cost imposed by that selection. Einav and Finkelstein (2011) provide a graphical illustration of this point. Intuitively, the degree of positive correlation is a statement about the shape of the cost curves in e.g., Figure 3 or 5. However, the welfare cost of adverse selection—i.e., the magnitude of the “deadweight loss triangle” CDE depends not only on the shape of the cost curve but also on that of the demand curve.
This problem has motivated recent empirical work that quantifies the welfare losses from asymmetric information and the potential impact of government policies such as mandates, pricing restrictions, and taxes. Conceptually, one must estimate both the demand and marginal cost curve to pin down the welfare cost of adverse selection. Once these have been estimated, one can identify the efficient allocation and compare it to alternative allocations induced by various government policies.
Abstractly, there are two approaches one can take to recovering the demand and marginal cost curves. The first is to estimate these curves directly without estimating the underlying primitives that generated these curves. It might be usefully called a “plan valuation” approach and is similar in approach to traditional discrete choice demand analysis. Einav et al. (2010a) develop and implement such an approach to estimating the welfare cost of selection. They show that the demand and cost curves shown in the prior figures are sufficient statistics for welfare analysis of equilibrium and non-equilibrium pricing of existing contracts. That is, different underlying primitives (i.e., preferences and private information as summarized by ![]() ) have the same welfare implications if they generate the same demand and cost curves. As a result, the identifying variation used to trace out the demand and cost curves for the “cost curve” test of selection provides the estimates needed to estimate the welfare cost of adverse selection (triangle CDE in Figure 3).
) have the same welfare implications if they generate the same demand and cost curves. As a result, the identifying variation used to trace out the demand and cost curves for the “cost curve” test of selection provides the estimates needed to estimate the welfare cost of adverse selection (triangle CDE in Figure 3).
Einav, Finkelstein, and Cullen’s approach to estimating welfare is attractive for its transparency and its reduced reliance on assumptions about consumer preferences or the nature of their ex-ante information. Moreover, it is relatively straightforward to implement in terms of data requirements. Data on costs and quantities in insurance markets are relatively easy to obtain—as evidenced by the widespread application of the “positive correlation” test which requires both of these data elements. The key additional data requirement is exogenous price variation. While naturally more challenging to obtain, the near-ubiquitous regulation of insurance markets offers many potential opportunities to isolate such variation.
A major limitation of this approach, however, is that the analysis of the welfare cost of adverse selection is limited to the cost associated with inefficient pricing of a fixed (and observed) set of contracts. It does not capture the welfare loss that adverse selection may create by distorting the set of contracts offered, which in many settings could be the primary welfare cost of adverse selection. Intuitively, in order to analyze the welfare effects of introducing contracts not observed in the data, one needs a model of the deeper primitives (![]() ).
).
This limitation partly motivates the second approach that researchers have taken to estimating the welfare costs of selection, which is to directly estimate these primitives and then simulate the welfare cost of alternative policies. For example, Einav et al. (2010c) estimate a model of demand for annuities in which the utility from different annuity contracts depends on underlying consumer primitives (![]() ). Specifically, they examine the semi-compulsory market for annuities in the United Kingdom in which individuals who have saved for retirement through certain tax preferred retirement vehicles are required to annuitize their savings but face a choice over some of the contract features. They focus on the choice of “gaurantee period,” the number of years in which the annuity is guaranteed to pay out even if one has already died. The demand for guarantees depends on both indivdiuals’ unobserved risk type (i.e., survival probability) and unobserved preferences (i.e., for wealth when alive relative to wealth after death). All else equal, longer guarantee periods are more attractive both to individuals who believe they have high mortality and to individuals who have a greater value for wealth after death. Using the model, together with individual-level data on annuity choices and ex-post survival length, they recover the joint distribution of survival types and preferences for wealth after death. Unlike the plan valuation approach, this realized utility approach allows recovery of the underlying consumer primitives (
). Specifically, they examine the semi-compulsory market for annuities in the United Kingdom in which individuals who have saved for retirement through certain tax preferred retirement vehicles are required to annuitize their savings but face a choice over some of the contract features. They focus on the choice of “gaurantee period,” the number of years in which the annuity is guaranteed to pay out even if one has already died. The demand for guarantees depends on both indivdiuals’ unobserved risk type (i.e., survival probability) and unobserved preferences (i.e., for wealth when alive relative to wealth after death). All else equal, longer guarantee periods are more attractive both to individuals who believe they have high mortality and to individuals who have a greater value for wealth after death. Using the model, together with individual-level data on annuity choices and ex-post survival length, they recover the joint distribution of survival types and preferences for wealth after death. Unlike the plan valuation approach, this realized utility approach allows recovery of the underlying consumer primitives (![]() ).
).
Einav, Finkelstein, and Levin (2010b) provide more discussion of these two different approaches and their relative attractions. Broadly speaking, the choice between the realized utility approach and plan valuation approaches involves a standard tradeoff. The realized utility approach requires stronger assumptions about how consumers derive value from insurance, but allows the researcher to use the resulting estimates to (at least in principle) examine counterfactual allocations that are much further from the observed data.12 For instance, papers that model realized utility directly as a function of individual primitives such as risk aversion and beliefs about risk type are able in principle to analyze choice and welfare over contracts that vary over dimensions over which one observes no heterogeneity in the data. The papers by Cardon and Hendel (2001), Cohen and Einav (2007), Einav et al. (2010c), and Einav et al. (2011) are examples in this vein.
The plan valuation approach requires weaker assumptions but commensurately limits the type of analysis one can do. At one extreme, the approach taken by Einav et al. (2010a) recovers the willingness to pay for one health plan over another, but provides no information on the characteristics of the plan determining that valuation. With this approach, inferences about contracts that are not observed in the data are not feasible. Other papers in this literature analyze valuation of contracts as a function of plan and individual characteristics, making it feasible to extrapolate to contracts not observed provided that the model’s assumptions are accurate outside the estimation sample. Examples in this vein include Carlin and Town (2010) and Lustig (2011).
2.2.3.1 Estimates of Welfare Costs of Selection
Relative to the literature discussed earlier that tests for the existence of selection, there has been substantially less empirical work attempting to estimate the welfare costs of selection. The work that has been done to date has focused on the welfare cost of selection in the health insurance market for acute medical expenses or the market for annuities. The empirical estimates of the welfare cost of selection have consistently tended to be a few percent of premia, bounding the potential welfare gains from policy interventions that aim to address selection at relatively low levels. This is true both in the insurance markets for acute medical expenses (see e.g., Cutler & Reber, 1998; Carlin & Town, 2010; Einav et al., 2010a, 2011; Handel, 2011; Lustig, 2011) as well as annuity markets (Einav et al., 2010c). However, as emphasized above and as we return to below, virtually all of these papers have studied only the welfare cost of selection arising from inefficient pricing of a given set of contracts, and have not investigated the potentially much larger welfare losses arising from selection limiting the set of contracts offered or, in the extreme, causing a market to unravel completely.
2.2.3.2 Welfare Consequences of Public Policy Interventions
Beyond estimating the welfare cost of selection, several papers have analyzed the welfare consequences of alternative public policy interventions. A recurring theme of this empirical work is that—as indicated by the stylized model we began with—the welfare consequences of “textbook” public policy interventions are not as straightforward as the simple theory suggests.
For example, recent work on mandatory insurance—perhaps the canonical public policy response to selection—has failed to find welfare improvements from the set of mandates considered (Einav et al., 2010a). Other work has concluded that while the optimal mandate would be welfare improving, it is difficult to determine which mandate would raise welfare with preference heterogeneity and some types of mandates may actually reduce welfare (Einav et al., 2010c).
Another focus of the literature has been on the welfare consequences of regulating the characteristics of consumers that can be used in pricing insurance contracts. Bundorf et al. (2012) emphasize that in the presence of heterogeneity in preferences for coverage that is not perfectly correlated with risk, uniform pricing of contracts across consumers of different risk types cannot induce efficient consumer choice. This creates scope for welfare improvements through characteristic-based pricing, often known as “risk adjustment.” In their empirical application, which uses data on employer-provided health insurance at several firms, they estimate that the welfare gains from feasible risk adjustment turn out to be relatively modest. In a similar spirit, Geruso (2011) empirically explores the potential welfare gains from age-adjusted pricing in a different employer-provided health insurance context. Focusing instead on distributional impacts, Finkelstein, Poterba, and Rothschild (2009b) calibrate a stylized equilibrium screening model of annuities to investigate the impact of banning gender-based pricing in a compulsory annuity market; they find that the redistribution inherent in requiring unisex pricing can be greatly undone by equilibrium adjustment of annuity contracts to the restricted pricing regime.
Other work, focusing once again on health insurance, has examined the implications of pricing restrictions for insurance coverage and government expenditures. Empirical examinations of restrictions on characteristic-based pricing, such as community rating in the small group and non-group health insurance markets have shown that such regulations can reduce coverage among lower risk individuals (e.g., Buchmueller & DiNardo, 2002; Bundorf & Simon, 2006; Simon, 2005). Examining risk adjustment in Medicare Advantage plans, where the government is the insurer, Brown, Duggan, Kuziemko, and Woolston (2011) conclude that more detailed pricing on consumer characteristics can exacerbate, rather than ameliorate, the selection problem as defined with respect to government expenditures. The intuition stems from the fact that the variance of medical spending is increasing with its mean. More detailed risk adjustment—which puts consumers into finer pricing “bins” on the basis of their expected health care costs—results in higher dispersion in the high expected spending bins than in the overall pool, increasing the incentives for an insurer to invest in cream skimming within the finer risk classifications.13
2.2.3.3 Welfare Consequences with Multiple Imperfections
Another interesting vein of this literature has investigated how adverse selection impacts welfare in the presence of other market imperfections. When selection is the only departure from the perfectly competitive neoclassical benchmark, eliminating private information is always welfare improving. This need not be the case when there are multiple frictions. For example, Starc (2011) discusses how, when firms have market power, moving from symmetric information to asymmetric information can improve consumer welfare. Intuitively, when firms have market power, prices are inefficiently high. Adverse selection reduces the incentive for firms to mark up prices because the marginal consumers they lose when they raise prices have lower costs (and thus are higher profits) than the infra-marginal ones that they retain. In a similar spirit, Handel (2011) demonstrates how in the presence of adverse selection, switching costs that reduce consumer response to changes in plan pricing can be welfare increasing by blunting the selection pressures that would otherwise operate.
Measuring the welfare costs of selection is also more complicated in models with additional imperfections. Spinnewijn (2012) shows that calculations based on revealed preference—as in Einav et al. (2010a)—may understate the welfare costs of adverse selection in the presence of frictions such as misperception of risks or adjustment costs. Intuitively, such frictions create a wedge between the revealed demand for insurance via the demand curve and the actual value of insurance. As a result, the demand curve overstates the surplus from insurance for those who buy insurance (because some who purchased do not truly value insurance above cost) and understates it for those who do not (because some who do not purchase should have purchased).
More generally, though the graphical framework developed above assumes perfect competition among insurers, one can generalize the welfare analysis to any other given model of the insurance market as long as one can solve for the equilibrium allocation. Lustig (2011), for example, examines the welfare cost of adverse selection in Medicare Advantage, allowing for imperfect competition on the supply side.
2.2.4 Directions for Future Work
Most of the empirical papers to date on welfare in insurance markets have taken the relatively narrow (albeit practical) approach of focusing on the welfare costs associated with the pricing distortions selection induces in insurance markets. In general, these papers have concluded that, defined in this way, the welfare costs of selection are relatively small. One limitation to this work, discussed above, is that it analyzes adverse selection in the absence of other potential frictions, which can be important for both the sign and magnitude of the welfare costs of selection. In addition, in at least two important respects, the existing work may be missing important potential welfare consequences of selection or of government intervention. These omissions highlight both the challenges and opportunities for further empirical work.
First, most of the existing empirical welfare analysis has abstracted from a potentially more significant welfare cost of selection that could arise from distortions in the set of contracts offered. Selection may result in certain types of coverage not being available, as in the classic Akerlof (1970) unraveling of a market, and the welfare costs of the disappearance of certain contracts is potentially much larger than the welfare costs of pricing distortions of the contracts that do exist. The ability to make empirically based estimates of the welfare cost of selection via selection’s effect on the set of contracts offered remains a very important area for future work.
There are several challenges inherent in any such attempts. One is that although in principle estimates from realized utility models can use the recovered primitives to say something about the welfare consequences of offering contracts not observed in the data, researchers have been (reasonably) wary of using the estimates of such models to say much about contracts that are too far from the observed contracts. Another challenge stems from the supply side task of trying to characterize the counterfactual equilibrium for unobserved contracts; as discussed by Einav et al. (2010b), this can be particularly challenging when allowing for realistic consumer heterogeneity as well as imperfect competition.
Even more challenging is empirical work in markets that have almost or completely unraveled, yet it may be that these markets are precisely where the welfare costs of selection are largest; in other words, the “lamp post problem” of empirical work gravitating to markets for which there are data and dimensions of coverage along which there is observed variation may be one reason that existing papers have found relatively small welfare losses.
A few recent papers have used calibration exercises to try to investigate the value of insurance in markets that are virtually non-existent; examples include the market for annuities (Hosseini, 2010), long-term care insurance (Brown & Finkelstein, 2008), and high deductible health insurance (Mahoney, 2012). Such exercises require that the researchers make assumptions about the population distribution of certain primitives such as risk aversion and risk type, which are often based on estimates made in other, thicker markets. As noted, Hendren (2011) makes important progress in empirically characterizing the distribution of private information in markets where trade does not occur. More work is needed in this area so that researchers may be equipped to examine the counterfactual functioning of private insurance markets that currently do not exist but where we have important social insurance programs such as unemployment insurance, worker’s compensation, and disability insurance.
Second, existing empirical work has focused on testing for the presence of selection and examining its welfare consequences given the existing public policies, such as tax subsidies to employer-provided health insurance or publicly provided annuities through Social Security. This raises the question of whether selection would exist—and what its welfare consequences would be—in the absence of these public programs or under very different public programs than we currently have. Theoretically, it is not clear whether or when government intervention mitigates or exacerbates selection. For example, as discussed earlier, regulatory restrictions on the consumer characteristics insurance companies may use in setting pricing may potentially increase or decrease the welfare costs of selection in the private market. As another example, the impact of mandatory, partial social insurance (such as Medicare which covers some but not all medical expenses or Social Security which provides partial annuitization) on adverse selection in the residual private market for insurance is theoretically ambiguous. Under different assumptions regarding the ability to offer exclusive contracts, Abel (1986) finds that partial public annuities provided by Social Security exacerbates adverse selection pressures in the residual private market while Eckstein, Eichenbaum, and Peled (1985) document a potential welfare enhancing role for partial public annuities. Empirically, we know little about whether the existing partial public insurance programs such as Medicare and Social Security have exacerbated or ameliorated adverse selection problems in the residual private markets for the elderly for health insurance (Medigap) and annuities. Finkelstein (2004) attempts to try to begin to examine such questions empirically. The recent introduction of Medicare Part D, which covers some but not all prescription drug expenses, may provide a fruitful opportunity for empirical work on this question.
2.3 Other Motivations
Following much of the recent literature, we have concentrated our discussion above on asymmetric information as a motive for social insurance.14 This recent focus should not be interpreted as a reflection of a conclusion that selection is the important rationale for social insurance. Here, we briefly summarize several other potential rationales for social insurance. Many of these are ripe for empirical work quantifying their importance.
Incomplete Contracts. Private insurance contracts can only insure risks which are realized after birth, as one cannot write contracts behind the Rawlsian veil of ignorance. Social insurance programs can address this problem by redistributing across individuals born with different endowments (e.g., of skills or health). The ability of social insurance to insure risks realized at or before birth might explain why most developed countries—including the United States in the near future—provide or mandate universal health insurance. Social insurance for risks behind the veil of ignorance is formally analogous to optimal taxation and hence we do not treat it further here; see the chapter by Piketty and Saez in this volume for a review of this literature.
Aggregate Risks. Some risks represent aggregate shocks for which the private insurance market’s ability to diversify the risk cross-sectionally may be impaired. By contrast, the government may be able to spread such risk intergenerationally. This may suggest a welfare-improving role for social insurance against such correlated risks as aggregate unemployment shocks, natural disasters, changes in population life expectancy, or technological change in medicine.
An interesting vein of this literature has investigated why such aggregate shocks cannot instead be effectively diversified—and thus insured—intertemporally through private capital markets. In the context of catastrophe risk (e.g., hurricanes and earthquakes), Froot (2001) discusses a variety of possible demand-side and supply-side explanations for why in practice the role of capital markets in reinsuring these risks appears to be limited and prices appear to be high. He also reviews the available evidence for each hypothesis. Demand-side explanations include agency issues with insurance company managers who do not value protection for policyholders against extremely high losses if the protection does not avoid default by the firm, ex-post intervention by third parties such as the Federal Emergency Management Agency (FEMA) that substitute for insurance, and optimization failures. Supply side explanations include potential market failures such as adverse selection and moral hazard, firm market power, capital market imperfections that restrict the supply of reinsurance, and high transaction costs.
A related set of issues for private insurance concerns aggregate uncertainty. On the supply-side, it may be difficult for would be providers to offer insurance against risks with considerable parameter uncertainty; terrorism risk insurance is an example of where this issue may be important (e.g., Brown, Kroszner, & Jenn, 2002). On the demand-side, aggregate uncertainty may reduce demand for long-term insurance contracts against future risk. For example, Brown and Finkelstein (2011) conjecture that aggregate uncertainty regarding future policy and the survivorship of private insurance companies may depress demand among prime age adults for long-term care insurance that would cover nursing and home health costs in old age.
Externalities. Externalities from insurance constitute another potential rationale for government intervention. One possibility is physical externalities, particularly in the case of health insurance, which subsidizes the treatment or prevention of infectious disease.15 Another is the possibility of fiscal externalities stemming from the Samaritan’s dilemma (Buchanan, 1975). If an altruistic society will provide charitable assistance to those experiencing adverse events ex-post, this can reduce individuals’ incentives to purchase insurance ex-ante. Coate (1995) demonstrates that the optimal transfer policy therefore involves in-kind transfers of insurance to address the inefficient underinsurance that arises in response to unconditional transfers. Ex-post unconditional public transfers are frequently observed in the context of health, natural disasters, and terrorism and thus may deter ex-ante insurance purchases in these markets to some extent. In health insurance, researchers have documented the relationship between charity care and private insurance coverage (e.g., Herring, 2005) and the role of bankruptcy protection in reducing demand for high deductible health insurance (Mahoney, 2012). However, we have little evidence on the overall importance of the Samaritan’s dilemma effects as a motive for social insurance.
Optimization Failures. Another class of motivations for social insurance is a paternalistic motive premised on imperfect optimization in individual insurance purchases. There is considerable evidence that individuals do not adhere to the lifecycle expected utility model underlying traditional models of risk and insurance. For instance, demand for insurance that covers very small risks with high loads—such as toaster warranties, flight insurance, or homeowners insurance deductibles (e.g., Sydnor, 2010)—implies levels of risk aversion that are inconsistent with expected utility theory (Rabin, 2000). Barseghyan, O’Donoghue, and Teitelbaum (2012) argue that this excess demand for low deductibles is explained by misperceptions of loss probabilities. The lack of demand for other types of insurance such as annuities is also difficult to explain in neoclassical models (e.g., Davidoff et al., 2005).
In the context of Medicare Part D—the 2006 addition to the Medicare program that allows individuals to choose a subsidized prescription drug plan—there is also evidence that individuals make suboptimal choices in choosing not just the level but also the characteristics of insurance coverage. Abaluck and Gruber (2011) argue that many individuals choose suboptimal drug insurance plans in the Medicare Part D program given the risks they face. Kling, Mullainathan, Shafir, Vermeulen, and Wrobel (2012) implement a field experiment which suggests that these suboptimal choices in drug insurance plans are due to “comparison frictions”—difficulty for consumers in using available information about plan features to make choices. These are just some examples from a vast literature in psychology and economics that has documented that individuals are prone to various biases such as impatience, loss aversion, overconfidence, and inattention.
The need to account for such biases is especially evident in dynamic models of temporary shocks such as unemployment. As we discuss below, unemployment shocks are quite costly as judged by ex-post measures of consumption smoothing or liquidity effects. Given these costs, rational agents would build up buffer stocks to help cushion temporary shocks (Carroll, 1997; Deaton, 1991). But in practice, most individuals build very limited buffer stocks. The median job loser has less than $200 in liquid assets at the beginning of his unemployment spell (Chetty, 2008).16 Thus, it is difficult to reconcile the ex-post costs of shocks with optimizing behavior even in an environment without any private insurance markets, because self insurance would be adequate to smooth most temporary shocks.17 Indeed, Lucas (1987) calculates that optimizing agents would pay less than 1% of lifetime consumption to entirely eliminate business cycle fluctuations even without any private insurance. Hence, the role for social insurance against temporary shocks is quite limited in optimizing models. This suggests that imperfect optimization must be an important motive for social insurance programs in practice. We briefly discuss recent work on optimal social insurance with agents who do not optimize perfectly in Section 3.3.5.
3 Design of Public Insurance Programs
A large literature has analyzed the optimal government response to the failures in private insurance markets discussed above. The goal of this literature is to find the optimal system in terms of trading off protection against risk with minimizing moral hazard. In practice, this problem has several dimensions. Conditional on deciding to insure a risk such as unemployment, there are several policy choices to be made. What level of benefits should be paid? Should benefits rise or fall over an unemployment spell? Should the insurance plan be financed by taxing firms or workers?
The traditional approach to answering such policy questions is to identify a model’s structural primitives and conduct welfare analysis by simulating alternative policies. In social insurance, Wolpin (1987), Hansen and Imrohoroglu (1992), Wang and Williamson (1996), and Hopenhayn and Nicolini (1997) are influential examples of such work. Lentz (2009) and Huggett and Parra (2010) provide recent state-of-the-art applications. While the structural approach is in principle the ideal method of analyzing policy, in practice it is difficult to fully identify all the primitives of complex dynamic models.
Because of this problem, recent studies have instead tackled the optimal policy problem using a “sufficient statistic” approach, which we focus on here. This approach seeks formulas for optimal policy that are a function of high-level empirically estimable elasticities and are relatively robust to changes in the underlying model of behavior. The advantage of this approach is that it offers results about optimal policy that do not rely on the strong assumptions made in structural studies for tractability and identification. The cost is that it can only be used to analyze marginal changes in policy, e.g., the impact of changing the level of benefits incrementally from its current observed level. See Chetty (2009) for a more detailed discussion of the advantages and disadvantages of the sufficient statistic approach.
Research on social insurance has focused primarily on identifying the optimal level of benefits. We organize our discussion of the optimal level of benefits into three subsections. First, we analyze a static model of insurance in which individuals live for a single period and face one risk. In this static model, it is straightforward to derive an intuitive condition for the optimal level of benefits that trades off the moral hazard costs with the benefits of smaller consumption fluctuations.
Second, we show that this condition for the optimal level of benefits can be written in terms of various empirically estimable parameters. We derive three representations of the formula discussed in recent work: consumption-smoothing benefits, moral hazard vs. liquidity effects, and changes in reservation wages. We discuss empirical evidence on each of these parameters and their implications for the optimal level of benefits.
Third, we analyze the implications of relaxing the assumptions made in the static model. Some of the assumptions are inconsequential. For instance, the formulas obtained from the static model carry over with minor modifications to more realistic dynamic models with endogenous savings, borrowing constraints, and persistent uncertainty. But other extensions to the model—in particular, introducing features such that total private surplus is not maximized by agents’ choices—have significant consequences. For example, if private markets provide insurance that also generates moral hazard, the simple formulas no longer apply because of “multiple dealing” externalities. Similarly, if agents do not maximize their expected utilities because of behavioral failures, the formulas again require modification.
After discussing the literature on the optimal level of benefits, we review recent work on three other aspects of optimal social insurance. First, we discuss work on using mandated savings accounts instead of tax-and-transfer systems to help agents smooth consumption when they face shocks. Next, we discuss imperfect take up of social insurance programs and its implications for optimal policy. Finally, we review recent work on the optimal path of benefits in dynamic models. Unlike the work on the optimal level of benefits, this literature is primarily theoretical. We therefore present brief summaries of some of the key results in this literature and discuss ways in which theory could be connected to data to make further progress on these questions.
Most recent work on connecting theory to data in optimal social insurance has focused on the case of unemployment insurance. Formal models of unemployment translate readily to most other insurance programs such as worker’s compensation, disability, and catastrophic risks. One exception is the analysis of social security. The models we consider below focus on redistribution across states of nature for a given individual. Social security programs do insure against longevity risk by providing annuities, but also have important effects on the path of individuals’ consumption profiles over their lifecycle. As a result, models of optimal social security typically focus on other factors—such as discount rates and wealth accumulation for retirement—independent of risk reduction. We do not consider models of optimal social security design here; see the chapter by Feldstein and Liebman (2002) for a survey of these models. Gruber and Wise (1999) and Krueger and Meyer (2002) summarize the existing evidence on the impacts of social security programs on retirement behavior. Unlike other social insurance programs, the evidence on social security has not been integrated as tightly with theoretical models to make quantitative statements about welfare and optimal policy. We view this as a fertile area for future research and return to this issue in the concluding section.
3.1 Optimal Benefit Level in a Static Model
Setup. The simplest model of insurance is static and has two states, high (![]() ) and low (
) and low (![]() ). These states could reflect the risk of job loss (unemployment insurance), injury at work (Worker’s Compensation), or natural disasters (home insurance). Let
). These states could reflect the risk of job loss (unemployment insurance), injury at work (Worker’s Compensation), or natural disasters (home insurance). Let ![]() denote the individual’s income in the high state and
denote the individual’s income in the high state and ![]() income in the low state. Individuals enter the model with exogenously determined assets
income in the low state. Individuals enter the model with exogenously determined assets ![]() . The government pays a benefit
. The government pays a benefit ![]() in the low state that is financed by an actuarially fair tax
in the low state that is financed by an actuarially fair tax ![]() in the high state. Let
in the high state. Let ![]() denote consumption in the high state and
denote consumption in the high state and ![]() denote consumption in the low state. Let
denote consumption in the low state. Let ![]() denote the agent’s utility as a function of consumption in the high state and
denote the agent’s utility as a function of consumption in the high state and ![]() utility in the low state. This allows for the possibility that utility is state-dependent, e.g., agents may value consumption more when healthy. We assume that both
utility in the low state. This allows for the possibility that utility is state-dependent, e.g., agents may value consumption more when healthy. We assume that both ![]() and
and ![]() are smooth and strictly concave.
are smooth and strictly concave.
A critical feature of the optimal social insurance problem is moral hazard. If individuals’ behaviors were not distorted by the provision of insurance, the planner would achieve the first best by setting ![]() to perfectly smooth marginal utilities,
to perfectly smooth marginal utilities, ![]() . We model moral hazard by assuming that the agent can control the probability of being in the bad state by exerting effort
. We model moral hazard by assuming that the agent can control the probability of being in the bad state by exerting effort ![]() at a cost
at a cost ![]() . For instance, “effort” could reflect spending time to search for a job, taking precautions to avoid injury, or locating a house away from areas prone to natural disasters. We choose units of
. For instance, “effort” could reflect spending time to search for a job, taking precautions to avoid injury, or locating a house away from areas prone to natural disasters. We choose units of ![]() so that the probability of being in the high state is given by
so that the probability of being in the high state is given by ![]() .
.
Agent’s Problem. The agent chooses effort ![]() to maximize his expected utility:
to maximize his expected utility:
![]() (9)
(9)
Importantly, we assume that the agent takes the tax and benefit levels offered by the government (![]() ) as fixed when solving this maximization problem. This assumption is a convenient analytical approximation to capture behavior in an economy with a large number of agents, in which the impact of any single agent’s choice of
) as fixed when solving this maximization problem. This assumption is a convenient analytical approximation to capture behavior in an economy with a large number of agents, in which the impact of any single agent’s choice of ![]() on the tax rate
on the tax rate ![]() is negligible.18 The first-order condition for the maximization problem in (9) is:
is negligible.18 The first-order condition for the maximization problem in (9) is:
![]() (10)
(10)
Intuitively, the level of ![]() that maximizes
that maximizes ![]() equates the marginal benefit of an extra unit of effort, given by the difference in utilities in the low and high states, with the marginal cost of exerting an extra unit of effort. Let
equates the marginal benefit of an extra unit of effort, given by the difference in utilities in the low and high states, with the marginal cost of exerting an extra unit of effort. Let ![]() denote the agent’s optimal choice of effort given a benefit level
denote the agent’s optimal choice of effort given a benefit level ![]() .
.
Planner’s Problem. The social planner’s objective is to choose the benefit level ![]() that maximizes the agent’s expected utility, taking into account the agent’s endogenous choice of effort:
that maximizes the agent’s expected utility, taking into account the agent’s endogenous choice of effort:
![]() (11)
(11)
![]()
Differentiating (11) and using the first-order condition for ![]() in (10) gives
in (10) gives
![]() (12)
(12)
![]()
where ![]() denotes the elasticity of the probability of being in the bad state (which can be measured as the unemployment rate, rate of health insurance claims, etc.) with respect to the benefit level.19 Notice that in this expression, the behavioral response
denotes the elasticity of the probability of being in the bad state (which can be measured as the unemployment rate, rate of health insurance claims, etc.) with respect to the benefit level.19 Notice that in this expression, the behavioral response ![]() enters only via its impact on the government budget constraint
enters only via its impact on the government budget constraint ![]() . The direct impact of changes in
. The direct impact of changes in ![]() on the agent’s private welfare is second order because the agent has already set
on the agent’s private welfare is second order because the agent has already set ![]() at the optimum that maximizes his private welfare (
at the optimum that maximizes his private welfare (![]() ). This envelope condition plays a critical role in generalizing (12) to richer, more realistic models, as we discuss in Section 3.3.1.
). This envelope condition plays a critical role in generalizing (12) to richer, more realistic models, as we discuss in Section 3.3.1.
Equation (12) does not have a cardinal interpretation because it is scaled in utils. One natural cardinal metric is to normalize the welfare gain from a $1 (balanced budget) increase in the size of the government insurance program by the welfare gain from raising the wage bill in the high state by $1:
 (13)
(13)
The first term in (13) measures the gap in marginal utilities between the high and low states, which quantifies the welfare gain from transferring an additional dollar from the high to low state. The second term measures the net cost to the government of transferring this $1 across states due to behavioral responses. The second term arises because the agent does not internalize the fiscal externality that he imposes on the government budget when changing his level of effort. This creates a wedge between the private return to effort and the social return to effort, generating a welfare loss.
At the optimal benefit level ![]() and hence
and hence
![]() (14)
(14)
This expression is a simple variant of Baily’s (1978) classic formula for the optimal level of social insurance. It captures a simple—and, as we show below, quite robust—intuition about optimal policy: the optimal benefit level equates the marginal gains from a smoother consumption path with the marginal cost, measured by the behavioral response in effort. Note that (14) is a condition that must hold at the optimal benefit level ![]() but is not an explicit formula for the level of benefits because all the parameters in (14) are endogenous to
but is not an explicit formula for the level of benefits because all the parameters in (14) are endogenous to ![]() .
.
Another way to write (14) is in terms of the replacement rate, ![]() :
:
![]() (15)
(15)
where ![]() denotes the elasticity of the probability of being in the bad state with respect to the net wage
denotes the elasticity of the probability of being in the bad state with respect to the net wage ![]() . This formula bears a close resemblance to the inverse elasticity rules that are familiar from the literature on optimal commodity taxation (Auerbach, 1985). Indeed, the optimal social insurance problem is formally identical to an optimal Ramsey taxation problem (Chetty & Saez, 2010).
. This formula bears a close resemblance to the inverse elasticity rules that are familiar from the literature on optimal commodity taxation (Auerbach, 1985). Indeed, the optimal social insurance problem is formally identical to an optimal Ramsey taxation problem (Chetty & Saez, 2010).
It is important to note that Eq. (15) is not an explicit formula for the optimal replacement rate ![]() . The reason is again that the parameters on the right hand side are all functions of
. The reason is again that the parameters on the right hand side are all functions of ![]() . The very purpose of raising
. The very purpose of raising ![]() is to reduce
is to reduce ![]() . Moreover, the elasticity
. Moreover, the elasticity ![]() may also vary with
may also vary with ![]() because of liquidity effects (Chetty, 2008), as we explain below.
because of liquidity effects (Chetty, 2008), as we explain below.
Even in this simple static model, calculating the marginal welfare gain (13) empirically requires some work. The challenge is estimating the gap in marginal utilities ![]() , which requires knowledge of the utility function as well as assets
, which requires knowledge of the utility function as well as assets ![]() and wage rates, which may be unobserved by the econometrician. We now discuss recent approaches to tackling this problem.
and wage rates, which may be unobserved by the econometrician. We now discuss recent approaches to tackling this problem.
3.2 Sufficient Statistics Implementation
The modern literature on social insurance has developed three approaches to recover the marginal utility gap in (13): studying consumption fluctuations (Gruber, 1997), liquidity and substitution effects in effort (Chetty, 2008), and reservation wages (Shimer & Werning, 2007). We present simple derivations of each approach here and review empirical evidence in each context.
3.2.1 Consumption Smoothing
Gruber (1997) implements (13) under the assumption that utility is state independent, i.e., ![]() . We first present Gruber’s approach under this assumption and then show how it can be extended to allow for state-dependent utility. Taking a quadratic approximation to the utility function yields:
. We first present Gruber’s approach under this assumption and then show how it can be extended to allow for state-dependent utility. Taking a quadratic approximation to the utility function yields:
![]() (16)
(16)
where ![]() is the coefficient of relative risk aversion evaluated at
is the coefficient of relative risk aversion evaluated at ![]() and
and ![]() . Plugging this expression into (13), one obtains the following expression for the marginal welfare gain of raising
. Plugging this expression into (13), one obtains the following expression for the marginal welfare gain of raising ![]() :
:
![]()
This equation shows that risk aversion ![]() , the observed consumption drop from the high to low state
, the observed consumption drop from the high to low state ![]() , and the elasticity
, and the elasticity ![]() are together sufficient to calculate the marginal welfare consequences of changing benefits from the current level. It follows that estimating these statistics is adequate to determine whether the current benefit level is too high or low if the welfare function is concave. To go further and calculate the optimal level of benefits, Gruber estimates the relationship between the size of the consumption drop
are together sufficient to calculate the marginal welfare consequences of changing benefits from the current level. It follows that estimating these statistics is adequate to determine whether the current benefit level is too high or low if the welfare function is concave. To go further and calculate the optimal level of benefits, Gruber estimates the relationship between the size of the consumption drop ![]() and the level of benefits
and the level of benefits ![]() . He posits that the effect of benefits on consumption is a linear function of the replacement rate
. He posits that the effect of benefits on consumption is a linear function of the replacement rate ![]() :
:
![]() (17)
(17)
In this specification, ![]() measures the drop in consumption that would occur absent government intervention while
measures the drop in consumption that would occur absent government intervention while ![]() measures the slope of the consumption function with respect to the benefit level. Putting this equation together with (16) and (13) yields the following expression for the marginal welfare gain from increasing the benefit level:
measures the slope of the consumption function with respect to the benefit level. Putting this equation together with (16) and (13) yields the following expression for the marginal welfare gain from increasing the benefit level:
![]() (18)
(18)
Gruber solves for the level of ![]() that sets (18) equal to zero to identify the optimal replacement rate.20 Implementing this formula empirically requires estimates of how consumption fluctuates around shocks as a function of benefit levels (
that sets (18) equal to zero to identify the optimal replacement rate.20 Implementing this formula empirically requires estimates of how consumption fluctuates around shocks as a function of benefit levels (![]() ), the curvature of the utility function
), the curvature of the utility function ![]() , and the elasticity that measures distortions in behavior
, and the elasticity that measures distortions in behavior ![]() . There are now several studies estimating each of these parameters for various social insurance programs; we briefly review some illustrative examples of quasi-experimental studies from this literature here.
. There are now several studies estimating each of these parameters for various social insurance programs; we briefly review some illustrative examples of quasi-experimental studies from this literature here.
Evidence on Consumption Smoothing. An early study by Hamermesh (1982) investigates the impacts of unemployment insurance on consumption using cross-sectional consumption data from the Consumer Expenditure Survey. Because Hamermesh does not have panel data, he cannot study changes in consumption around unemployment shocks. Instead, he compares individuals who are currently unemployed and receiving UI with those who are employed. He finds evidence that the marginal propensity to consume out of UI benefits is significantly higher than out of other sources of income, which he interprets as evidence supporting a consumption-smoothing role of UI.
Cochrane (1991) improves upon the analysis in Hamermesh (1982) by using panel data from the Panel Study of Income Dynamics (PSID). Using panel data, he studies how unemployment shocks affect within-household food consumption fluctuations. This is a significant advance over cross-household comparisons, which are likely to be plagued by omitted variable bias. Cochrane finds that unemployment shocks are imperfectly insured—i.e., ![]() in (17)—implying that there is a potential role for government intervention via unemployment insurance. However, Cochrane does not estimate the extent to which providing insurance through a UI system would affect consumption.21
in (17)—implying that there is a potential role for government intervention via unemployment insurance. However, Cochrane does not estimate the extent to which providing insurance through a UI system would affect consumption.21
Gruber (1997) exploits variation in UI benefit levels that is driven by state law changes to identify ![]() using data on food consumption from the PSID. By controlling flexibly for cross-sectional determinants of the level of UI benefits (such as prior wage rates) and simulating UI benefits based on state laws, Gruber isolates variation in UI benefits that is plausibly orthogonal to other determinants of consumption. Gruber’s point estimates of (17) are
using data on food consumption from the PSID. By controlling flexibly for cross-sectional determinants of the level of UI benefits (such as prior wage rates) and simulating UI benefits based on state laws, Gruber isolates variation in UI benefits that is plausibly orthogonal to other determinants of consumption. Gruber’s point estimates of (17) are ![]() and
and ![]() . These estimates imply that consumption drops on average by 10% given existing UI replacement rates, which are approximately 50% of wages. In the absence of UI, consumption would drop by 24%. Hence, UI plays a significant role in smoothing consumption. However, a 10% increase in UI replacement rates generates only a 2.8% point reduction in the consumption drop. This implies that part of the increase in UI benefits is crowded out by other responses, such as reductions in savings (Engen & Gruber, 2001) and changes in spousal labor supply (Cullen & Gruber, 2000).22
. These estimates imply that consumption drops on average by 10% given existing UI replacement rates, which are approximately 50% of wages. In the absence of UI, consumption would drop by 24%. Hence, UI plays a significant role in smoothing consumption. However, a 10% increase in UI replacement rates generates only a 2.8% point reduction in the consumption drop. This implies that part of the increase in UI benefits is crowded out by other responses, such as reductions in savings (Engen & Gruber, 2001) and changes in spousal labor supply (Cullen & Gruber, 2000).22
Gruber’s approach has since become the benchmark quasi-experimental strategy for analyzing how social insurance affects consumption.23 For instance, Browning and Crossley (2001) implement a similar analysis using data on a broader set of consumption goods from Canada. They find that the average impact of increases in UI benefits on consumption is quite modest, but the impacts are especially large among a subset of households that are likely to be liquidity constrained. Gertler and Gruber (2002) show that severe health shocks have large effects on consumption using panel data from Indonesia and that buffering these shocks by reducing income fluctuations would significantly reduce consumption fluctuations. Bronchetti (2012) implements an approach analogous to Gruber (1997) to the Worker’s Compensation program in the US and again finds evidence that increases in Worker’s Compensation benefits significantly increase consumption levels while individuals are out of work due to injury.
While the evidence that has been accumulated clearly demonstrates that insurance markets are incomplete—i.e., consumption does fall when individuals are hit with shocks—the consumption-smoothing role of social insurance programs is less clear. We can be confident given available evidence that ![]() for at least a subset of households, but we have very imprecise estimates of
for at least a subset of households, but we have very imprecise estimates of ![]() . For instance, the estimates of
. For instance, the estimates of ![]() from Gruber (1997) have a confidence interval spanning
from Gruber (1997) have a confidence interval spanning ![]() . The imprecision and instability of estimates arise from the fact that consumption is very difficult to measure accurately due to noise and recall errors and is typically available for relatively small samples. Obtaining a more precise understanding of the consumption-smoothing benefits of insurance will likely require administrative data on consumption, e.g., from credit-card databases, scanner data, or value-added tax registers.
. The imprecision and instability of estimates arise from the fact that consumption is very difficult to measure accurately due to noise and recall errors and is typically available for relatively small samples. Obtaining a more precise understanding of the consumption-smoothing benefits of insurance will likely require administrative data on consumption, e.g., from credit-card databases, scanner data, or value-added tax registers.
Empirical studies of consumption smoothing have focused on the short-run drop in consumption from employment to unemployment. We show below that this short-run consumption drop is what matters for calculating optimal unemployment benefit levels using (18) irrespective of how consumption evolves after the individual finds a new job. However, it is important to recognize that long-term impacts of temporary shocks on consumption are also significant. von Wachter et al. (2009) show that unemployment shocks due to mass layoffs have large, permanent impacts on earnings. Given that consumption must converge to income in the long run for all workers except the few with substantial wealth before job loss, this result strongly suggests that even temporary unemployment shocks have long-lasting effects. If shocks have persistent impacts on consumption, the optimal insurance policy may not be just to provide benefits while agents are out of work, but rather a wage insurance system that insures long-lasting earnings losses, as proposed e.g., by LaLonde (2007).24 An interesting direction for further work would be to apply the methods reviewed here to analyze optimal wage insurance policies.
Evidence on Distortions in Behavior. The literature on measuring behavioral responses to social insurance programs—the impacts of unemployment insurance on unemployment durations, health insurance on health expenditures, disability insurance on labor force participation rates—has a long tradition that predates the theoretical work on social insurance discussed here. We have much more evidence on the distortions created by insurance programs than their consumption-smoothing benefits because of data availability. For instance, administrative data on unemployment durations must be collected in order to make UI payments, making it much easier to study the impacts of UI on durations than on consumption.
There are many excellent surveys of the literature on how social insurance affects behavior; see e.g., Krueger and Meyer (2002) for a review of work on how UI, DI, and Worker’s Compensation affect labor supply and Cutler and Zeckhauser (2000) or Cutler (2002) for a review on how health insurance affects the demand for medical care. Here, we briefly discuss selected findings from the literature that have been used to inform theoretical calculations of optimal benefit levels using sufficient statistic formulas.
In the context of unemployment, most studies have focused on measuring the impacts of increases in UI benefits on the duration of unemployment. The probability of being laid off could also respond to the level of benefits. The literature has focused less on this issue because UI benefits are typically at least partially experience rated, meaning that firms bear the unemployment insurance cost of laying off workers. In a perfectly experience rated system, changes in the level of benefits do not distort incentives to lay off workers. However, with imperfect experience rating, changes in the level of UI benefits can also affect unemployment rates by distorting firms’ layoff decisions (Blanchard & Tirole, 2008; Feldstein, 1978). While studies such as Topel (1983) and Anderson and Meyer (1993) have documented significant effects of experience rating on firm layoffs, there is relatively little recent work on this issue. Analyzing whether social insurance programs affect the rate at which firms hire and lay off workers using modern quasi-experimental designs is a very promising area for further research.
The modern literature estimating the impact of UI on durations has adopted the hazard model specifications used by Meyer (1990). Meyer estimates semi-parametric models for the hazard of exiting unemployment as a function of UI benefits and other variables using administrative data on the duration of UI claims. He exploits variation in UI benefits coming from differential changes in benefits over time across states, as in Gruber (1997). Meyer finds that higher UI benefits reduce the hazard of exiting unemployment significantly, with an implied elasticity above 0.8 in most specifications.
Subsequent studies have obtained qualitatively similar results using a variety of different data sources. For instance, Lalive, van Ours, and Zweimüller (2006) use a regression-discontinuity design in administrative data from Austria and find that UI benefit increases significantly raise unemployment durations, although to a lesser extent than suggested by Meyer’s estimates. Chetty (2008) estimates elasticities of approximately 0.5 using survey data from the Survey of Income and Program Participation. Landais (2012) replicates Meyer’s analysis using a regression-kink design and estimates smaller elasticities, around 0.3. In general, the literature has settled on a consensus estimate of ![]() for UI and unemployment durations of about 0.5 (Krueger & Meyer, 2002).
for UI and unemployment durations of about 0.5 (Krueger & Meyer, 2002).
Meyer (1990) and Katz and Meyer (1990) document a spike in hazard rates when unemployment benefits expire. This is typically viewed as prima facie evidence that UI distorts search behavior, as it suggests that people time their unemployment exits to coincide with the expiry of social assistance. This spike in unemployment exit hazards in the weeks prior to benefit exhaustion is now a well-established empirical regularity; see Card et al. (2007a) for a review of this literature.
However, Card et al. (2007a) use data from Austria to show that the spike in job finding rates when UI benefits expire is far smaller than the spike in unemployment exit rates. In Austria, as in most other European countries, individuals can stay on the UI system to receive job finding assistance and other benefits even after their benefits expire, but the majority of individuals choose to drop out of the UI system when their benefits end. Most of these individuals, however, remain unemployed even after they leave the UI system. In the US, individuals may choose not to collect their last unemployment check because it is often a small leftover amount, which would create the appearance of a surge in hazard rates in the weeks before benefits expire. Because the margin relevant for calculating the efficiency costs of the UI system are time spent working rather than time spent on the UI system, this evidence suggests that the original sharp spikes documented in the literature likely overstate the degree of moral hazard created by UI. The more general lesson is that it is crucial to measure distortions in real economic choices rather than simply use measures that are well recorded in administrative databases.
Analogous behavioral responses have been documented for other social insurance programs beyond unemployment insurance. Meyer, Viscusi, and Durbin (1995) use differential changes in worker’s compensation benefits across states to show that higher benefit levels induce injured workers to stay out of work longer before returning to work. Gruber (2000) analyzes a disability insurance expansion in Canada that raised benefit levels for individuals in all provinces except Quebec. He finds that this benefit increase significantly reduced labor force participation rates for males ages 45–59, implying an elasticity of the non-participation rate with respect to DI benefits of 0.25. Maestas, Mullen, and Strand (forthcoming) use random variation in assignment to disability insurance examiners to estimate that eligibility for DI reduces labor force participation rates for the marginal entrant to DI by approximately 20% points, with significantly smaller effects for those with more severe impairments. In the context of health insurance, the RAND health insurance experiment (Manning, Newhouse, Duan, Keeler, & Leibowitz, 1987) and Oregon health insurance lotteries (Finkelstein et al., 2011) have demonstrated that increases in consumer cost-sharing significantly reduce health care expenditures.
Evidence on Risk Aversion. Economists have estimated risk aversion using a broad array of techniques. The most direct and widely used method of estimating risk aversion is to assess preferences over gambles. Using empirical estimates of the distribution of risk and an expected utility model with a specific functional form for utility such as constant relative risk aversion, one can back out the value of ![]() implied by individuals’ choices over risky streams of income. Early work in asset pricing inferred risk aversion from portfolio choice and asset returns in standard asset pricing models (e.g., Kocherlakota, 1996; Mehra & Prescott, 1985). More recent work has used responses to hypothetical large-stake gambles (Barsky, Juster, Kimball, & Shapiro, 1997), automobile insurance choices (Cohen & Einav, 2007), risk taking in game shows (Metrick, 1995), and home insurance deductible choices (Sydnor, 2010) to infer risk aversion. There is little consensus on the value of
implied by individuals’ choices over risky streams of income. Early work in asset pricing inferred risk aversion from portfolio choice and asset returns in standard asset pricing models (e.g., Kocherlakota, 1996; Mehra & Prescott, 1985). More recent work has used responses to hypothetical large-stake gambles (Barsky, Juster, Kimball, & Shapiro, 1997), automobile insurance choices (Cohen & Einav, 2007), risk taking in game shows (Metrick, 1995), and home insurance deductible choices (Sydnor, 2010) to infer risk aversion. There is little consensus on the value of ![]() from this literature: the estimates range from 1 to well above 10 in the case of deductible choices and asset prices. One explanation of this discrepancy in estimates is that they reflect the behavior of different subgroups of the population. Barseghyan, Prince, and Teitelbaum (2011) and Einav, Finkelstein, Pascu, and Cullen (forthcoming) test this explanation by examining the risk preferences of the same individuals in different domains of choice, such as health insurance deductibles and 401(k) portfolio allocations. While individuals’ risk preferences are correlated across the domains, there is substantial heterogeneity in estimated risk aversion from each choice.
from this literature: the estimates range from 1 to well above 10 in the case of deductible choices and asset prices. One explanation of this discrepancy in estimates is that they reflect the behavior of different subgroups of the population. Barseghyan, Prince, and Teitelbaum (2011) and Einav, Finkelstein, Pascu, and Cullen (forthcoming) test this explanation by examining the risk preferences of the same individuals in different domains of choice, such as health insurance deductibles and 401(k) portfolio allocations. While individuals’ risk preferences are correlated across the domains, there is substantial heterogeneity in estimated risk aversion from each choice.
All of these estimates of risk aversion are based on ex-ante choices, which requires that individuals’ subjective assessment of risks (e.g., the probability of a large fluctuation in stock prices) and other parameters are consistent with the model assumed by the researcher as well as the maintained assumptions of expected utility theory. Chetty (2006a) proposes a different method of estimating ![]() that does not rely on subjective probabilities. He shows that expected utility models imply a direct connection between the curvature of the utility function over consumption and the impacts of wage changes on labor supply. Intuitively, if the utility function is very curved, individuals should become sated with goods as their income rises, and should choose to work less as their wages rise. The fact that uncompensated wage increases almost always raise labor supply in practice implies an upper bound on the coefficient of relative risk aversion of approximately 1 without any assumptions about the structure of the utility function.25 Because this method of estimating risk aversion uses the same types of ex-post data used to measure
that does not rely on subjective probabilities. He shows that expected utility models imply a direct connection between the curvature of the utility function over consumption and the impacts of wage changes on labor supply. Intuitively, if the utility function is very curved, individuals should become sated with goods as their income rises, and should choose to work less as their wages rise. The fact that uncompensated wage increases almost always raise labor supply in practice implies an upper bound on the coefficient of relative risk aversion of approximately 1 without any assumptions about the structure of the utility function.25 Because this method of estimating risk aversion uses the same types of ex-post data used to measure ![]() and
and ![]() , it offers a more direct estimate of the curvature of utility that matters for evaluating the welfare cost of shocks.26
, it offers a more direct estimate of the curvature of utility that matters for evaluating the welfare cost of shocks.26
Unfortunately, even this ex-post measure of risk aversion varies significantly across contexts. Chetty and Szeidl (2007) develop a theoretical model of risk preferences in which individuals have “consumption commitments”—goods such as housing or fixed service contracts which can only be adjusted by paying fixed transaction costs. In this environment, individuals have amplified risk aversion over moderate-stake shocks because of their commitments. To understand the intuition, consider a two good model in which the agent spends half his income on housing (which can only be adjusted by paying a transaction cost) and half on food (which is freely adjustable). When facing a shock such as temporary job loss that forces them to reduce expenditure by say 10%, most individuals will rationally choose to bear the shock by cutting food consumption by 20% in order to avoid having to move out of their house. This concentrated reduction in food expenditures raises marginal utility sharply, amplifying risk aversion. Chetty and Szeidl confirm this prediction of the model in the PSID data used by Cochrane and Gruber: homeowners who become unemployed do not change housing consumption but cut back on food consumption significantly, while renters (who face lower adjustment costs) diversify the shocks more broadly by reducing consumption of both food and housing. Chetty and Szeidl’s analysis suggests that the value of ![]() relevant for shocks such as unemployment could be as high as
relevant for shocks such as unemployment could be as high as ![]() because of fixed commitments. However, for large shocks such as permanent disability that induce households to abandon commitments, the relevant value of
because of fixed commitments. However, for large shocks such as permanent disability that induce households to abandon commitments, the relevant value of ![]() could be closer to 1.
could be closer to 1.
Because of the tremendous uncertainty about the appropriate value of ![]() , researchers typically report welfare calculations for a range of values of
, researchers typically report welfare calculations for a range of values of ![]() . Gruber implements the formula in (18) using his own estimates of the consumption smoothing response and estimates of
. Gruber implements the formula in (18) using his own estimates of the consumption smoothing response and estimates of ![]() from Meyer (1990). He finds that with a coefficient of relative risk aversion
from Meyer (1990). He finds that with a coefficient of relative risk aversion ![]() , increasing the UI benefit level above the levels observed in his data (roughly 50% of the wage) would lead to substantial welfare losses. Extrapolating out-of-sample based on the assumption that
, increasing the UI benefit level above the levels observed in his data (roughly 50% of the wage) would lead to substantial welfare losses. Extrapolating out-of-sample based on the assumption that ![]() remains constant and the consumption function is given by (17), Gruber shows that it is difficult to justify having a positive level of UI benefits (
remains constant and the consumption function is given by (17), Gruber shows that it is difficult to justify having a positive level of UI benefits (![]() ) with risk aversion
) with risk aversion ![]() given his estimates of the consumption-smoothing benefit of UI. With
given his estimates of the consumption-smoothing benefit of UI. With ![]() , however, the optimal benefit level could be as large as 50%. Bronchetti (2012) presents estimates of the optimal level of Worker’s Compensation benefits based on a range of values for
, however, the optimal benefit level could be as large as 50%. Bronchetti (2012) presents estimates of the optimal level of Worker’s Compensation benefits based on a range of values for ![]() using the formula in (18). She concludes that the optimal level of worker’s compensation benefits is likely to be below the current level of 68%, but her estimates of the optimal replacement rate range from 26% to 61% as risk aversion varies from
using the formula in (18). She concludes that the optimal level of worker’s compensation benefits is likely to be below the current level of 68%, but her estimates of the optimal replacement rate range from 26% to 61% as risk aversion varies from ![]() to
to ![]() . Bound, Cullen, Nichols, and Schmidt (2004) calculate the welfare gains from the current Disability Insurance program under varying degrees of risk aversion taking account of heterogeneity across individuals. Based on simulations of the benefits of DI, they conclude that the optimal level of benefits is likely somewhat lower than current levels, but the optimal level of benefits again is quite sensitive to assumptions about
. Bound, Cullen, Nichols, and Schmidt (2004) calculate the welfare gains from the current Disability Insurance program under varying degrees of risk aversion taking account of heterogeneity across individuals. Based on simulations of the benefits of DI, they conclude that the optimal level of benefits is likely somewhat lower than current levels, but the optimal level of benefits again is quite sensitive to assumptions about ![]() .
.
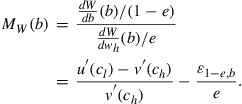
Estimating risk aversion accurately is particularly important because the size of the consumption drop ![]() is inversely related to
is inversely related to ![]() , as shown by Chetty and Looney (2006). As a result, the welfare gains from insurance could be large even if consumption drops are small, as documented by Townsend (1994) and others in developing economies. Intuitively, highly risk averse households—e.g., those facing subsistence constraints—are likely to have very smooth consumption paths because they will go to any effort (e.g., by taking their children out of school in developing countries) in order to subsist. But these efforts to smooth consumption are very costly—i.e.,
, as shown by Chetty and Looney (2006). As a result, the welfare gains from insurance could be large even if consumption drops are small, as documented by Townsend (1994) and others in developing economies. Intuitively, highly risk averse households—e.g., those facing subsistence constraints—are likely to have very smooth consumption paths because they will go to any effort (e.g., by taking their children out of school in developing countries) in order to subsist. But these efforts to smooth consumption are very costly—i.e., ![]() is highly convex. Chetty and Looney show that the marginal gains from insurance, given by
is highly convex. Chetty and Looney show that the marginal gains from insurance, given by ![]() , could actually be larger in economies with smoother consumption paths if that smoothness is driven by greater risk aversion.
, could actually be larger in economies with smoother consumption paths if that smoothness is driven by greater risk aversion.
State-Dependent Utility. When utility is state-dependent, the consumption-smoothing approach requires estimation of an additional parameter that measures the degree to which marginal utilities vary across states. With state-dependent utility, the quadratic approximation used above yields
![]()
where ![]() denotes the coefficient of relative risk aversion in the employed state and
denotes the coefficient of relative risk aversion in the employed state and ![]() measures the degree of state dependence in marginal utilities. The parameter
measures the degree of state dependence in marginal utilities. The parameter ![]() answers the question, “starting from equal consumption in the low and high states, how much would the agent pay to reallocate $1 of consumption from the high state to the low state?” If utility is not state-dependent, the answer to this question would be
answers the question, “starting from equal consumption in the low and high states, how much would the agent pay to reallocate $1 of consumption from the high state to the low state?” If utility is not state-dependent, the answer to this question would be ![]() . If the marginal utility of consumption is higher when the agent is in the low state, the willingness to pay is
. If the marginal utility of consumption is higher when the agent is in the low state, the willingness to pay is ![]() .27 The parameter
.27 The parameter ![]() directly enters the formula for
directly enters the formula for ![]() in (18) as an additive term. If
in (18) as an additive term. If ![]() , insurance has greater value because it is transferring resources to a state where money has more value at any given level of consumption.
, insurance has greater value because it is transferring resources to a state where money has more value at any given level of consumption.
Finkelstein, Luttmer, and Notowidigdo (2009) describe some approaches to estimating ![]() . Broadly speaking,
. Broadly speaking, ![]() can be estimated based on either choice data that reveals individuals’ demand for moving resources across states or based on observed utility changes as states change. For example, the extent to which agents voluntarily choose to have more or less consumption in high vs. low states reveals
can be estimated based on either choice data that reveals individuals’ demand for moving resources across states or based on observed utility changes as states change. For example, the extent to which agents voluntarily choose to have more or less consumption in high vs. low states reveals ![]() in an environment with perfect insurance. Unfortunately, most individuals are not perfectly insured in practice—if they were, there would be no reason for social insurance to begin with!—and it is rare to be able to observe consumption across state changes in data (e.g., health shocks or unemployment spells). Absent perfect insurance, one can try to focus on subgroups that are better insured. This requires assumptions about the degree of insurance one has. Moreover, since the life cycle budget constraint must be satisfied, inferring state dependence from the consumption fluctuations of individuals who experience different unexpected shocks (such as health events) requires strong assumptions about the nature of bequest motives. For example, Lillard and Weiss (1997) estimate a structural model of health shocks and use data on consumption trajectories to identify
in an environment with perfect insurance. Unfortunately, most individuals are not perfectly insured in practice—if they were, there would be no reason for social insurance to begin with!—and it is rare to be able to observe consumption across state changes in data (e.g., health shocks or unemployment spells). Absent perfect insurance, one can try to focus on subgroups that are better insured. This requires assumptions about the degree of insurance one has. Moreover, since the life cycle budget constraint must be satisfied, inferring state dependence from the consumption fluctuations of individuals who experience different unexpected shocks (such as health events) requires strong assumptions about the nature of bequest motives. For example, Lillard and Weiss (1997) estimate a structural model of health shocks and use data on consumption trajectories to identify ![]() under the assumption that the marginal utility of bequests does not depend on health. They estimate
under the assumption that the marginal utility of bequests does not depend on health. They estimate ![]() , i.e., positive state dependence for health and disability.28
, i.e., positive state dependence for health and disability.28
An alternative approach to identify state dependence that does not require choice data from environments with full insurance is to use data on subjective well being. Intuitively, by estimating whether a cash grant has a larger impact on happiness in the low vs. high state, one can learn about ![]() . The challenge in implementing this approach is that subjective well-being measures have no inherent cardinal interpretation, whereas
. The challenge in implementing this approach is that subjective well-being measures have no inherent cardinal interpretation, whereas ![]() is a cardinal parameter.29 One must therefore choose a cardinal scale for happiness to estimate
is a cardinal parameter.29 One must therefore choose a cardinal scale for happiness to estimate ![]() using data on subjective well being. One approach is to scale happiness so that one obtains estimates of the coefficient of relative risk aversion
using data on subjective well being. One approach is to scale happiness so that one obtains estimates of the coefficient of relative risk aversion ![]() that match estimates from choice data. Finkelstein, Luttmer, and Notowidigdo (2008) implement such an approach and conclude based on survey data that
that match estimates from choice data. Finkelstein, Luttmer, and Notowidigdo (2008) implement such an approach and conclude based on survey data that ![]() , i.e., the marginal utility of consumption is higher when individuals are healthy. In sum, there is currently little consensus in the literature on the sign of
, i.e., the marginal utility of consumption is higher when individuals are healthy. In sum, there is currently little consensus in the literature on the sign of ![]() for shocks such as unemployment, disability, and sickness, let alone its magnitude in these contexts. We view this as an important but challenging area for future work.
for shocks such as unemployment, disability, and sickness, let alone its magnitude in these contexts. We view this as an important but challenging area for future work.
Because optimal benefit calculations are highly sensitive to the assumed value of ![]() and
and ![]() , more recent studies have sought alternative techniques for recovering the gap in marginal utilities that do not require estimates of these parameters. We now turn to these alternative approaches.
, more recent studies have sought alternative techniques for recovering the gap in marginal utilities that do not require estimates of these parameters. We now turn to these alternative approaches.
3.2.2 Liquidity vs. Moral Hazard
Chetty (2008) shows that the gap in marginal utilities in (13) can be inferred from the comparative statics of effort choice, yielding a formula for optimal benefits that does not require any data on consumption or risk preferences. Recall that the first order condition for effort in our static model is ![]() . Now consider the effect of an exogenous cash grant (such as a severance payment to job losers) on effort, holding fixed the tax
. Now consider the effect of an exogenous cash grant (such as a severance payment to job losers) on effort, holding fixed the tax ![]() :
:
![]() (19)
(19)
The effect of increasing the benefit level on effort (again holding ![]() fixed) is:
fixed) is:
![]() (20)
(20)
Finally, the effect of increasing the wage in the high state on effort is:
![]() (21)
(21)
Combining (19) and (20), we see that the ratio of the “liquidity” effect (![]() ) to the “substitution” effect (
) to the “substitution” effect (![]() ) recovers the gap in marginal utilities:
) recovers the gap in marginal utilities:
![]()
Plugging this expression into (13) yields the following expression for the welfare gain from increasing the benefit level:
![]() (22)
(22)
In this formula, the degree to which marginal utilities fluctuate across states is identified from the relative size of liquidity and moral hazard effects in the impact of benefit levels on effort.30 In a model with perfect consumption smoothing, the liquidity effect ![]() , because a cash grant raises
, because a cash grant raises ![]() and
and ![]() by the same amount. Note that unlike the consumption-smoothing method above, this approach does not require estimation of the degree of risk aversion or state dependence in utility.31
by the same amount. Note that unlike the consumption-smoothing method above, this approach does not require estimation of the degree of risk aversion or state dependence in utility.31
One intuition for the liquidity vs. moral hazard formula comes from familiar results from price theory. The impact of an increase in ![]() on
on ![]() can be decomposed into two terms, analogous to a Slutsky decomposition:
can be decomposed into two terms, analogous to a Slutsky decomposition: ![]() . The first term is analogous to an income effect, and reflects the fact that higher benefits also raise agents’ cash-on-hand and thus reduce the supply of effort. The second term is a pure substitution (price) effect and arises from the distortion in marginal incentives created by the social insurance program. The substitution effect is efficiency reducing because it reflects second-best behavior arising from the wedge between private and social incentives. In contrast, the liquidity effect is efficiency enhancing because it allows the agent to choose a level of
. The first term is analogous to an income effect, and reflects the fact that higher benefits also raise agents’ cash-on-hand and thus reduce the supply of effort. The second term is a pure substitution (price) effect and arises from the distortion in marginal incentives created by the social insurance program. The substitution effect is efficiency reducing because it reflects second-best behavior arising from the wedge between private and social incentives. In contrast, the liquidity effect is efficiency enhancing because it allows the agent to choose a level of ![]() that is closer to what he would choose with complete markets. The size of the liquidity effect measures the extent to which insurance markets are incomplete. The ratio of the liquidity effect to the distortionary substitution effect thus captures the marginal benefit of social insurance.
that is closer to what he would choose with complete markets. The size of the liquidity effect measures the extent to which insurance markets are incomplete. The ratio of the liquidity effect to the distortionary substitution effect thus captures the marginal benefit of social insurance.
Another way to understand (22) is that it uses revealed preference to value the benefits of insurance. Consider an application to health insurance. The effect of a lump-sum cash grant on health care consumption reveals the extent to which health insurance permits the agent to attain a more socially desirable allocation. If the agent chooses to spend a lump-sum grant on buying a new car instead of purchasing more health care, we infer that the agent only spends more on health care when health insurance benefits are increased because of the price subsidy for doing so. In this case, health insurance simply creates inefficiency by distorting the private cost of health care below the social cost, implying ![]() . In contrast, if the agent raises his health expenditures substantially even when he receives a non-distortionary lump-sum cash grant, we infer that insurance permits him to make a more (socially) optimal choice, i.e., the choice he would make if insurance market failures could be alleviated without distorting incentives. The liquidity vs. moral hazard approach in (22) thus identifies the policy that is best from the libertarian criterion of correcting market failures as revealed by individual choice.
. In contrast, if the agent raises his health expenditures substantially even when he receives a non-distortionary lump-sum cash grant, we infer that insurance permits him to make a more (socially) optimal choice, i.e., the choice he would make if insurance market failures could be alleviated without distorting incentives. The liquidity vs. moral hazard approach in (22) thus identifies the policy that is best from the libertarian criterion of correcting market failures as revealed by individual choice.
It follows from Eq. (22) that larger elasticities ![]() do not necessarily mean that social insurance is less desirable, a point emphasized by Nyman (2003) in the context of health insurance. It matters whether a higher value of
do not necessarily mean that social insurance is less desirable, a point emphasized by Nyman (2003) in the context of health insurance. It matters whether a higher value of ![]() comes from a larger liquidity (
comes from a larger liquidity (![]() ) or moral hazard (
) or moral hazard (![]() ) component. To the extent that comes from a liquidity effect, insurance reduces the need for agents to make suboptimal choices driven by insufficient ability to smooth consumption. In contrast, if
) component. To the extent that comes from a liquidity effect, insurance reduces the need for agents to make suboptimal choices driven by insufficient ability to smooth consumption. In contrast, if ![]() is large primarily because of a moral hazard effect, insurance is distorting incentives. For instance, the reductions in labor force participation caused by disability insurance documented by Maestas, Mullen, and Strand (2011) may not be undesirable. If DI helps individuals whose marginal product is lower than their disutility of work, this behavioral response is welfare improving.
is large primarily because of a moral hazard effect, insurance is distorting incentives. For instance, the reductions in labor force participation caused by disability insurance documented by Maestas, Mullen, and Strand (2011) may not be undesirable. If DI helps individuals whose marginal product is lower than their disutility of work, this behavioral response is welfare improving.
Evidence on Liquidity vs. Moral Hazard. The advantage of this formula relative to (18) is that it can be implemented purely using data on ![]() (e.g., unemployment durations or health expenditures). Chetty (2008) implements (22) using survey data from the US. He estimates
(e.g., unemployment durations or health expenditures). Chetty (2008) implements (22) using survey data from the US. He estimates ![]() using data from the Survey of Income and Program Participation, following the specifications in Meyer (1990). Using the SIPP data, Chetty shows that individuals who have low levels of assets prior to job loss exhibit much higher levels of
using data from the Survey of Income and Program Participation, following the specifications in Meyer (1990). Using the SIPP data, Chetty shows that individuals who have low levels of assets prior to job loss exhibit much higher levels of ![]() than those with higher levels of assets. This suggests that a significant part of the impact of UI benefits on durations may be driven by a liquidity effect. Chetty then estimates
than those with higher levels of assets. This suggests that a significant part of the impact of UI benefits on durations may be driven by a liquidity effect. Chetty then estimates ![]() by studying the effects of lump sum severance payments on unemployment durations using data from a survey of UI exhaustees conducted by Mathematica in collaboration with the Department of Labor. He finds that individuals who receive lump sum severance payments have significantly longer unemployment durations, especially if they have low levels of assets prior to job loss. Using his estimates, Chetty calculates the welfare gain of raising the UI benefit level from the current replacement rate of approximately 50% of wages. He finds that the welfare gains from raising
by studying the effects of lump sum severance payments on unemployment durations using data from a survey of UI exhaustees conducted by Mathematica in collaboration with the Department of Labor. He finds that individuals who receive lump sum severance payments have significantly longer unemployment durations, especially if they have low levels of assets prior to job loss. Using his estimates, Chetty calculates the welfare gain of raising the UI benefit level from the current replacement rate of approximately 50% of wages. He finds that the welfare gains from raising ![]() are small but positive, suggesting that the current benefit level is slightly below but near the optimum.
are small but positive, suggesting that the current benefit level is slightly below but near the optimum.
Chetty’s (2008) analysis relies on cross-sectional variation across individuals in severance pay, and therefore rests on the strong identification assumption that severance recipients and non-recipients are comparable. More recent studies have documented similar results using research designs that make weaker assumptions. Card, Chetty, and Weber (2007b) use a regression-discontinuity design that exploits a universal cutoff for severance pay eligibility based on job tenure in Austria. Using administrative data for the universe of job losers in Austria, they show that individuals laid off just after the tenure cutoff—who receive 2 months of wages as a lump sum severance payment as a result—have unemployment durations that are about 10 days longer than individuals laid off just before the cutoff. They compare these liquidity effects to the impacts of UI benefit extensions using a similar RD design and show that the size of liquidity effects is large relative to the impact of benefit extensions, implying that many unemployed individuals are liquidity constrained. Centeno and Novo (2009) present evidence that liquidity constrained households are more sensitive to UI benefit changes using a regression-discontinuity design in Portugal. LaLumia (2011) shows that individuals who happen to be laid off after they receive a tax refund (and have more cash-on-hand) have longer unemployment durations relative to individuals laid off at other times of the year.
There is less evidence on liquidity effects in other insurance programs because of the relatively recent development of these formulas and because researchers have not yet formulated quasi-experimental designs to estimate liquidity effects ![]() for many programs. One exception is Nyman (2003), who presents considerable anecdotal evidence and theoretical arguments suggesting that liquidity effects play a very important role in health insurance. The benefits of health insurance are extremely difficult to quantify, making the liquidity-based revealed preference approach particularly attractive in that context. Finding research designs to identify liquidity effects in health and other insurance programs is thus a very promising area for further work.
for many programs. One exception is Nyman (2003), who presents considerable anecdotal evidence and theoretical arguments suggesting that liquidity effects play a very important role in health insurance. The benefits of health insurance are extremely difficult to quantify, making the liquidity-based revealed preference approach particularly attractive in that context. Finding research designs to identify liquidity effects in health and other insurance programs is thus a very promising area for further work.
3.2.3 Reservation Wages
Shimer and Werning (2007) show that the gap in marginal utilities can be recovered from the comparative statics of reservation wages in a standard model of job search. They analyze a model in which the probability of finding a job, ![]() , is determined by the agent’s decision to accept or reject a wage offer rather than by search effort. Wage offers are drawn from a distribution
, is determined by the agent’s decision to accept or reject a wage offer rather than by search effort. Wage offers are drawn from a distribution ![]() . If the agent rejects the job offer, he receives income of
. If the agent rejects the job offer, he receives income of ![]() as in the baseline model above.32
as in the baseline model above.32
The agent rejects any net-of-tax wage offer ![]() below his outside option
below his outside option ![]() , i.e., his reservation wage once searching for a job is
, i.e., his reservation wage once searching for a job is ![]() . Therefore,
. Therefore, ![]() and the agent’s expected utility when searching for a job is
and the agent’s expected utility when searching for a job is
![]()
Now suppose we ask the agent what wage he would be willing to accept with certainty before the start of job search. Define the agent’s reservation wage prior to job search as the wage ![]() that would make the agent indifferent between accepting a job immediately vs. starting the process of job search, which yields expected utility of
that would make the agent indifferent between accepting a job immediately vs. starting the process of job search, which yields expected utility of ![]() . This pre-job-search reservation wage
. This pre-job-search reservation wage ![]() satisfies
satisfies
![]()
The government’s problem is to
![]() (23)
(23)
Differentiating (23) gives the following formula for the marginal welfare gain of raising ![]() :33
:33
![]() (24)
(24)
In this formula, ![]() encodes the marginal value of insurance because the agent’s reservation wage directly measures his expected value when unemployed. Intuitively, if agents can smooth marginal utilities perfectly across states, their reservation wage will depend purely on their expected income, and the marginal value of raising
encodes the marginal value of insurance because the agent’s reservation wage directly measures his expected value when unemployed. Intuitively, if agents can smooth marginal utilities perfectly across states, their reservation wage will depend purely on their expected income, and the marginal value of raising ![]() by $1 (holding fixed
by $1 (holding fixed ![]() ) is simply
) is simply ![]() . But this marginal gain is outweighed by the cost of financing the extra dollar of benefits, which exceeds
. But this marginal gain is outweighed by the cost of financing the extra dollar of benefits, which exceeds ![]() because of the behavioral response
because of the behavioral response ![]() . When marginal utilities fluctuate across states, agents value an increase in
. When marginal utilities fluctuate across states, agents value an increase in ![]() at more than its actuarial cost, increasing the marginal value of public insurance. The extent to which agents value insurance can be captured by asking them how their valuation of being in the unemployed state varies with
at more than its actuarial cost, increasing the marginal value of public insurance. The extent to which agents value insurance can be captured by asking them how their valuation of being in the unemployed state varies with ![]() , which is the parameter
, which is the parameter ![]() . Like the liquidity vs. moral hazard method, this approach also does not require identification of state dependence in utility or risk aversion.
. Like the liquidity vs. moral hazard method, this approach also does not require identification of state dependence in utility or risk aversion.
An interesting implication of this result is that a higher sensitivity of reservation wages to benefits implies a larger value of social insurance, contrary to the intuition embodied in earlier empirical studies (e.g., Feldstein & Poterba, 1984), which view the sensitivity of reservation wages to UI benefits as a distortion. This point, like the moral hazard vs. liquidity decomposition above, illustrates the importance of connecting empirical estimates to models in order to fully understand the implications of empirical findings for policy.
Evidence on Reservation Wages. A long literature has sought to measure unemployed workers’ reservation wages; see Devine and Kiefer (1991) for a review of early work and Krueger and Mueller (2011) for recent evidence. While these studies have shown that reservation wages have predictive power for unemployment durations and the types of offers that workers accept, they have also documented significant problems with self-reported reservation wage measures. For instance, a large fraction of workers end up accepting jobs that pay below their reported reservation wage. Moreover, most jobs have many characteristics that matter beyond the wage rate, such as the nature of the work or commuting distance. A one-dimensional reservation wage measure does not incorporate these other dimensions. When jobs have multiple characteristics, in order to implement (24), one would ideally like to measure how reservation utilities for jobs vary with the benefit rate. Because such reservation utilities cannot be easily measured, it is difficult to estimate ![]() accurately.
accurately.
Perhaps because of these measurement issues, there is relatively little evidence on the impact of UI benefits on reservation wages. Feldstein and Poterba (1984) use survey data from the Current Population Survey to estimate ![]() by studying how changes in UI benefit levels affect reported reservation wages. Their point estimates imply a substantial correlation between UI benefit levels and reservation wages. However, their specification does not isolate purely exogenous variation in UI benefits due to law changes, as in more recent work, which raises concerns about omitted variable bias. Shimer and Werning implement (23) using an estimate of
by studying how changes in UI benefit levels affect reported reservation wages. Their point estimates imply a substantial correlation between UI benefit levels and reservation wages. However, their specification does not isolate purely exogenous variation in UI benefits due to law changes, as in more recent work, which raises concerns about omitted variable bias. Shimer and Werning implement (23) using an estimate of ![]() from Feldstein and Poterba (1984) and find a large, positive value for
from Feldstein and Poterba (1984) and find a large, positive value for ![]() at current benefit levels. They caution, however, that their exercise must be viewed as purely illustrative given the uncertainty in estimates of
at current benefit levels. They caution, however, that their exercise must be viewed as purely illustrative given the uncertainty in estimates of ![]() and call for further work on estimating this parameter using alternative methods.
and call for further work on estimating this parameter using alternative methods.
One alternative approach is to use data on actual wages obtained at the next job and back out the implied distribution of reservation wages. There are now a large set of studies using administrative panel data that study whether increasing UI benefits raises subsequent wage rates. Card et al. (2007b) use a regression-discontinuity design in data from Austria to show that individuals eligible for 10 additional weeks of UI benefits take more time to find a job but do not have higher wages at their next job. Their estimates are sufficiently precise to rule out even a 1% increase in the wage rate at the upper bound of the 95% confidence interval. They also show that there are no detectable impacts on other observable job characteristics or on the number of years the worker spends at his next job, a summary measure of job match quality. Subsequent studies using similar RD designs have reached very similar conclusions. For instance, Lalive (2007) studies a 170 week benefit extension in Austria and shows that it has no impact on subsequent wages. van Ours and Vodopivec (2008) use a difference-in-difference approach using data from Slovenia and find that changes in benefit duration from 6 months to 3 months had no impact on subsequent earnings. These findings that ex-post observed wages are unaffected by benefit levels imply that reservation wages must be unaffected by benefit levels, i.e., ![]() .
.
How can UI have significant consumption smoothing and liquidity benefits but little effect on ex-post wages? Lentz and Tranas (2005), Chetty (2008), and Card et al. (2007b) develop pure search intensity models with borrowing constraints that generate these patterns. We present a stylized version of this model in Section 3.3.1 below. In these models, workers can control the amount of effort they spend searching for a job, but have a fixed wage rate. Such models can be viewed as an approximation to an environment in which the arrival rate of suitable job offers is relatively low, so the option value of waiting for a better offer is small and most workers take the first offer they receive. One puzzling feature of the data given this explanation is that there is tremendous heterogeneity in observed wage changes from the previous job to the new job across unemployed workers. Understanding how the variance of job offers can be reconciled with the lack of mean impacts of UI benefits on reservation wages is an open question for future research.34
In summary, there are now a variety of methods of calculating the welfare gains from increasing benefit levels in social insurance programs, but each of the methods yields different results because empirical evidence on many of the key parameters remains inadequate. Moreover, the three formulas discussed above are not an exhaustive list of potential approaches for connecting theory to data in analyzing optimal benefit levels for social insurance. There could be many other representations of the optimality condition in (13) that could be useful for applied work. The multiplicity of formulas for ![]() is a general property of the sufficient statistic approach (Chetty, 2009). Because the positive model is not fully identified by the inputs to the formula, there are generally several representations of the formula for welfare gains. This flexibility allows researchers to use the representation most suitable for their applications given the available variation and data.
is a general property of the sufficient statistic approach (Chetty, 2009). Because the positive model is not fully identified by the inputs to the formula, there are generally several representations of the formula for welfare gains. This flexibility allows researchers to use the representation most suitable for their applications given the available variation and data.
3.3 Generalizing the Static Model
The analysis above rests on a static model that makes several strong assumptions that are unlikely to hold in practice. Many of these assumptions turn out to have little impact on the formulas for optimal social insurance derived above, which is why these formulas have been widely applied. However, there are some assumptions that are more consequential and raise issues that remain unresolved. In this section, we consider the consequences of each of the main assumptions in turn. The general principle is that if agents’ choices in the private sector maximize private surplus, then the formulas derived above continue to hold irrespective of the structure of the model. However, as soon as choices do not maximize private surplus—either because of externalities or imperfect optimization—the formulas no longer hold.
One important assumption that we do not relax below—not because it is inconsequential but rather because there is very limited normative work on this issue—is that wage rates and all other prices are fixed. That is, we do not consider the possibility that changes in social insurance policies will affect market clearing prices in general equilibrium. Acemoglu and Shimer (1999) analyze optimal unemployment insurance in an equilibrium search model with endogenous occupation choice and show that expanding UI can improve efficiency in this environment by encouraging more workers to take high-wage, high-risk jobs. There is no empirical evidence to date on the magnitude of such effects.35 Perhaps an even greater challenge is that there are no results to date on how such empirical estimates could be connected to equilibrium models to make quantitative statements about optimal policy.
3.3.1 Dynamics: Endogenous Savings and Borrowing Constraints
The most important limitation of the model analyzed above is that it does not incorporate dynamics. In dynamic models, agents can smooth consumption across periods and thus “self insure” part of the income fluctuations they face, potentially reducing the value of social insurance. In addition, social insurance distorts not just agents’ effort choices but also their consumption and savings decisions. Hubbard, Skinner, and Zeldes (1995) present simulation evidence suggesting that social insurance and means-tested transfer programs can substantially reduce savings rates. Engen and Gruber (2001) show that increases in UI benefits have small but significant effects on wealth accumulation prior to job loss among workers at risk of layoff. These intertemporal consumption-smoothing and savings responses may be further complicated by borrowing constraints, generating buffer stock behavior as in Deaton (1991) or Carroll (1997).
Models that incorporate all of these features have been widely studied and are complex and difficult to solve analytically. Surprisingly, however, the three simple formulas for the marginal welfare gain from raising social insurance benefits derived above continue to hold in such models with small modifications. Because this result underpins much of the modern literature on connecting theory to data in analyzing optimal social insurance, we provide a simple proof here.
We analyze the optimal level of unemployment benefits in a dynamic job search model with borrowing constraints, following Lentz and Tranas (2005) and Chetty (2008). For instructive purposes, we structure the analysis to parallel the steps for the static case in Section 3.1: (1) model setup, (2) characterizing the agent’s problem, (3) the planner’s problem, (4) deriving a condition for optimal benefits by exploiting envelope conditions, and (5) deriving empirically implementable sufficient statistic formulas.
Setup. The agent lives for ![]() periods
periods ![]() . The interest rate and the agent’s time discount rate are set to zero to simplify notation. The agent becomes (exogenously) unemployed at
. The interest rate and the agent’s time discount rate are set to zero to simplify notation. The agent becomes (exogenously) unemployed at ![]() . An agent who enters a period
. An agent who enters a period ![]() without a job first chooses search effort
without a job first chooses search effort ![]() . As in the static case, we normalize
. As in the static case, we normalize ![]() to equal the probability of finding a job in the current period. Let
to equal the probability of finding a job in the current period. Let ![]() denote the cost of search effort, which is strictly increasing and convex. If search is successful, the agent begins working immediately in period
denote the cost of search effort, which is strictly increasing and convex. If search is successful, the agent begins working immediately in period ![]() . All jobs last indefinitely once found.
. All jobs last indefinitely once found.
We make two assumptions to simplify exposition: (1) the agent earns a fixed pre-tax wage of ![]() when employed, eliminating reservation wage choices and (2) assets prior to job loss (
when employed, eliminating reservation wage choices and (2) assets prior to job loss (![]() ) are exogenous, eliminating effects of UI benefits on savings behavior prior to job loss. Neither assumption affects the results below (Chetty, 2008).
) are exogenous, eliminating effects of UI benefits on savings behavior prior to job loss. Neither assumption affects the results below (Chetty, 2008).
If the worker is unemployed in period ![]() , he receives an unemployment benefit
, he receives an unemployment benefit ![]() . If the worker is employed in period
. If the worker is employed in period ![]() , he pays a tax
, he pays a tax ![]() . Let
. Let ![]() denote the agent’s consumption in period
denote the agent’s consumption in period ![]() if a job is found in that period. Note that the agent will optimally set consumption at
if a job is found in that period. Note that the agent will optimally set consumption at ![]() for all
for all ![]() as well because he faces no uncertainty once he finds a job and therefore smooth consumption perfectly. If the agent fails to find a job in period
as well because he faces no uncertainty once he finds a job and therefore smooth consumption perfectly. If the agent fails to find a job in period ![]() , he sets consumption to
, he sets consumption to ![]() . The agent then enters period
. The agent then enters period ![]() unemployed and the problem repeats. Let
unemployed and the problem repeats. Let ![]() denote flow consumption utility when unemployed and
denote flow consumption utility when unemployed and ![]() denote flow utility when employed.
denote flow utility when employed.
Agent’s Problem. We characterize the solution to the agent’s problem using discrete-time dynamic programming. The value function for an individual who finds a job at the beginning of period ![]() , conditional on beginning the period with assets
, conditional on beginning the period with assets ![]() is
is
![]() (25)
(25)
where ![]() is the borrowing constraint. The value function for an individual who fails to find a job at the beginning of period
is the borrowing constraint. The value function for an individual who fails to find a job at the beginning of period ![]() and remains unemployed is
and remains unemployed is
![]() (26)
(26)
where
![]() (27)
(27)
is the value of entering period ![]() without a job with assets
without a job with assets ![]() .36
.36
An unemployed agent chooses ![]() to maximize expected utility at the beginning of period
to maximize expected utility at the beginning of period ![]() , given by (27). Optimal search intensity is determined by the first-order condition
, given by (27). Optimal search intensity is determined by the first-order condition
![]() (28)
(28)
The condition parallels (10) in the static model, except that the marginal value of search effort is given by the difference between the optimized present values of employment and unemployment in the dynamic model rather than the difference in flow utilities.
Planner’s Problem. The social planner’s objective is to choose the unemployment benefit level ![]() that maximizes the agent’s expected utility at time 0,
that maximizes the agent’s expected utility at time 0, ![]() , subject to balancing the government’s budget. Let
, subject to balancing the government’s budget. Let ![]()
![]() denote the agent’s expected unemployment duration. The planner’s problem is:
denote the agent’s expected unemployment duration. The planner’s problem is:
![]() (29)
(29)
Differentiating ![]() w.r.t.
w.r.t. ![]() yields:
yields:
![]() (30)
(30)
The key step in obtaining an empirically implementable representation of (30) is to exploit the envelope conditions for ![]() , and
, and ![]() . These variables are all chosen to maximize the agent’s expected utility at each stage of his dynamic program. Because changes in these variables do not have a first-order impact on utility, one can ignore the impacts of changes in
. These variables are all chosen to maximize the agent’s expected utility at each stage of his dynamic program. Because changes in these variables do not have a first-order impact on utility, one can ignore the impacts of changes in ![]() and
and ![]() on these choices when calculating the derivatives in (30). Hence, the only terms that appear in the derivatives are the marginal utilities in which
on these choices when calculating the derivatives in (30). Hence, the only terms that appear in the derivatives are the marginal utilities in which ![]() and
and ![]() directly appear. To characterize these terms, define the average marginal utility of consumption while unemployed as
directly appear. To characterize these terms, define the average marginal utility of consumption while unemployed as
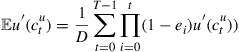
and the average marginal utility of consumption while employed as
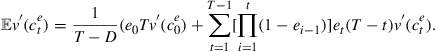
Some algebra yields:
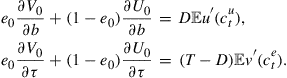
The government’s budget constraint implies that ![]() . Combining these expressions, it follows that
. Combining these expressions, it follows that
![]()
As in the static model, we normalize the welfare gain from a $1 increase in the size of the government insurance program by the welfare gain from raising the wage bill in the high state by $1 to obtain
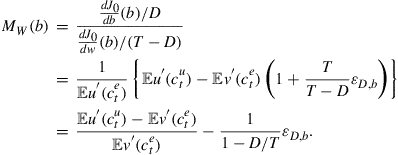 (31)
(31)
This expression coincides with the formula for ![]() from the static model in (13) with two changes. First, the fraction of time spent unemployed is measured over the entire life of the agent (
from the static model in (13) with two changes. First, the fraction of time spent unemployed is measured over the entire life of the agent (![]() ) instead of in a single period. Correspondingly, the relevant elasticity is
) instead of in a single period. Correspondingly, the relevant elasticity is ![]() rather than
rather than ![]() . Second, and more importantly, the gap in marginal utilities that enters the formula is the difference between the average marginal utility when employed and unemployed. This is because the average value of a marginal dollar of UI benefits depends upon the mean marginal utility across all the periods over which the agent is unemployed during his life. Similarly, the average cost of raising the UI tax depends upon the cost of losing $1 during all the periods over which the agent is employed.
. Second, and more importantly, the gap in marginal utilities that enters the formula is the difference between the average marginal utility when employed and unemployed. This is because the average value of a marginal dollar of UI benefits depends upon the mean marginal utility across all the periods over which the agent is unemployed during his life. Similarly, the average cost of raising the UI tax depends upon the cost of losing $1 during all the periods over which the agent is employed.
Sufficient Statistics Implementation. Equation (31) can be implemented using each of the three approaches described above with modifications to account for the fact that one must measure the gap in average marginal utilities. To implement the consumption-smoothing approach, one must estimate the mean consumption drop between periods when the agent is employed and unemployed, ![]() , as the gap in expected marginal utilities when utility is not state-dependent is
, as the gap in expected marginal utilities when utility is not state-dependent is ![]() . Identifying
. Identifying ![]() is conceptually analogous to identifying
is conceptually analogous to identifying ![]() in the static model. However, it may not directly correspond to the difference between consumption immediately before and after unemployment, as measured by Gruber (1997) and others, if consumption trends substantially over the lifecycle. The extent to which
in the static model. However, it may not directly correspond to the difference between consumption immediately before and after unemployment, as measured by Gruber (1997) and others, if consumption trends substantially over the lifecycle. The extent to which ![]() differs from estimates using Gruber’s approach has not yet been investigated empirically and requires further work.
differs from estimates using Gruber’s approach has not yet been investigated empirically and requires further work.
Similarly, to implement the liquidity vs. moral hazard approach, one must estimate the impacts of annuities to recover expected marginal utilities over the unemployment spell in a dynamic model. Again, this is conceptually no different than estimating the impact of lump sum cash grants, but may be harder to implement empirically. In practice, Chetty (2008) translates his estimates of the impacts of cash grants on unemployment durations into the impacts of annuities by making assumptions about discount rates. Finally, Shimer and Werning (2007) show that their reservation wage approach goes through in a dynamic model provided that utility has a CARA specification that eliminates income effects.
The general lesson from the analysis of the dynamic model is that one does not need to fully characterize all the margins through which agents may respond to shocks to calculate the marginal welfare gains of social insurance. Even in complex dynamic models, the calculation of welfare gains can be distilled to two parameters: the gap in average marginal utilities and the elasticity that enters the government’s budget constraint ![]() . There is no need to identify additional structural parameters such as the tightness of the borrowing constraint (
. There is no need to identify additional structural parameters such as the tightness of the borrowing constraint (![]() ) or the cost of job search
) or the cost of job search ![]() to calculate
to calculate ![]() . Similarly, one can show that the formula in (31) is robust to a variety of other extensions as well. For example, Kaplan (2012) shows that many young unemployed workers move back in with their parents as a method of consumption smoothing. He shows that incorporating this margin of adjustment into a structural model has significant effects on consumption fluctuations and the benefits of unemployment insurance. However, this margin is automatically accounted for in the formulas derived above. Mathematically, the option to move back home is simply another choice variable for agents and thus has no impact on (31). Intuitively, optimizing agents account for the option to move back home in all their choices. Thus, empirically observed consumption patterns, liquidity effects, and reservation wages all already incorporate this margin.
. Similarly, one can show that the formula in (31) is robust to a variety of other extensions as well. For example, Kaplan (2012) shows that many young unemployed workers move back in with their parents as a method of consumption smoothing. He shows that incorporating this margin of adjustment into a structural model has significant effects on consumption fluctuations and the benefits of unemployment insurance. However, this margin is automatically accounted for in the formulas derived above. Mathematically, the option to move back home is simply another choice variable for agents and thus has no impact on (31). Intuitively, optimizing agents account for the option to move back home in all their choices. Thus, empirically observed consumption patterns, liquidity effects, and reservation wages all already incorporate this margin.
Chetty (2006b) establishes the validity of (31) at its most general level by analyzing a dynamic model where transitions from the good state to the bad state follow an arbitrary stochastic process. Agents make an arbitrary number of choices and are subject to arbitrary constraints. The choices could include variables such as reservation wages, savings behavior, spousal labor supply, or human capital investments. Chetty shows that (31) holds in this environment as long as agents’ choices maximize private welfare.37 This is the critical assumption underlying (31). In the rest of this section, we discuss a series of important externalities that violate this assumption.
3.3.2 Externalities on Private Insurers
Public insurance is motivated by market failures of the types discussed in Section 2. However, most of the literature on optimal public insurance simply assumes that private markets do not provide any insurance against risks rather than modeling the underlying sources of the market failure. This assumption—which we made when deriving (31) above—is a convenient technical simplification but has important consequences for optimal social insurance.38 If there is a formal market for private insurance, agents’ choices will no longer maximize total private surplus (including the agent and private insurer) because the private insurance contract will distort choices. As a result, marginal changes in agents’ choices will have fiscal externalities on private insurers. For example, suppose that part of health expenditures are covered by public insurance and part by private insurance. When the government raises health insurance benefits, agents will spend more on health care, and this increased expenditure will raise costs for both the government and the private insurer. This added fiscal externality on the private insurer is a first-order effect that reduces the marginal value of insurance and is not accounted for in (31).
Before discussing how these fiscal externalities affect optimal benefits, it is worth emphasizing that only private insurance contracts that generate moral hazard alter the formulas for optimal public insurance. Private insurance that does not generate moral hazard—such as informal insurance between relatives that is well monitored—has no impact on the original formula in (31). To see this, suppose that the agent can transfer ![]() between states at a cost
between states at a cost ![]() , so that increasing consumption by
, so that increasing consumption by ![]() in the low state requires payment of a premium
in the low state requires payment of a premium ![]() in the high state. As long as the level of
in the high state. As long as the level of ![]() is chosen to maximize utility, it is simply another choice variable in Chetty’s (2006b) framework, and thus has no impact on the optimal social insurance formula. The effects of any such insurance arrangement are automatically embedded in the empirically observed consumption drop and other parameters that enter the formula.
is chosen to maximize utility, it is simply another choice variable in Chetty’s (2006b) framework, and thus has no impact on the optimal social insurance formula. The effects of any such insurance arrangement are automatically embedded in the empirically observed consumption drop and other parameters that enter the formula.
There is relatively little work analyzing optimal social insurance with private insurance that induces moral hazard. Golosov and Tsyvinski (2007) analyze optimal government policy in a model in which agents can purchase insurance from multiple private providers. They rule out market failures due to adverse selection by assuming that agents can sign contracts before private information is revealed. However, the private market still does not achieve an efficient outcome because of a “multiple dealing” externality across firms, originally discussed by Pauly (1974). Intuitively, each firm does not take into account the fact that its provision of insurance distorts the agent’s behavior, thereby affecting other insurers’ budgets and leading to overprovision of insurance in the decentralized private market equilibrium. Golosov and Tsyvinski show that the government can raise welfare by imposing a corrective tax that countervails the multiple dealing externality. They also show that the provision of public insurance partially crowds out private insurance and may reduce welfare because it leads to further overprovision of insurance. Using numerical calibrations, they demonstrate that these effects could be quite large quantitatively. While these results demonstrate that endogenous private insurance could reduce the scope for government intervention in insurance markets, the implications of their analysis for optimal benefit levels in practice are less clear. Golosov and Tsyvinski rule out many of the rationales for publicly provided insurance we discussed above, such as adverse selection, by assumption. In addition, their numerical calibrations rest on strong assumptions about the structure of the underlying model that are not directly grounded in empirical evidence.
Chetty and Saez (2010) attempt to connect the theory to the data more explicitly by deriving formulas for optimal benefits in terms of empirically estimable parameters with endogenous private insurance. They first analyze a case in which agents are homogeneous and purchase insurance from a private firm. Because there is no market failure in this model, if agents in the private sector optimize perfectly, the marginal gain from government intervention is strictly negative (Kaplow, 1991). When the private sector does not offer the optimal level of insurance—e.g., because of behavioral biases of the types discussed in Section 3.3.5 below—there is a potential role for government intervention. Chetty and Saez assume that the planner maximizes the agent’s true expected utility (which they assume is not state-dependent) and show that the marginal welfare gain from public insurance ![]() can be expressed as
can be expressed as
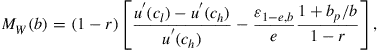 (32)
(32)
where ![]() is the private insurance benefit level in equilibrium and
is the private insurance benefit level in equilibrium and ![]() measures the extent to which private insurance is crowded out by public insurance. When
measures the extent to which private insurance is crowded out by public insurance. When ![]() , this formula reduces to (13) with state-independent utility. When
, this formula reduces to (13) with state-independent utility. When ![]() , two additional terms enter the formula. First, the marginal welfare gain is scaled down by
, two additional terms enter the formula. First, the marginal welfare gain is scaled down by ![]() because $1 more of public insurance raises total insurance (
because $1 more of public insurance raises total insurance (![]() ) by only
) by only ![]() . This effect rescales but does not change the sign of
. This effect rescales but does not change the sign of ![]() and thus does not affect the optimal public benefit level
and thus does not affect the optimal public benefit level ![]() . The second and more important effect of endogenous private insurance is captured by the added term
. The second and more important effect of endogenous private insurance is captured by the added term ![]() that amplifies the elasticity. This term reflects the fiscal externality that expanding public insurance has on private insurers. When the agent reduces
that amplifies the elasticity. This term reflects the fiscal externality that expanding public insurance has on private insurers. When the agent reduces ![]() in response to a $1 increase in
in response to a $1 increase in ![]() , it not only has a cost to the government proportional to
, it not only has a cost to the government proportional to ![]() but also a cost to the private insurer proportional to
but also a cost to the private insurer proportional to ![]() . This externality effect reduces the optimal benefit level beyond what one would have calculated based on the formula in (31) that ignored private insurance.
. This externality effect reduces the optimal benefit level beyond what one would have calculated based on the formula in (31) that ignored private insurance.
Chetty and Saez implement (32) in the context of unemployment insurance and health insurance to illustrate their approach. For unemployment—where the only form of private insurance is severance pay—Chetty and Saez estimate ![]() and
and ![]() using cross-state variation in UI benefits. Because the share of private UI benefits and crowd-out effects are small, endogenous private insurance has small effects on the optimal UI benefit level with plausible elasticities. For health, the share of private insurance is much larger (
using cross-state variation in UI benefits. Because the share of private UI benefits and crowd-out effects are small, endogenous private insurance has small effects on the optimal UI benefit level with plausible elasticities. For health, the share of private insurance is much larger (![]() ), as is the degree of crowd out. Cutler and Gruber (1996) estimate that a $1 increase in public health insurance benefits reduces private insurance benefit levels by 50 cents, implying
), as is the degree of crowd out. Cutler and Gruber (1996) estimate that a $1 increase in public health insurance benefits reduces private insurance benefit levels by 50 cents, implying ![]() . As a result, accounting for endogenous private insurance reduces the marginal welfare gains of an aggregate health insurance expansion by more than an order of magnitude according to (32).
. As a result, accounting for endogenous private insurance reduces the marginal welfare gains of an aggregate health insurance expansion by more than an order of magnitude according to (32).
The shortcoming of the formula in (32) is that it is sensitive to the sources of private market failures. For instance, Chetty and Saez extend their baseline analysis to a case where there are heterogeneous agents who have private information about their risk types. This generates adverse selection and partial private insurance provision by the market. In this setting, the formula for ![]() has additional terms relative to (32) because it has the added benefit of pooling risks across individuals of different types through a mandate. Hence, (32) is not a robust “sufficient statistic” formula because it is sensitive to the structure of the positive model. Developing formulas that are robust to the underlying sources of private market failures and can be implemented empirically is among the most important priorities for future research on social insurance.
has additional terms relative to (32) because it has the added benefit of pooling risks across individuals of different types through a mandate. Hence, (32) is not a robust “sufficient statistic” formula because it is sensitive to the structure of the positive model. Developing formulas that are robust to the underlying sources of private market failures and can be implemented empirically is among the most important priorities for future research on social insurance.
3.3.3 Externalities on Government Budgets
Fiscal externalities can also arise when the government itself provides multiple types of social insurance or levies taxes. For instance, expansions in disability insurance may reduce the probability that a worker with a high disutility of work chooses to search for a job and claim unemployment insurance. A more general source of fiscal externalities is taxation. Any reduction in labor supply induced by social insurance programs will have a negative fiscal externality on the government by reducing income tax revenue.
It is useful to divide fiscal externalities into two categories. The first are mechanical externalities that arise because the choice insured by the program (![]() ) directly affects other parts of the government’s budget, such as tax revenue. The second are indirect fiscal externalities that arise because of other behavioral responses unrelated to
) directly affects other parts of the government’s budget, such as tax revenue. The second are indirect fiscal externalities that arise because of other behavioral responses unrelated to ![]() itself. For instance, an increase in UI benefits may induce agents to save less, which could reduce revenue from capital gains taxes.
itself. For instance, an increase in UI benefits may induce agents to save less, which could reduce revenue from capital gains taxes.
To see how such fiscal externalities affect (31), let us return to the static model and add an initial period, ![]() , in which the agent chooses how much to save, which we denote by
, in which the agent chooses how much to save, which we denote by ![]() , before he faces the risk of unemployment. Let
, before he faces the risk of unemployment. Let ![]() denote the agent’s wealth at the beginning of period
denote the agent’s wealth at the beginning of period ![]() , which we take as fixed. In period 0, consumption is given by
, which we take as fixed. In period 0, consumption is given by ![]() . Let
. Let ![]() denote the tax levied on savings
denote the tax levied on savings ![]() (e.g., a capital gains tax) and
(e.g., a capital gains tax) and ![]() denote an income tax levied on employed individuals. Tax revenue
denote an income tax levied on employed individuals. Tax revenue ![]() is rebated to the agent as a lump sum in the high state, so that
is rebated to the agent as a lump sum in the high state, so that ![]() .
.
The agent chooses effort ![]() to maximize his expected utility taking the parameters of the tax system as fixed:
to maximize his expected utility taking the parameters of the tax system as fixed:
![]()
The social planner’s objective is to choose the benefit level ![]() that maximizes the agent’s expected utility:
that maximizes the agent’s expected utility:
![]()
Algebra analogous to that above yields:
![]()
This equation differs from the original formula in (13) in two ways. The first new term, ![]() , reflects the mechanical externality arising from the fact that reductions in
, reflects the mechanical externality arising from the fact that reductions in ![]() reduce income tax revenue. The magnitude of this effect is proportional to
reduce income tax revenue. The magnitude of this effect is proportional to ![]() . Accounting for this mechanical externality does not require estimating any additional parameters; one must simply take the income tax rate into account when calculating the impact of changes in
. Accounting for this mechanical externality does not require estimating any additional parameters; one must simply take the income tax rate into account when calculating the impact of changes in ![]() on the government budget. The second new term is proportional to
on the government budget. The second new term is proportional to ![]() . This term reflects the indirect fiscal externality imposed by distorting the choice of savings
. This term reflects the indirect fiscal externality imposed by distorting the choice of savings ![]() . Accounting for this indirect externality requires estimation of the additional elasticity
. Accounting for this indirect externality requires estimation of the additional elasticity ![]() , e.g., as in Engen and Gruber (2001).39
, e.g., as in Engen and Gruber (2001).39
Empirically, an important source of indirect fiscal externalities are behavioral responses that affect takeup of other social insurance programs. Autor and Duggan (2003) provide empirical evidence on the interaction between unemployment and disability insurance in the US. Using local employment shocks instrumented by industry shares, they show that more individuals exit the labor force and apply for DI when they are laid off when DI benefits are raised. As a result, unemployment rates rise less when disability insurance is expanded and, correspondingly, one would expect UI benefit payments to fall. Of course, the government also loses revenue by collecting fewer taxes from individuals who would have worked if the DI benefit level were lower.
Borghans, Gielen, and Luttmer (2010) quantify the magnitude of such fiscal externalities using administrative data from the Netherlands. They use a regression-discontinuity design to show that reducing the generosity of DI benefits increases reliance on other forms of social insurance. They estimate that every $1 saved in DI benefits via a benefit cut leads to approximately 50 cents of additional expenditure on other social insurance programs. Part of this cost is offset by increased tax revenue, but it is clear that accounting for such fiscal externalities is critical in designing optimal social insurance policy. More generally, one should ideally analyze social insurance and tax policies in a unified framework rather than optimizing each program (UI, DI, health insurance, etc.) separately.
3.3.4 Other Externalities
Agents in the private sector may have direct non-pecuniary externalities on each other independent of the fiscal channels discussed above. In Section 2.3, we discussed how such externalities—such as the spread of contagious diseases—could provide a motivation for social insurance. In this section, we discuss how such externalities affect the optimal design of social insurance policies.
While any externality would affect (31), the literature on optimal social insurance has focused on two types of externalities in particular. The first are social multiplier effects, which refer to the idea that one individual’s choices may affect the choices of those around him. For instance, an increase in disability benefits may induce some agents to stop working, which in turn may increase the value of leisure for their peers. The second are congestion externalities, which arise because of constraints that make one agent’s behavior change the returns to effort for another agent. For instance, in the context of unemployment, agents compete for a limited number of positions when jobs are rationed. In this setting, changes in UI benefits can have different effects at the macroeconomic level relative to the microeconomic level.
Theoretical work on social multipliers effects and social insurance has shown that the aggregate effects of insurance on behavior could be significantly larger than microeconomic estimates of a single individual’s behavioral responses to a change in his marginal incentives. For instance, Lindbeck, Nyberg, and Weibull (1999) present a benchmark model of how social norms about labor supply change the impacts of the welfare state on the economy. In their model, individuals’ taste for work depends not only upon their private disutility of work but also the fraction of individuals who rely on social support rather than work to make a living. They demonstrate that in this environment, small changes in policy can lead to dramatic, discontinuous changes in the size of the welfare state by shifting the equilibrium. For instance, the macroeconomic effect of an increase in disability benefits on labor supply, ![]() , could be much larger than the microeconomic elasticity
, could be much larger than the microeconomic elasticity ![]() for any single individual. Intuitively, when social insurance benefits are increased, the direct effect on each agent’s behavior is amplified by the feedback mechanism of the change in the norm. Lindbeck, Nyberg, and Weibull argue that these non-linear responses could explain why some developed countries (e.g., Scandinavia) have much larger social insurance systems than others (such as the US).
for any single individual. Intuitively, when social insurance benefits are increased, the direct effect on each agent’s behavior is amplified by the feedback mechanism of the change in the norm. Lindbeck, Nyberg, and Weibull argue that these non-linear responses could explain why some developed countries (e.g., Scandinavia) have much larger social insurance systems than others (such as the US).
How do such social multipliers affect the formula for optimal benefits in (31)? If social multipliers affect behavioral responses but do not directly affect utility, (31) holds, but ![]() must be replaced by the macro elasticity
must be replaced by the macro elasticity ![]() . This is because the aggregate response
. This is because the aggregate response ![]() is what determines how an increase in benefits affects the government budget. If the social externalities enter utility directly—e.g., if one agent not working increases the utility of leisure for others agents—then an additional term enters (31) to capture the impact of this externality on welfare, as the envelope conditions used to derive (31) do not take account of this effect.40
is what determines how an increase in benefits affects the government budget. If the social externalities enter utility directly—e.g., if one agent not working increases the utility of leisure for others agents—then an additional term enters (31) to capture the impact of this externality on welfare, as the envelope conditions used to derive (31) do not take account of this effect.40
Empirical evidence lends support to the presence of such social multipliers. For instance, Lalive (2003) presents evidence that an extension of unemployment benefits to workers over age 50 in Austria affected the labor supply of their peers below age 50, although his results rely on relatively strong identification assumptions. Clark (2003) uses data on subjective well being from a panel of households in the United Kingdom and shows that unemployed individuals report higher levels of happiness when the local unemployment rate is higher, while employed individuals report lower levels of satisfaction. Bertrand, Luttmer, and Mullainathan (2000) show that individuals are more likely to take up welfare when living in neighborhoods with a large population of residents who speak their own language, suggesting that there are network effects in welfare takeup. A limitation of this analysis is that it relies purely on cross-neighborhood comparisons and thus rests on relatively strong identification assumptions. Chetty, Friedman, and Saez (2012) present evidence of social spillovers via learning using panel data. They show that individuals are more likely to change their earnings behavior in response to the incentives created by the Earned Income Tax Credit in the US when they move to a neighborhood where other individuals respond to the program. Unfortunately, none of these studies provide estimates of how the micro impacts of policy (![]() ) changes differ from their macro impacts (
) changes differ from their macro impacts (![]() ).
).
While social multiplier effects amplify elasticities and potentially reduce the optimal level of social insurance, congestion externalities have the opposite effect. Landais, Michaillat, and Saez (2012) analyze optimal unemployment insurance in a job search model with rationing. A standard matching function maps the number of vacancies and job openings to the equilibrium level of unemployment. They assume that wages are rigid, so that when the economy is hit by a negative productivity shock, jobs are rationed in the sense that the labor market does not clear even if workers exert arbitrarily high search effort. In this environment, job seekers have a negative search externality on each other: each individual tries to outrun his peers to find a job, leading to excess search effort via a standard rat-race mechanism. Landais, Michaillat, and Saez demonstrate that this externality has two effects on (31). First, it reduces the macro elasticity of unemployment with respect to the benefit rate relative to the micro elasticity. Again, it is the macro elasticity that enters (31) for the reasons described above. Second, the negative job search externality creates an added benefit from raising UI benefits, because when each individual searches less, he has a positive spillover effect on other job seekers. Because job rationing is more severe in recessions, Landais, Michaillat, and Saez conclude that the optimal level of UI benefits should be countercyclical. They show that the micro and macro elasticities along with the other parameters in (31) are sufficient statistics to calculate the optimal level of benefits in a relatively general environment.41
Motivated by the question of whether unemployment benefits should vary over the business cycle, a recent empirical literature has investigated whether elasticities of unemployment durations with respect to benefit levels vary with labor market conditions. Most of the existing evidence uses identification strategies that are more likely to recover partial-equilibrium micro elasticities rather than general-equilibrium macro elasticities. This is because the need for a control group often makes it easier to identify partial equilibrium effects using quasi-experimental methods. Schmieder, Wachter, and Bender (2012) show that UI benefit extensions have smaller effects on unemployment exit hazards in recessions than in booms using data for Germany, implying that the moral hazard effect of UI is smaller at the micro level in recessions. Landais (2011) uses a regression kink design to show that changes in UI benefit levels have similar effects on unemployment durations in recessions and booms in the United States. Kroft and Notowidigdo (2011) present evidence that the moral hazard effects of changes in UI benefits are smaller in recessions, while the consumption-smoothing benefits are roughly constant, although their estimates are somewhat imprecise due to a lack of power.
Crépon, Duflo, Gurgand, Rathelot, and Zamora (2012) present evidence that the macro elasticity ![]() is much smaller than the micro elasticity
is much smaller than the micro elasticity ![]() in weak labor markets because of congestion effects. They run a randomized experiment that provides job placement assistance to a large group of individuals in a given labor market. They find that the individuals who did not receive assistance have significantly lower probabilities of finding a job in weak labor markets when many of their peers receive job placement assistance. This constitutes direct evidence of congestion effects in the labor market and, based on the models discussed above, suggests that the optimal UI benefit level is higher when labor markets are weak.
in weak labor markets because of congestion effects. They run a randomized experiment that provides job placement assistance to a large group of individuals in a given labor market. They find that the individuals who did not receive assistance have significantly lower probabilities of finding a job in weak labor markets when many of their peers receive job placement assistance. This constitutes direct evidence of congestion effects in the labor market and, based on the models discussed above, suggests that the optimal UI benefit level is higher when labor markets are weak.
3.3.5 Imperfect Optimization
Another important reason that agents’ choices may not maximize total private surplus is failures of optimization. As we noted in Section 2.3 above, if agents optimized perfectly, we would observe very small consumption fluctuations ![]() for temporary shocks such as unemployment. Hence, (31) would imply that the welfare gains of social insurance are small. It is tempting to simply plug in a statistic such as the observed (large) values of
for temporary shocks such as unemployment. Hence, (31) would imply that the welfare gains of social insurance are small. It is tempting to simply plug in a statistic such as the observed (large) values of ![]() and calculate the welfare gains of social insurance by applying (31) even if agents do not optimize. Unfortunately, (31) is not a valid formula for optimal benefits when agents do not optimize. This formula is valid only if agents optimize, and we know that if they optimized
and calculate the welfare gains of social insurance by applying (31) even if agents do not optimize. Unfortunately, (31) is not a valid formula for optimal benefits when agents do not optimize. This formula is valid only if agents optimize, and we know that if they optimized ![]() would not be large. Because a biased agent’s choices do not maximize his own utility, the envelope conditions exploited to derive (31) no longer hold. Hence, one must modify the formulas to allow for imperfect optimization to obtain an internally consistent understanding of optimal social insurance.42
would not be large. Because a biased agent’s choices do not maximize his own utility, the envelope conditions exploited to derive (31) no longer hold. Hence, one must modify the formulas to allow for imperfect optimization to obtain an internally consistent understanding of optimal social insurance.42
At a broad level, there are two conceptual challenges in accounting for imperfect optimization. First, conducting welfare analysis requires recovering the individuals’ true preferences, which is challenging when one cannot rely on the standard tools of revealed preference used above. One approach to solving this problem is to posit a structural model of behavioral failures, such as hyperbolic discounting (Laibson, 1997), and estimate the parameters of that model to analyze optimal policy. Another approach, which is closer in spirit to the sufficient statistic methods we have focused on here, is to derive formulas for the welfare consequences of social insurance that do not rest on a specific positive model of optimization failures (Bernheim & Rangel, 2009; Chetty, Looney, & Kroft, 2009). The chapter by Bernehim in this volume discusses welfare analysis in behavioral models in greater detail. Second, from an empirical perspective, it is unclear how to systematically distinguish mistakes from unobserved attributes such as risk aversion or private information about expected losses under an insurance contract. While we are able to identify specific examples where we can reject the null of perfect optimization, it is less clear how we can quantify the degree to which individuals are biased, which is necessary for implementing corrective policies.
There is relatively little work on social insurance in behavioral models. DellaVigna and Paserman (2005) estimate a model of job search with impatient agents and show empirically that agents who are more impatient—as measured by variables that quantify tradeoffs between immediate and delayed payoffs—search less for jobs. In their model, increasing UI benefits would have additional costs because it would further reduce effort below the optimum. Fang and Silverman (2009) estimate a similar model of time inconsistency in the context of welfare program participation and estimate the model’s structural parameters. They then use their model to show that policies that limit the number of months for which individuals are eligible for social transfers could raise welfare. These papers are examples of the first approach to welfare analysis in behavioral models described above—positing a structural model and using it to analyze the welfare consequences of policy changes.
Spinnewijn (2010) is an example of the second approach to behavioral welfare analysis. He generalizes the sufficient statistic formulas for optimal benefit levels derived above to an environment in which agents are overoptimistic about their probability of finding a job. Spinnewijn shows that it is crucial to distinguish between two types of biases in beliefs: baseline bias, which is misestimating the probability of finding a job holding search effort fixed, and control bias, which is misestimating the impact of increased search effort on the probability of finding a job. Baseline bias has no impact on the formula in (31) because it does not affect the agent’s behavioral responses to benefit changes or his utility. In contrast, control bias introduces a new term in the formula that arises from the fact that the agent does not set ![]() at its true optimum. As a result, changes in
at its true optimum. As a result, changes in ![]() have a first-order effect on utility by inducing changes in
have a first-order effect on utility by inducing changes in ![]() . For instance, an agent who is control pessimistic will undersupply effort in equilibrium, and increases in benefits will lower welfare by distorting
. For instance, an agent who is control pessimistic will undersupply effort in equilibrium, and increases in benefits will lower welfare by distorting ![]() downward even further. Spinnewijn presents empirical evidence that agents are indeed control pessimistic in practice, suggesting that calculations of optimal benefits based on the traditional formula in (31) will overstate the welfare gains of insurance.
downward even further. Spinnewijn presents empirical evidence that agents are indeed control pessimistic in practice, suggesting that calculations of optimal benefits based on the traditional formula in (31) will overstate the welfare gains of insurance.
The limitation of these papers is that each one characterizes the implications of a specific type of bias for policies. The challenge for research on social insurance in behavioral models is finding a framework that incorporates a broad set of biases yet offers empirically implementable results for optimal policy. Further work along these lines is a challenging but promising direction for future research.
3.4 Other Dimensions of Policy
While much of the literature connecting theory to data has focused on identifying the optimal level of social insurance benefits, there are many other important questions in the design of insurance programs. In this section, we briefly review three areas that have received attention in recent work: mandated savings accounts, increasing program takeup rates, and changing the path or duration of benefits.
3.4.1 Liquidity Provision and Mandated Savings Accounts
Our analysis thus far has focused exclusively on a social insurance system that transfers money from individuals in the high state to those in the low state via taxes and transfers. However, as we discussed above, there would be little need for social insurance against temporary shocks such as unemployment if individuals had access to sufficient liquidity while unemployed. Recent research has therefore analyzed policies that provide liquidity to unemployed individuals or force them to build a buffer stock via mandated savings accounts rather than transferring resources across individuals. Intuitively, if the motive for social insurance benefits is a lack of liquidity, the optimal tool to correct this problem may be to directly provide liquidity rather than to provide state-contingent transfers.
Shimer and Werning (2008) analyze optimal unemployment insurance in a model where agents can freely save and borrow using a riskless asset while unemployed. Under constant absolute risk aversion preferences, they demonstrate that the optimal policy provides free access to liquidity and a relatively low level of unemployment benefits. Chetty (2008) numerically compares the welfare gains from the provision of zero-interest loans with the welfare gains of increasing unemployment benefits in a search model calibrated to match empirical estimates of liquidity and moral hazard effects. Consistent with Shimer and Werning’s intuition, Chetty’s simulations show that the provision of loans yields large welfare gains and greatly reduces the gains from raising unemployment benefit levels. While these results highlight the potential value of liquidity provision as a policy tool, the costs of providing liquidity (e.g., due to default risk) are not modeled in these studies. Hence, these studies do not shed light on the optimal combination of loans and unemployment insurance benefits. Identifying the optimal combination of these two policies in an environment where both policies have social costs is an important open question.
An alternative approach to providing liquidity is to directly address agents’ failure to build buffer stocks by mandating savings prior to unemployment. Feldstein and Altman (2007) propose a system of UI savings accounts in which individuals are required to save a fraction of their wages in accounts designated to be used only in the event of unemployment spells. If they become unemployed, individuals would draw upon these accounts at standard benefit rates. If individuals run out of money in their savings account, they would automatically draw benefits from the state UI system, which would continue to be financed by a (smaller) payroll tax. Any remaining balance at the point of retirement would be refunded to the individual. The benefit of such a system is that individuals’ incentives to search for a job while unemployed are not distorted by the provision of UI benefits, because each extra $1 they use in UI benefits leaves them with $1 less of wealth in retirement, provided that they do not fully deplete their savings account balance. Using data from the Panel Study of Income Dynamics, Feldstein and Altman show that less than half of UI benefits would be paid to individuals who hit the corner of a zero account balance, implying that incentives could potentially be improved for many people. Orszag and Snower (2002) present calibrations showing that the impacts of such a system on unemployment durations could be quite large.
Stiglitz and Yun (2005) present a more formal argument for the optimality of UI savings accounts. They analyze a model in which individuals pay money into a pension system that is taken as exogenous. They prove that permitting individuals to draw down these pension assets in the event of adverse shocks raises welfare if individuals are borrowing constrained. The intuition is that allowing individuals to borrow against retirement savings relaxes borrowing constraints and permits better consumption smoothing at a lower efficiency cost than state-contingent transfers.
An important limitation of existing theoretical work on optimal liquidity provision and mandated savings accounts is that they all analyze models with agents who optimize perfectly. Mandated savings can only be justified if agents suffer from biases such as impatience, as the government is simply restricting the choice set available to agents. However, if agents are impatient, it is not clear that they will fully internalize the benefits of having more wealth in retirement if they draw less UI benefits when they are young. Hence, in a model that justifies mandated savings, such policies could well have efficiency costs similar to traditional social insurance systems. Countervailing this effect, there may be other biases—such as the increased salience of UI savings accounts relative to eligibility for UI benefits—that may reduce distortions when agents do not optimize perfectly. These intuitions illustrate that imperfect optimization should be a central element of future work on optimal liquidity and insurance policies.
Empirical evidence on the impacts of UI savings accounts is scarce because few governments have implemented such systems. Hartley, van Ours, and Vodopivec (2011) present suggestive evidence that a UI savings account program introduced in Chile reduced unemployment durations. Their analysis uses individuals who endogenously choose to opt into a traditional unemployment insurance program as a comparison group. Their conclusions therefore rest on stronger identification assumptions than most of the empirical studies discussed above. Further work using quasi-experimental designs to study the impacts of mandated savings accounts in needed to fully understand their impacts.
3.4.2 Imperfect Takeup
Another important dimension of social insurance policy is program participation. In the analysis above, we assumed that all individuals who are eligible for a social insurance program automatically participate in the program. In practice, takeup rates for most programs are often well below 100% (Currie, 2006). For instance, only 75% of individuals eligible for UI actually receive UI benefits when laid off. Incomplete takeup raises two questions for optimal program design. First, should the government seek to increase takeup rates, and if so what methods should be used to do so? Second, is the optimal level of benefits different when only some agents take up the benefit?
The social value of raising takeup rates—e.g., by reducing the costs of applying for a program—depends upon the value agents who choose not to participate get from the program relative to the takeup utility cost incurred by all agents. Imperfect takeup could in principle be socially desirable if the agents who choose not to takeup value the program significantly below its social cost. For example, Nichols and Zeckhauser (1982) propose a stylized model in which implementing a hurdle to claim benefits raises social welfare by removing individuals who do not value the program highly from the pool of recipients. In this model, the costs of taking up a program can serve as a screening mechanism, allowing public funds to be targeted at the subgroups who are in greatest need of assistance (e.g., those with the least liquidity).43 However, the screening induced by hurdles to take up need not necessarily operate in this beneficial manner. For instance, suppose individuals who do not participate are uninformed about the program’s existence or make optimization errors. In this environment, policies that increase takeup rates could raise welfare, because they may bring the individuals who would value social support most highly into the system. The nature of the marginal agents who do not take-up social insurance is ultimately an empirical question, and the answer could vary across programs and environments.
Empirical evidence on the determinants of takeup shows that imperfect takeup is driven by a mix of factors. Anderson and Meyer (1993) present evidence that individuals are more likely to take up UI benefits when net benefit levels are higher. Black, Smith, Berger, and Noel (2003) present experimental evidence that individuals are more likely to drop out of the UI system when they receive a mailing announcing that they must attend a training program in order to remain eligible for benefits. These results suggest that takeup is based on a rational cost-benefit conclusion and imply that the individuals who do not take up may be those who value the benefit the least. In contrast, Ebenstein and Stange (2010) show that the shift from in-person to telephone registration for UI benefits, which significantly reduced the time costs of takeup, had no impact on UI takeup rates. Bhargava and Manoli (2011) present experimental evidence showing that simplifying tax forms increases takeup of the Earned Income Tax Credit. These results raise the possibility that some individuals who do not take up may actually benefit significantly from the program despite getting screened out under the current program design. What remains unclear is the average valuation of benefits for those who do not take up, which is a key parameter for determining whether resources should be invested in increasing takeup rates. Developing methods to estimate this parameter and calculate the marginal welfare gains from increasing takeup is a promising area for future research.
How does incomplete takeup affect the optimal design of other parameters of the social insurance system? Kroft (2008) analyzes the optimal UI benefit level in a model with imperfect takeup. He generalizes the sufficient statistic formulas derived above to a model with heterogeneous takeup costs and rational agents. The formula in (31) changes in two ways in this setting. First, ![]() must be computed for the subgroup of individuals who takes up benefits rather than all individuals in the low state. Second, the elasticity parameter that is relevant is the sum of the behavioral elasticity
must be computed for the subgroup of individuals who takes up benefits rather than all individuals in the low state. Second, the elasticity parameter that is relevant is the sum of the behavioral elasticity ![]() and the takeup elasticity, as increases in benefit rates raise expenditures both through traditional margins and by raising the number of individuals claiming benefits. In general, accounting for endogenous takeup lowers the optimal benefit rate relative to computations that apply (31) to the subsample of individuals who take up benefits.
and the takeup elasticity, as increases in benefit rates raise expenditures both through traditional margins and by raising the number of individuals claiming benefits. In general, accounting for endogenous takeup lowers the optimal benefit rate relative to computations that apply (31) to the subsample of individuals who take up benefits.
3.4.3 Path of Benefits
Most shocks have a variable time span. For instance, spells of work injury, disability, and unemployment all have uncertain durations. Although many health shocks are one-time events, there are some chronic conditions that generate expenditures over longer periods. In such settings, the social planner can choose not just the level of benefits but also its path. At an abstract level, one can choose a different benefit level ![]() in each period
in each period ![]() during which the individual is in the low state. In practice, many social insurance systems have one- or two-tiered benefit systems, in which benefits are provided at a constant level for a finite duration and then reduced or completely eliminated (e.g., the termination of UI benefits at 6 months in the US). Our preceding analysis has focused on identifying the optimal level of
during which the individual is in the low state. In practice, many social insurance systems have one- or two-tiered benefit systems, in which benefits are provided at a constant level for a finite duration and then reduced or completely eliminated (e.g., the termination of UI benefits at 6 months in the US). Our preceding analysis has focused on identifying the optimal level of ![]() under the assumption that
under the assumption that ![]() for all
for all ![]() . In this section, we discuss the small but growing body of work that has sought to characterize the optimal path of benefits.
. In this section, we discuss the small but growing body of work that has sought to characterize the optimal path of benefits.
The fundamental tradeoff in setting the path of benefits, originally described by Shavell and Weiss (1979), is again between consumption smoothing and moral hazard. Increasing benefits over time is desirable from a consumption smoothing perspective, as it provides the largest benefits to the agents who need it most. Intuitively, those who suffered from long unemployment spells are likely to have depleted their assets and have a very high marginal utility of consumption. But increasing benefits over time is costly from an efficiency perspective, as it creates an incentive to “hold out” for higher benefits by prolonging one’s duration in the low state. Unfortunately, deriving formulas that map the relative magnitude of these two effects to quantitative predictions about the optimal path of ![]() is challenging. The literature on the optimal path of benefits has thus been less successful in connecting theory to data because of the complexity of dynamic models and the high-dimensional nature of the problem. We therefore briefly describe some of the main theoretical and empirical results that bear on this problem, highlighting the scope for further work deriving sufficient statistic formulas in this area.
is challenging. The literature on the optimal path of benefits has thus been less successful in connecting theory to data because of the complexity of dynamic models and the high-dimensional nature of the problem. We therefore briefly describe some of the main theoretical and empirical results that bear on this problem, highlighting the scope for further work deriving sufficient statistic formulas in this area.
Shavell and Weiss (1979) characterize the optimal path of a benefits in a discrete-time model in which agents make consumption and search effort choices in each period. When agents cannot save or borrow, the optimal path of benefits is declining because an upward sloping benefit path does not provide a smoother consumption path but creates moral hazard. When agents can save or borrow, Shavell and Weiss show that the optimal path could be upward or downward sloping depending upon the structural parameters of the model. Hopenhayn and Nicolini (1997) extend Shavell and Weiss’ analysis to allow for a wage tax after reemployment, but focus on the case with no saving or borrowing. They show that the optimal path of benefits is again declining in this environment, but that there is a significant welfare gain from levying a substantial tax upon reemployment.
Werning (2002) generalizes Hopenhayn and Nicolini’s analysis to a case with hidden savings, i.e., a more realistic environment where the planner can set benefit levels but cannot directly control consumption. Werning (2002) shows that when agents can save or borrow, optimal benefit levels may increase over time and are much lower in levels than those predicted by Hopenhayn and Nicolini’s analysis.44 Shavell and Weiss, Hopenhayn and Nicolini, and Werning all study models where agents have fixed wages and only choose search effort. Shimer and Werning (2008) analyze a standard reservation-wage model in which agents draw stochastic wage offers. They prove that the optimal path of benefits is constant (![]() ) in a setting without liquidity constraints and CARA utility. Intuitively, under these assumptions, the agent’s problem while unemployed is stationary because his attitudes toward risk and incentives to find a job do not change as he depletes his assets. As a result, the moral hazard costs and consumption-smoothing benefits of a steeper benefit profile perfectly cancel out, yielding a constant optimal benefit path. Shimer and Werning argue that in cases where agents do not have access to perfect capital markets, the optimal government policy is to provide loans and constant benefits.
) in a setting without liquidity constraints and CARA utility. Intuitively, under these assumptions, the agent’s problem while unemployed is stationary because his attitudes toward risk and incentives to find a job do not change as he depletes his assets. As a result, the moral hazard costs and consumption-smoothing benefits of a steeper benefit profile perfectly cancel out, yielding a constant optimal benefit path. Shimer and Werning argue that in cases where agents do not have access to perfect capital markets, the optimal government policy is to provide loans and constant benefits.
While this result is a useful benchmark, the optimal path of benefits could differ substantially under alternative assumptions about the structure of the positive model. In practice, agents are highly liquidity constrained while unemployed and governments tend not to offer loans to such agents, perhaps because of moral hazard problems in debt repayment. Moreover, there could be significant non-stationarities in responses to incentives over a spell, due both to selection in an environment with heterogeneity and changes in the cost of effort. For instance, individuals who remain unemployed after 6 months could be relatively elastic types but may also have a hard time controlling the arrival rate of offers, driving ![]() down over the course of an unemployment spell. Such forces eliminate the stationarity that drives Shimer and Werning’s constant benefit result, as discussed in Shimer and Werning (2006). The quantitative magnitude of such effects is ultimately an empirical question whose answer could vary across environments and social insurance programs.
down over the course of an unemployment spell. Such forces eliminate the stationarity that drives Shimer and Werning’s constant benefit result, as discussed in Shimer and Werning (2006). The quantitative magnitude of such effects is ultimately an empirical question whose answer could vary across environments and social insurance programs.
The empirical literature, which also focuses primarily on unemployment insurance, shows that the path of benefits has significant effects on agents’ behavior in a manner that is consistent with forward-looking decisions. Card and Levine (2000) analyze the impacts of a 13 week extension in UI benefits in New Jersey on unemployment durations. Their estimates imply that this extension would have raised durations on the UI system by 1 week had individuals been eligible for the extension from the start of their spells. Card et al. (2007b) analyze a discontinuity in the Austrian UI benefit system based on work history that makes some individuals eligible for 20 weeks of benefits and others eligible for 30 weeks of benefits. Individuals eligible for 30 weeks of benefits have significantly lower job finding hazards even in the first five weeks of their unemployment spell, suggesting that the “holding out” moral hazard effect identified by Shavell and Weiss is indeed operative in the data. Lalive (2008) finds similar impacts of an age-based discontinuity in the Austrian unemployment system that varies eligibility much more dramatically, from 30 weeks to 209 weeks.
There is no evidence to date on the consumption smoothing of extending benefits for a longer period due to the lack of high-frequency data on consumption. One approach to this problem may be to estimate liquidity effects at different points of a spell using variation in cash-on-hand from tax credits or other sources, as in LaLumia (2011). Investigating the path of asset decumulation and borrowing over the course of shocks would also shed light on the dynamic benefits of social insurance.
One approach for connecting the empirical evidence to theoretical models that make weaker assumptions may be to limit the set of benefit schedules that one considers. For instance, one could analyze two-parameter systems in which benefits are paid at a constant rate ![]() and then terminated at some date
and then terminated at some date ![]() or systems in which benefits follow a linear path
or systems in which benefits follow a linear path ![]() . It may be possible to derive analytic formulas in terms of the elasticities estimated in the empirical literature for the optimal two-parameter system. Given that governments are unlikely to implement highly variable benefits over time, such simplifications of the problem might not be very restrictive from a practical perspective.
. It may be possible to derive analytic formulas in terms of the elasticities estimated in the empirical literature for the optimal two-parameter system. Given that governments are unlikely to implement highly variable benefits over time, such simplifications of the problem might not be very restrictive from a practical perspective.
4 Challenges for Future Work
Our review of the literature indicates that modern methods of connecting theory to data have proven to be quite fruitful, but much remains to be learned before one can draw strong conclusions about social insurance policy from this work. We conclude by summarizing some of the main outstanding challenges and open areas for future research.
First, there is a lack of empirical evidence on key parameters for many programs. Table 1 summarizes the current state of the literature for five major social insurance programs. For each program, we mark areas where we are aware of existing work on five topics: testing for selection (e.g., using positive correlation or cost curve tests), quantifying its welfare costs, estimating the benefits of social insurance (e.g., consumption smoothing or liquidity effects), estimating moral hazard costs (e.g., by studying behavioral responses to the program), and calculating optimal benefit levels (e.g., using sufficient statistic formulas). As discussed earlier, most empirical work to date on selection in insurance markets, and particularly its welfare costs, has concentrated on health insurance, with a few papers on annuities; noticeably missing is work on selection in unemployment insurance, disability insurance, or worker’s compensation.45 Research on government-provided insurance has focused primarily on measuring moral hazard costs rather than benefits. Unemployment insurance is one of the few programs in which both the benefits and costs of insurance have been studied extensively, with a corresponding well-developed literature on optimal policy.
Table 1
Social Insurance: A Summary of Existing Applied Work
Notes: This table lists areas where we are aware of empirical work on the topic listed in each column for five major social insurance programs. Selected examples of this work would include the following. Column 1: Cutler and Reber (1998) on Medicare/Medicaid (more accurately: private health insurance markets). Column 2: Einav et al. (2010a) on health insurance markets. Column 3: Card et al. (2009) on Medicare and Finkelstein et al. (2012) on Medicaid; Gruber (1997) and Chetty (2008) on unemployment insurance, and Bronchetti (2012) on workers compensation. Column 4: Card et al. (2009) on Medicare and Finkelstein et al. (2012) on Medicaid; Gruber (2001) and Maestas, Mullen, and Strand (2012) on disability insurance, Meyer (1990) and Card et al. (2007a, 2007b) on unemployment insurance, and Meyer et al. (1995) on workers’ compensation. Column 5: Gruber (1997) and Chetty (2008) on unemployment insurance and Bronchetti (2012) on workers compensation.
A natural and quite valuable direction for further work is to fill in the empty boxes in Table 1 by applying the approaches surveyed here to these other important areas of social insurance. One particularly important program that has received relatively little attention in terms of measuring benefits and welfare consequences is disability insurance. Social insurance programs for health care—Medicaid and Medicare—are another area ripe for welfare analysis of optimal benefit levels. These programs have been the subject of a rich empirical literature examining their moral hazard impacts on health spending, and their benefits in terms of health and (to a more limited extent) consumption smoothing (see for Medicare e.g., Card, Dobkin, & Maestas (2008, 2009), Finkelstein (2007), or Finkelstein & McKnight (2008) or for Medicaid e.g., Currie & Gruber (1996a, 1996b), Finkelstein et al. (2011) or Gross & Notowidigdo (2011)). Yet there have been virtually no attempts to translate these policy estimates into statements about welfare or optimal policy (Finkelstein & McKnight (2008) is a notable, although highly stylized, exception). Another area in which modern tools connecting theory to data have not yet been applied is the analysis of social security programs. While there is a wealth of evidence of the reduced-form impacts of social security programs and a rich theoretical literature on optimal social security design, there is little work deriving robust formulas for optimal social security design in terms of empirically estimable parameters.
Second, the majority of the research we reviewed has focused on models with perfectly optimizing agents. However, as we argued above, it is difficult to rationalize some social insurance programs such as unemployment insurance in an environment with forward-looking agents because intertemporal consumption smoothing (“self insurance”) is quantitatively a very good substitute for insurance against temporary shocks. An important challenge for future work is to understand the consequences of behavioral economics for optimal insurance. For instance, if large liquidity and consumption-smoothing effects of unemployment insurance are driven by the fact that impatient workers postpone job search until they run out of cash, the gains from insurance may be much smaller than existing calculations suggest. Similarly, the optimal tools to correct behavioral biases may be very different from traditional insurance programs, which make state-contingent income transfers.
Third, most methods of connecting theory to data make restrictive assumptions that do not permit a full spectrum of general equilibrium responses. Results on measuring the welfare cost of selection have usually treated the offered contracts as fixed, and focused primarily on the distortions in prices created by selection. Likewise, formulas for optimal social insurance based on reduced-form elasticities all require that wage rates and other prices are unaffected by government policies. In practice, large-scale social insurance policies are likely to induce substantial supply-side responses, making it crucial to develop methods to account for such general equilibrium effects.
Fourth, and relatedly, the literature on optimal social insurance design we have reviewed has tended to focus on relatively specific design questions within the structure of existing programs, such as the optimal level of benefits given the existing time path of benefits or the optimal financing of benefits. It is generally silent on more global optimal design questions, such as those that would alter several features of a program simultaneously. One relatively understudied design question is the choice of instrument used for government intervention. Governments can intervene in private insurance markets in at least three ways: direct public provision (e.g., Medicare, Social Security, and Unemployment Insurance), mandates on firms to provide insurance (e.g., Worker’s Compensation), and direct intervention in or regulation of private insurance markets (e.g., tax subsidies for employer provided health insurance or regulation of the allowable contracts and prices in the individual health insurance markets). The optimal choice of these instruments has not been well explored.46
Fifth, the literature on motivations for social insurance and the optimal policy response are not yet well integrated. Existing empirical work on adverse selection analyzes selection and its consequences given the existing public policies, such as tax subsidies to employer provided health insurance or publicly provided annuities through Social Security. This raises the question of whether selection would exist—and what its welfare consequences would be—in the absence of these public programs or under very different public programs than we currently have. Understanding, both theoretically and empirically, how public insurance programs or policies affect the existence and nature of adverse selection in the residual private markets is therefore an important area for further work. Similarly, in the optimal policy literature, fiscal externalities on private insurers and other parts of the government budget such as tax revenue could significantly reduce the gains from social insurance. Characterizing optimal public insurance in models that incorporate endogenous private market insurance failures is therefore essential to obtain a more precise understanding of the welfare consequences of social insurance.
Finally, a general conceptual challenge for the approaches we have discussed in this paper is that they are less informative about fundamental policy reforms, such as implementing universal health insurance, than local changes, such as changing copayment rates by 10%. This is because the reduced-form empirical estimates that the literature uses to make quantitative welfare predictions are identified using local variation around the currently observed environment. This makes it difficult to extrapolate out-of-sample to impacts of policies that have not been observed. The questions discussed above of how private markets would function in the absence of public insurance are one example of this problem. More generally, informing policy makers about significant reforms to social insurance programs will require a more global understanding of how these policies affect the economy. These issues are a fundamental challenge not just for the literature on social insurance but for empirical work more generally.
Acknowledgments
We are grateful to Alan Auerbach, Liran Einav, Hilary Hoynes, Emmanuel Saez, and participants at the Handbook of Public Economics conference held at UC-Berkeley for helpful comments. Shelby Lin, Heather Sarsons, and Michael Stepner provided excellent research assistance. We gratefully acknowledge support from the NIA R01 AG032449 (Finkelstein) and the National Science Foundation SES 0645396 (Chetty).
References
1. Abaluck J, Gruber J. Choice inconsistencies among the elderly: Evidence from plan choice in the medicare Part D program. American Economic Review. 2011;101(4):1180–1210.
2. Abbring JH, Chiappori P-A, Pinquet J. Moral hazard and dynamic insurance data. Journal of the European Economic Association. 2003a;1(4):767–820.
3. Abbring JH, Heckman JJ, Chiappori P-A, Pinquet J. Adverse selection and moral hazard in insurance: Can dynamic data help to distinguish? Journal of the European Economic Association. 2003b;1(2–3):512–521.
4. Abel AB. Capital accumulation and uncertain lifetimes with adverse selection. Econometrica. 1986;54(5):1079–1097.
5. Acemoglu D, Shimer R. Efficient unemployment insurance. Journal of Political Economy. 1999;107(5):893–928.
6. Adams W, Einav L, Levin J. Liquidity constraints and imperfect information in subprime lending. American Economic Review. 2009;99(1):49–84.
7. Akerlof GA. The market for lemons: Quality uncertainty and the market mechanism. Quarterly Journal of Economics. 1970;84(3):488–500.
8. Anderson PM, Meyer BD. Unemployment insurance in the United States: Layoff incentives and cross subsidies. Journal of Labor Economics. 1993;11(1):70–95.
9. Auerbach AJ. The theory of excess burden and optimal taxation. In: Amsterdam, North Holland: Elsevier; 1985;61–127. Auerbach AJ, Feldstein M, eds. Handbook of public economics. Vol. 1.
10. Autor DH, Duggan MG. The rise in the disability rolls and the decline in unemployment. Quarterly Journal of Economics. 2003;118(1):157–205.
11. Baicker K, Goldin C, Katz LF. A distinctive system: Origins and impact of US unemployment compensation. In: Bordo MD, Goldin C, White EN, eds. The defining moment: The great depression and the American economy in the twentieth century. Chicago: University of Chicago Press; 1998;227–263.
12. Baily MN. Some aspects of optimal unemployment insurance. Journal of Public Economics. 1978;10(3):379–402.
13. Baird S, Hicks JH, Kremer M, Miguel E. Worms at work: Long-run impacts of child health gains. Mimeo 2011; In: http://elsa.berkeley.edu/simemiguel/pdfs/miguelwormsatwork.pdf; 2011.
14. Bank of Sweden (2001). Press release: The 2001 Sveriges Riksbank (Bank of Sweden) prize in economic sciences in memory of Alfred Nobel, advanced information. http://www.nobelprize.org/nobelprizes/economics/laureates/2001/advanced-economicsciences2001.pdf.
15. Barseghyan L, Prince J, Teitelbaum JC. Are risk preferences stable across contexts? Evidence from insurance data. American Economic Review. 2011;101(2):591–631.
16. Barseghyan, L. Molinari, F., O’Donoghue, T., & Teitelbaum, J.C. (2012). The nature of risk preferences: Evidence from insurance choices. SSRN working paper, No 1646520.
17. Barsky RB, Juster FT, Kimball MS, Shapiro MD. Preference parameters and behavioral heterogeneity: An experimental approach in the health and retirement study. Quarterly Journal of Economics. 1997;112(2):537–579.
18. Bernheim BD, Rangel A. Beyond revealed preference: Choice-theoretic foundations for behavioral welfare economics. Quarterly Journal of Economics. 2009;124(1):51–104.
19. Bertrand M, Luttmer EFP, Mullainathan S. Network effects and welfare cultures. Quarterly Journal of Economics. 2000;115(3):1019–1055.
20. Bhargava, S., & Manoli, D. (2011). Why are benefits left on the table? Assessing the role of information, complexity, and stigma on take-up with an IRS field experiment. Working paper.
21. Black DA, Smith JA, Berger MC, Noel BJ. Is the threat of reemployment services more effective than the services themselves? Evidence from random assignment in the UI system. American Economic Review. 2003;93(4):1313–1327.
22. Blanchard OJ, Tirole J. The joint design of unemployment insurance and employment protection: A first pass. Journal of the European Economic Association. 2008;6(1):45–77.
23. Blundell R, Pistaferri L, Preston I. Consumption Inequality and Partial Insurance. American Economic Review. 2008;98(5):1887–1921.
24. Borghans, L., Gielen, A.C., & Luttmer, E.F.P. (2010). Social support shopping: Evidence from a regression discontinuity in disability insurance reform. IZA Discussion Paper, No. 5412, Institute for the Study of Labor (IZA).
25. Bound J, Cullen JB, Nichols A, Schmidt L. The welfare implications of increasing disability insurance benefit generosity. Journal of Public Economics. 2004;88(12):2487–2514.
26. Bronchetti ET. Workers’ compensation and consumption smoothing. Journal of Public Economics. 2012;96(5):495–508.
27. Brown JR, Finkelstein A. Why is the market for long-term care insurance so small? Journal of Public Economics. 2007;91(10):1967–1991.
28. Brown JR, Finkelstein A. The interaction of public and private insurance: Medicaid and the long-term care insurance market. American Economic Review. 2008;98(3):1083–1102.
29. Brown JR, Finkelstein A. Insuring long-term care in the United States. Journal of Economic Perspectives. 2011;25(4):119–142.
30. Brown JR, Kroszner RS, Jenn BH. Federal terrorism risk insurance. National Tax Journal. 2002;55(3):647–657.
31. Brown, J., Duggan, M., Kuziemko, I., & Woolston, W. (2011). How does risk selection respond to risk adjustment? Evidence from the medicare advantage program. NBER working paper, No. 16977, National Bureau of Economic Research.
32. Browning M, Crossley TF. Unemployment insurance benefit levels and consumption changes. Journal of Public Economics. 2001;80(1):1–23.
33. Buchanan J. The samaritan’s dilemma. In: Phelps E, ed. Altruism, morality and economic theory. New York: Russell Sage; 1975;71–85.
34. Buchmueller T, DiNardo J. Did community rating induce an adverse selection death spiral? Evidence from New York, Pennsylvania, and Connecticut. American Economic Review. 2002;92(1):280–294.
35. Bundorf MK, Simon KI. The effects of rate regulation on demand for supplemental health insurance. American Economic Review. 2006;96(2):67–71.
36. Bundorf MK, Levin J, Mahoney N. Pricing and welfare in health plan choice. American Economic Review. 2012;102(7):3214–3248.
37. Card D, Levine PB. Extended benefits and the duration of UI spells: Evidence from the New Jersey extended benefit program. Journal of Public Economics. 2000;78(1–2):107–138.
38. Card D, Chetty R, Weber A. The spike at benefit exhaustion: Leaving the unemployment system or starting a new job? American Economic Review. 2007a;97(2):113–118.
39. Card D, Chetty R, Weber A. Cash-on-hand and competing models of intertemporal behavior: New evidence from the labor market. Quarterly Journal of Economics. 2007b;122(4):1511–1560.
40. Card D, Dobkin C, Maestas N. The impact of nearly universal insurance coverage on health care utilization: Evidence from medicare. American Economic Review. 2008;98(5):2242–2258.
41. Card D, Dobkin C, Maestas N. Does medicare save lives? Quarterly Journal of Economics. 2009;124(2):597–636.
42. Cardon JH, Hendel I. Asymmetric information in health insurance: Evidence from the national medical expenditure survey. RAND Journal of Economics. 2001;32(3):408–427.
43. Carlin C, Town R. Adverse selection: The dog that didn’t bite. Mimeo: University of Minnesota; 2010.
44. Carroll CD. Buffer-stock saving and the life cycle/permanent income hypothesis. Quarterly Journal of Economics. 1997;112(1):1–55.
45. Centeno M, Novo A. Reemployment wages and UI liquidity effect: A regression discontinuity approach. Portuguese Economic Journal. 2009;8(1):45–52.
46. Chetty R. A new method of estimating risk aversion. American Economic Review. 2006a;96(5):1821–1834.
47. Chetty R. A general formula for the optimal level of social insurance. Journal of Public Economics. 2006b;90(10–11):1879–1901.
48. Chetty R. Moral hazard versus liquidity and optimal unemployment insurance. Journal of Political Economy. 2008;116(2):173–234.
49. Chetty R. Sufficient statistics for welfare analysis: A bridge between structural and reduced-form methods. Annual Review of Economics. 2009;1(1):451–488.
50. Chetty R, Looney A. Consumption smoothing and the welfare consequences of social insurance in developing economies. Journal of Public Economics. 2006;90(12):2351–2356.
51. Chetty R, Saez E. Optimal taxation and social insurance with endogenous private insurance. American Economic Journal: Economic Policy. 2010;2(2):85–114.
52. Chetty R, Szeidl A. Consumption commitments and risk preferences. Quarterly Journal of Economics. 2007;122(2):831–877.
53. Chetty R, Looney A, Kroft K. Salience and taxation: Theory and evidence. American Economic Review. 2009;99(4):1145–1177.
54. Chetty R, Friedman JN, Olsen T, Pistaferri L. Adjustment costs, firm responses, and micro vs macro labor supply elasticities: Evidence from Danish tax records. The Quarterly Journal of Economics. 2011;126(2):749–804.
55. Chetty, R., Friedman, J. N., & Saez, E. (2012). Using differences in knowledge across neighborhoods to uncover the impacts of the EITC on earnings. NBER working paper, No. 18232, National Bureau of Economic Research. Forthcoming, American Economic Review.
56. Chiappori P-A, Salanié B. Testing for asymmetric information in insurance markets. Journal of Political Economy. 2000;108(1):56–78.
57. Chiappori P-A, Jullien B, Salanié B, Salanié F. Asymmetric information in insurance: General testable implications. RAND Journal of Economics. 2006;37(4):783–798.
58. Clark AE. Unemployment as a social norm: Psychological evidence from panel data. Journal of Labor Economics. 2003;21(2):289–322.
59. Coate S. Altruism, the samaritan’s dilemma, and government transfer policy. American Economic Review. 1995;85(1):46–57.
60. Cochrane JH. A simple test of consumption insurance. Journal of Political Economy. 1991;99(5):957–976.
61. Cohen A, Einav L. Estimating risk preferences from deductible choice. American Economic Review. 2007;97(3):745–788.
62. Cohen A, Siegelman P. Testing for adverse selection in insurance markets. Journal of Risk and Insurance. 2010;77(1):39–84.
63. Crépon, B., Duflo, E., Gurgand, M., Rathelot, R., & Zamora, P. (2012). Do labor market policies have displacement effects? Evidence from a clustered randomized experiment. CEPR Discussion Papers, No. 9251 [C.E.P.R. Discussion Papers].
64. Crocker KJ, Snow A. The efficiency of competitive equilibria in insurance markets with asymmetric information. Journal of Public Economics. 1985;26(2):207–219.
65. Cullen JB, Gruber J. Does unemployment insurance crowd out spousal labor supply? Journal of Labor Economics. 2000;18(3):546–572.
66. Currie J. The take-up of social benefits. In: Auerbach A, Card D, Quigley J, eds. Poverty, the distribution of income, and public policy. New York: Russell Sage; 2006;80–148.
67. Currie J, Gruber J. Health insurance eligibility, utilization of medical care, and child health. Quarterly Journal of Economics. 1996a;111(2):431–466.
68. Currie J, Gruber J. Saving babies: The efficacy and cost of recent changes in the medicaid eligibility of pregnant women. Journal of Political Economy. 1996b;104(6):1263–1296.
69. Cutler DM. Health care and the public sector. In: 1st ed. Amsterdam, North Holland: Elsevier; 2002;2143–2243. Auerbach AJ, Feldstein M, eds. Handbook of public economics. Vol. 4.
70. Cutler DM, Gruber J. Does public insurance crowd out private insurance? Quarterly Journal of Economics. 1996;111(2):391–430.
71. Cutler DM, Reber SJ. Paying for health insurance: The trade-off between competition and adverse selection. Quarterly Journal of Economics. 1998;113(2):433–466.
72. Cutler DM, Zeckhauser RJ. The anatomy of health insurance. In: 1st ed. Amsterdam, North Holland: Elsevier; 2000;563–643. Culyer AJ, Newhouse JP, eds. Handbook of public economics. Vol. 1.
73. Cutler DM, Finkelstein A, McGarry K. Preference heterogeneity and insurance markets: Explaining a puzzle of insurance. American Economic Review. 2008;98(2):157–162.
74. Davidoff T, Brown JR, Diamond PA. Annuities and individual welfare. American Economic Review. 2005;95(5):1573–1590.
75. Deaton A. Saving and Liquidity Constraints. Econometrica. 1991;59(5):1221–1248.
76. DellaVigna S, Paserman MD. Job search and impatience. Journal of Labor Economics. 2005;23(3):527–588.
77. de Meza D, Webb DC. Advantageous selection in insurance markets. RAND Journal of Economics. 2001;32(2):249–262.
78. Devine TJ, Kiefer NM. Empirical labor economics: The search approach. New York: Oxford University Press; 1991.
79. Diamond PA. A framework for social security analysis. Journal of Public Economics. 1977;8(3):275–298.
80. Ebenstein A, Stange K. Does inconvenience explain low take-up? Evidence from unemployment insurance. Journal of Policy Analysis and Management. 2010;29(1):111–136.
81. Eckstein Z, Eichenbaum M, Peled D. Uncertain lifetimes and the welfare enhancing properties of annuity markets and social security. Journal of Public Economics. 1985;26(3):303–326.
82. Einav L, Finkelstein A. Selection in insurance markets: Theory and empirics in pictures. Journal of Economic Perspectives. 2011;25(1):115–138.
83. Einav L, Finkelstein A, Cullen MR. Estimating welfare in insurance markets using variation in prices. Quarterly Journal of Economics. 2010a;125(3):877–921.
84. Einav L, Finkelstein A, Levin J. Beyond testing: Empirical models of insurance markets. Annual Review of Economics. 2010b;2(1):311–336.
85. Einav L, Finkelstein A, Schrimpf P. Optimal mandates and the welfare cost of asymmetric information: Evidence from the UK annuity market. Econometrica. 2010c;78(3):1031–1092.
86. Einav, L., Finkelstein, A., Ryan, S. P., Schrimpf, P., & Cullen, M. R. (2011). Selection on moral hazard in health insurance. NBER working paper, No. 16969, National Bureau of Economic Research.
87. Einav, L., Finkelstein, A., Pascu, I., & Cullen, M. (forthcoming). How general are risk preferences? Choices under uncertainty in different domains. American Economic Review.
88. Engen EM, Gruber J. Unemployment insurance and precautionary saving. Journal of Monetary Economics. 2001;47(3):545–579.
89. Fang H, Silverman D. Time-inconsistency and welfare program participation: Evidence from The NLSY. International Economic Review. 2009;50(4):1043–1077.
90. Fang H, Keane MP, Silverman D. Sources of advantageous selection: Evidence from the medigap insurance market. Journal of Political Economy. 2008;116(2):303–350.
91. Feldstein M. The effect of unemployment insurance on temporary layoff unemployment. American Economic Review. 1978;68(5):834–846.
92. Feldstein, M., & Altman, D. (2007). Unemployment insurance savings accounts. In Tax Policy and the Economy (Vol. 21 of NBER Chapters). (pp. 35–64). National Bureau of Economic Research.
93. Feldstein M, Liebman JB. Social security. In: 1st ed. Amsterdam, North Holland: Elsevier; 2002;2245–2324. Auerbach AJ, Feldstein M, eds. Handbook of public economics. Vol. 4.
94. Feldstein M, Poterba J. Unemployment insurance and reservation wages. Journal of Public Economics. 1984;23(1–2):141–167.
95. Finkelstein A. The interaction of partial public insurance programs and residual private insurance markets: Evidence from the US medicare program. Journal of Health Economics. 2004;23(1):1–24.
96. Finkelstein A. The aggregate effects of health insurance: Evidence from the introduction of medicare. Quarterly Journal of Economics. 2007;122(1):1–37.
97. Finkelstein A, McGarry K. Multiple dimensions of private information: Evidence from the long-term care insurance market. American Economic Review. 2006;96(4):938–958.
98. Finkelstein A, McKnight R. What did medicare do? The initial impact of medicare on mortality and out of pocket medical spending. Journal of Public Economics. 2008;92(7):1644–1668.
99. Finkelstein A, Poterba J. Selection effects in the United Kingdom individual annuities market. Economic Journal. 2002;112(476):28–50.
100. Finkelstein A, Poterba J. Adverse selection in insurance markets: Policyholder evidence from the UK annuity market. Journal of Political Economy. 2004;112(1):183–208.
101. Finkelstein, A., & Poterba, J. (2006). Testing for adverse selection with unused observables. NBER working paper, No. 12112. National Bureau of Economic Research.
102. Finkelstein, A., Luttmer, E. F. P., & Notowidigdo, M. J. (2008). What good is wealth without health? The effect of health on the marginal utility of consumption. NBER working paper, No. 14089, National Bureau of Economic Research.
103. Finkelstein A, Luttmer EFP, Notowidigdo MJ. Approaches to estimating the health state dependence of the utility function. American Economic Review. 2009a;99(2):116–121.
104. Finkelstein A, Poterba J, Rothschild C. Redistribution by insurance market regulation: Analyzing a ban on gender-based retirement annuities. Journal of Financial Economics. 2009b;91(1):38–58.
105. Finkelstein, A., Taubman, S., Wright, B., Bernstein, M., Gruber, J., Newhouse, J. P., Allen, H., Baicker, K., & Group, T. O. H. S. (2011). The oregon health insurance experiment: Evidence from the first year. NBER working paper, No. 17190. National Bureau of Economic Research, Inc.
106. Fishback PV, Kantor SE. The adoption of workers’ compensation in the United States, 1900–1930. Journal of Law and Economics. 1998;41(2):305–341.
107. Friedman BM, Warshawsky MJ. The cost of annuities: Implications for saving behavior and bequests. Quarterly Journal of Economics. 1990;105(1):135–154.
108. Froot KA. The market for catastrophe risk: a clinical examination. Journal of Financial Economics. 2001;60(2–3):529–571.
109. Gertler P, Gruber J. Insuring consumption against illness. American Economic Review. 2002;92(1):51–70.
110. Geruso M. Selection in employer health plans: Homogeneous prices and heterogeneous preferences. Mimeo: Princeton University; 2011.
111. Glied S. Managed care. In: Amsterdam, North Holland: Elsevier; 2000;707–753. Culyer AJ, Newhouse JP, eds. Handbook of health economics. Vol. 1.
112. Golosov M, Tsyvinski A. Optimal taxation with endogenous insurance markets. Quarterly Journal of Economics. 2007;122(2):487–534.
113. Gross T, Notowidigdo MJ. Health insurance and the consumer bankruptcy decision: Evidence from expansions of medicaid. Journal of Public Economics. 2011;95(7–8):767–778.
114. Gruber J. The consumption smoothing benefits of unemployment insurance. American Economic Review. 1997;87(1):192–205.
115. Gruber J. Disability insurance benefits and labor supply. Journal of Political Economy. 2000;108(6):1162–1183.
116. Gruber J. Public finance and public policy. 3rd ed. New York: Worth Publishers; 2009.
117. Gruber J, Wise DA. Social security and retirement around the world NBER Book Series - International Social Security Chicago: University of Chicago Press; 1999.
118. Hamermesh DS. Social insurance and consumption: An empirical inquiry. American Economic Review. 1982;72(1):101–113.
119. Handel, B. R. (2011). Adverse selection and switching costs in health insurance markets: When nudging hurts. NBER working paper, No. 17459, National Bureau of Economic Research.
120. Hansen GD, Imrohoroglu A. The role of unemployment insurance in an economy with liquidity constraints and moral hazard. Journal of Political Economy. 1992;100(1):118–142.
121. Hartley GR, van Ours JC, Vodopivec M. Incentive effects of unemployment insurance savings accounts: Evidence from Chile. Labour Economics. 2011;18(6):798–809.
122. Hemenway D. Propitious selection. Quarterly Journal of Economics. 1990;105(4):1063–1069.
123. Hendel I, Lizzeri A. The role of commitment in dynamic contracts: Evidence from life insurance. Quarterly Journal of Economics. 2003;118(1):299–327.
124. Hendren, N. (2012). Private information and insurance rejections. NBER working paper, No. 18282, National Bureau of Economic Research.
125. Herring B. The effect of the availability of charity care to the uninsured on the demand for private health insurance. Journal of Health Economics. 2005;24(2):225–252.
126. Hopenhayn HA, Nicolini JP. Optimal unemployment insurance. Journal of Political Economy. 1997;105(2):412–438.
127. Hosseini R. Adverse selection in the annuity market and the role for social security. Mimeo 2010; In: http://www.public.asu.edu/∼rhossein/RoozbehHosseini/Researchfiles/HosseiniAnnuitySSFinal.pdf; 2010.
128. Hubbard RG, Skinner J, Zeldes SP. Precautionary saving and social insurance. Journal of Political Economy. 1995;103(2):360–399.
129. Huggett M, Parra JC. How well does the US social insurance system provide social insurance? Journal of Political Economy. 2010;118(1):76–112.
130. Jappelli T, Pistaferri L. The consumption response to income changes. Annual Review of Economics. 2010;2(1):479–506.
131. Kaplan G. Moving back home: Insurance against labor market risk. Journal of Political Economy. 2012;120(3):446–512.
132. Kaplow L. Incentives and government relief for risk. Journal of Risk and Uncertainty. 1991;4(2):167–175.
133. Karlan D, Zinman J. Observing unobservables: Identifying information asymmetries with a consumer credit field experiment. Econometrica. 2009;77(6):1993–2008.
134. Katz LF, Meyer BD. Unemployment insurance, recall expectations, and unemployment outcomes. Quarterly Journal of Economics. 1990;105(4):973–1002.
135. Kling JR, Mullainathan S, Shafir E, Vermeulen LC, Wrobel MV. Comparison friction: Experimental evidence from medicare drug plans. Quarterly Journal of Economics. 2012;127(1):199–235.
136. Kocherlakota NR. The equity premium: It’s still a puzzle. Journal of Economic Literature. 1996;34(1):42–71.
137. Kremer M, Miguel E. Worms: Identifying impacts on education and health in the presence of treatment externalities. Econometrica. 2004;72(1):159–217.
138. Kroft K. Takeup, social multipliers and optimal social insurance. Journal of Public Economics. 2008;92(3–4):722–737.
139. Kroft, K., & Notowidigdo, M. J. (2011). Should unemployment insurance vary with the unemployment rate? Theory and evidence. NBER working paper, No. 17173, National Bureau of Economic Research.
140. Krueger AB, Meyer BD. Labor supply effects of social insurance. In: 1st ed. Amsterdam, North Holland: Elsevier; 2002;2327–2392. Auerbach AJ, Feldstein M, eds. Handbook of public economics. Vol. 4.
141. Krueger, A. B., & Mueller, A. I. (2011). Job search and job finding in a period of mass unemployment: Evidence from high-frequency longitudinal data. IZA Discussion Paper, No. 5450, Institute for the Study of Labor (IZA).
142. Laibson D. Golden eggs and hyperbolic discounting. Quarterly Journal of Economics. 1997;112(2):443–477.
143. Lalive, R. (2003). Social interactions in unemployment. IZA discussion paper, No. 803, Institute for the Study of Labor (IZA).
144. Lalive R. Unemployment benefits, unemployment duration, and post-unemployment jobs: A regression discontinuity approach. American Economic Review. 2007;97(2):108–112.
145. Lalive R. How do extended benefits affect unemployment duration a regression discontinuity approach. Journal of Econometrics. 2008;142(2):785–806.
146. Lalive R, van Ours JC, Zweimüller J. How changes in financial incentives affect the duration of unemployment. Review of Economic Studies. 2006;73(4):1009–1038.
147. LaLonde, R. (2007). The case for wage insurance. Council special report 30, Council on Foreign Relations Press.
148. LaLumia, S. (2011). The EITC, tax refunds, and unemployment spells. Department of Economics working paper, No. 2011–09, Department of Economics, Williams College.
149. Landais, C. (2011). Heterogeneity and behavioral responses to unemployment benefits over the business cycle. SIEPR working paper, Stanford Institute for Economic Policy Research.
150. Landais, C. (2012). Assessing the welfare effects of unemployment benefits using the regression kink design. PEP working paper, London School of Economics.
151. Landais, C., Michaillat, P., & Saez, E. (2012). Optimal unemployment insurance over the business cycle. NBER working paper, No. 16526, National Bureau of Economic Research.
152. Lentz R. Optimal unemployment insurance in an estimated job search model with savings. Review of Economic Dynamics. 2009;12(1):37–57.
153. Lentz R, Tranas T. Job search and savings: Wealth effects and duration dependence. Journal of Labor Economics. 2005;23(3):467–490.
154. Lillard LA, Weiss Y. Uncertain health and survival: Effects on end-of-life consumption. Journal of Business & Economic Statistics. 1997;15(2):254–268.
155. Lindbeck A, Nyberg S, Weibull JW. Social norms and economic incentives in the welfare state. Quarterly Journal of Economics. 1999;114(1):1–35.
156. Lucas R. Models of business cycles. New York: Basil Blackwell; 1987.
157. Lustig J. The welfare effects of adverse selection in privatized medicare. Mimeo: Boston University; 2011; In: http://people.bu.edu/jlustig/lustigmarch2011.pdf; 2011.
158. Maestas, N., Mullen, K. J., & Strand, A. (forthcoming). Does disability insurance receipt discourage work? Using examiner assignment to estimate causal effects of SSDI receipt. American Economic Review.
159. Mahoney, N. (2012). Bankruptcy as implicit health insurance. NBER working paper, No. 18105, National Bureau of Economic Research.
160. Manning WG, Newhouse JP, Duan N, Keeler EB, Leibowitz A. Health insurance and the demand for medical care: Evidence from a randomized experiment. The American Economic Review. 1987;77(3):251–277.
161. McCarthy, D., & Mitchell, O. S. (2003). International adverse selection in life insurance and annuities. NBER working paper, No. 9975, National Bureau of Economic Research.
162. Mehra R, Prescott EC. The equity premium: A puzzle. Journal of Monetary Economics. 1985;15(2):145–161.
163. Metrick A. A natural experiment in jeopardy!. American Economic Review. 1995;85(1):240–253.
164. Meyer BD. Unemployment insurance and unemployment spells. Econometrica. 1990;58(4):757–782.
165. Meyer BD, Viscusi WK, Durbin DL. Workers’ compensation and injury duration: Evidence from a natural experiment. American Economic Review. 1995;85(3):322–340.
166. Mitchell OS, Poterba JM, Warshawsky MJ, Brown JR. New evidence on the money’s worth of individual annuities. American Economic Review. 1999;89(5):1299–1318.
167. Newhouse JP. Princing the priceless: A health care conundrum. Cambridge, Massachusetts: The MIT Press; 2002.
168. Newhouse JP. Free for all?: Lessons from the RAND health insurance experiment. RAND Corporation Insurance Experiment Group Cambridge, Massachusetts: Harvard University Press; 1996.
169. Nichols AL, Zeckhauser RJ. Targeting transfers through restrictions on recipients. American Economic Review. 1982;72(2):372–377.
170. Nyman J. The theory of demand for health insurance. Stanford, California: Stanford University Press; 2003.
171. Orszag JM, Snower DJ. Incapacity benefits and employment policy. Labour Economics. 2002;9(5):631–641.
172. Oster E, Shoulson I, Quaid K, Dorsey ER. Genetic adverse selection: Evidence from long-term care insurance and Huntington disease. Journal of Public Economics. 2010;94(11–12):1041–1050.
173. Pauly MV. Overinsurance and public provision of insurance: The roles of moral hazard and adverse selection. Quarterly Journal of Economics. 1974;88(1):44–62.
174. Philipson TJ, Becker GS. Old-age longevity and mortality-contingent claims. Journal of Political Economy. 1998;106(3):551–573.
175. Rabin M. Risk aversion and expected-utility theory: A calibration theorem. Econometrica. 2000;68(5):1281–1292.
176. Rothschild M, Stiglitz JE. Equilibrium in competitive insurance markets: An essay on the economics of imperfect information. Quarterly Journal of Economics. 1976;90(4):630–649.
177. Rothstein J. Is the EITC as good as an NIT? Conditional cash transfers and tax incidence. American Economic Journal: Economic Policy. 2010;2(1):177–208.
178. Schmieder JF, Wachter Tv, Bender S. The effects of extended unemployment insurance over the business cycle: Evidence from regression discontinuity estimates over 20 years. Quarterly Journal of Economics. 2012;127(2):701–752.
179. Shavell S, Weiss L. The optimal payment of unemployment insurance benefits over time. Journal of Political Economy. 1979;87(6):1347–1362.
180. Shimer, R. and Werning, I. (2006). On the optimal timing of benefits with heterogeneous workers and human capital depreciation. NBER working paper, No. 12230, National Bureau of Economic Research.
181. Shimer R, Werning I. Reservation wages and unemployment insurance. Quarterly Journal of Economics. 2007;122(3):1145–1185.
182. Shimer R, Werning I. Liquidity and insurance for the unemployed. American Economic Review. 2008;98(5):1922–1942.
183. Simon KI. Adverse selection in health insurance markets? Evidence from state small group health insurance reforms. Journal of Public Economics. 2005;89(9–10):1865–1877.
184. Social Security Administration (1997). Social security programs in the United States. SSA, Publication 13–11758.
185. Spinnewijn, J. (2010). Unemployed but optimistic: Optimal insurance design with biased beliefs. Working paper, London School of Economics. http://personal.lse.ac.uk/spinnewi/biasedbeliefs.pdf.
186. Spinnewijn, J. (2012). Heterogeneity, demand for insurance and adverse selection. Working paper, London School of Economics. http://personal.lse.ac.uk/spinnewi/perceptionswelfare.pdf.
187. Starc A. Insurer pricing and consumer welfare: Evidence from medigap. Mimeo 2011; In: http://hcmg.wharton.upenn.edu/documents/research/Astarcpricing.pdf; 2011.
188. Stiglitz JE, Yun J. Integration of unemployment insurance with retirement insurance. Journal of Public Economics. 2005;89(11–12):2037–2067.
189. Summers LH. Some simple economics of mandated benefits. American Economic Review. 1989;79(2):177–183.
190. Sydnor J. (Over)insuring modest risks. American Economic Journal: Applied Economics. 2010;2(4):177–199.
191. Topel RH. On layoffs and unemployment insurance. American Economic Review. 1983;73(4):541–559.
192. Townsend RM. Risk and insurance in village india. Econometrica. 1994;62(3):539–591.
193. van Ours JC, Vodopivec M. Does reducing unemployment insurance generosity reduce job match quality? Journal of Public Economics. 2008;92(3–4):684–695.
194. von Wachter, J., Song, J., & Manchester, J. (2009). Long-term earnings losses due to mass-layoffs during the 1982 recession: An analysis using longitudinal administrative data from 1974 to 2004. Working paper, Columbia University.
195. Wang C, Williamson S. Unemployment insurance with moral hazard in a dynamic economy. Carnegie-Rochester Conference Series on Public Policy. 1996;44(1):1–41.
196. Werning I. Optimal unemployment insurance with unobservable savings. Mimeo: University of Chicago; 2002.
197. Wilson C. A model of insurance markets with incomplete information. Journal of Economic Theory. 1977;16(2):167–207.
198. Wolpin KI. Estimating a structural search model: The transition from school to work. Econometrica. 1987;55(4):801–817.
199. Yaari ME. Uncertain lifetime, life insurance, and the theory of the consumer. The Review of Economic Studies. 1965;32(2):137–150.
1We use the term “social insurance” to refer to government programs that transfer resources across states of nature after an individual is born rather than transfers of resources across individuals (e.g., through redistributive taxation). Transfers of resources across individuals—which effectively provide insurance behind the veil of ignorance—are discussed in the chapters on optimal taxation in this volume.
2See Social Security Administration (1997) for an excellent overview of modern social insurance programs in the United States. Krueger and Meyer (2002) also provide a description of many social insurance programs in the US, as well as a review of the empirical literature on their labor supply impacts.
3This analysis focuses only on static welfare considerations and ignores the issue of insurance against reclassification risk (e.g., being a sick type, or—behind the veil of ignorance—being born a particular gender), which restrictions on characteristic-based pricing can provide. Bundorf, Levin, and Mahoney (2012) investigate empirically the reclassification risk created by characteristic-based pricing of employer-provided health insurance. Hendel and Lizzeri (2003) examine issues of reclassification risk in the context of life insurance.
4All of the models discussed by Crocker and Snow (1985) assume that individuals differ only in their risk type. Allowing for preference heterogeneity as well presumably makes the potential for Pareto improvements more limited.
5Allowing for preference heterogeneity can complicate the notion of efficiency since the mapping from expected cost to willingness to pay need no longer be unique. In what follows, when we discuss the “efficient allocation” under preference heterogeneity we are referring to the constrained efficient allocation which is the one that maximizes social welfare subject to the constraint that price is the only instrument available for screening (see Einav et al., 2010a for further discussion).
6Once one allows for preference heterogeneity, the marginal cost curve need not be monotone. However for simplicity and clarity we focus on montone cases here.
7Variants of this idea have been discussed in earlier work as well. For instance, Glied (2000) and Cutler and Zeckhauser (2000) summarize attempts to identify risk-based sorting in health insurance choice, where instead of directly comparing claims or “accidents” across individuals with different insurance coverage, the comparison is made over a particular individual characteristic thought to be associated with higher claims, such as age or chronic illness.
8If one finds convincing evidence of a negative correlation between insurance coverage and expected claims, this is arguably more informative, as it is consistent with advantageous selection, even in the presence of moral hazard. This is the approach taken by Fang et al. (2008) who document a negative correlation between insurance and claims in the Medigap market, thus pointing to the existence of advantageous selection in this market. When a positive correlation is found however—as is the case in many of the papers reviewed by Cohen and Siegelman (2010)—further work is needed to determine whether the results are driven by adverse selection, or by moral hazard (perhaps combined even with advantageous selection). Another vexing case occurs when one is unable to reject the null of no correlation between insurance coverage and expected claims in the market, as in Chiappori and Salanie (2000) or Finkelstein and McGarry (2006). Such a finding is consistent with symmetric information or with the presence of offsetting advantageous selection and moral hazard. Even if moral hazard is ruled out, the inability to reject the null of no correlation could reflect the presence of multiple forms of private information acting in offsetting directions, as Finkelstein and McGarry (2006) find to be the case in the US market for long-term care insurance.
9When the ![]() contract is no coverage, the average realized costs of individuals who bought contract
contract is no coverage, the average realized costs of individuals who bought contract ![]() are simply the average claims paid out for people who have contract
are simply the average claims paid out for people who have contract ![]() . When the
. When the ![]() contract involves some (lower) coverage amount, then we measure the average incremental claims for those with policy
contract involves some (lower) coverage amount, then we measure the average incremental claims for those with policy ![]() , or, in other words, the average additional claims that insurance policy
, or, in other words, the average additional claims that insurance policy ![]() would have to pay out beyond what policy
would have to pay out beyond what policy ![]() would pay out, for the accident occurrences of those who have policy
would pay out, for the accident occurrences of those who have policy ![]() .
.
10Of course, it is possible that the moral hazard effect of insurance is greater for some individuals than others and that, anticipating this, individuals whose behavior is more responsive to insurance may be more likely to buy insurance. We should still view this as selection, however, in the sense that individuals are selecting insurance on the basis of their anticipated behavioral response to it. Einav, Finkelstein, Ryan, Schrimpf, and Cullen (2011) provide empirical evidence of such “selection on moral hazard.”
11Hendren (2011) is a notable exception that tests for and detects evidence of private information in disability and unemployment insurance markets.
12An additional attraction of this approach is that it recovers primitives that may be of inherent interest for other reasons, such as estimates of the distribution of risk aversion in the population.
13Brown et al. (2011) provide a helpful example to illustrate this intuition: “pre-risk adjustment, Hispanics were roughly $800 cheaper than their (non-risk adjusted) capitation payments; after risk adjustment, Hispanics with a history of congestive heart failure (one of the most common conditions included in the risk formula) are $4000 cheaper than their (risk adjusted) capitation payment” (page 3). As a result, the incentive of the insurer to try to recruit Hispanics into plans is much higher when plans are reimbursed differently on the basis of whether the individual has a history of congestive heart failure.”
14We focused on adverse selection and not moral hazard since, as previously noted, moral hazard is in general not an area where the public sector has a comparative advantage over the private sector in redressing market failure.
15Physical externalities may be substantial in some cases; in a developing country context, recent work has documented the enormous social returns in both the short and longer run to the subsidized de-worming of children (Baird, Hicks, Kremer, & Miguel, 2011; Kremer & Miguel, 2004).
16One potential explanation for low asset holdings is that individuals would save much more in the absence of government-provided social insurance. However, empirical estimates of the impact of unemployment benefit levels on savings are relatively modest in magnitude (Engen & Gruber, 2001) and increases in unemployment benefits appear to substantially relax liquidity constraints in practice (Card, Chetty, & Weber, 2007a, 2007b; Chetty, 2008). These findings indicate that individuals would not accumulate substantial buffer stocks even if social insurance benefits were lower.
17The lack of such buffer stock savings is even more difficult to explain given that shocks such as unemployment generate long-lasting, possibly permanent earnings losses (von Wachter, Song, & Manchester, 2009).
18Formally, consider an economy with ![]() identical agents solving (9) and facing idiosyncratic risks. For each agent, the impact of changes in his own effort on
identical agents solving (9) and facing idiosyncratic risks. For each agent, the impact of changes in his own effort on ![]() are proportional to
are proportional to ![]() . For the planner, the aggregate impact of changes in effort is
. For the planner, the aggregate impact of changes in effort is ![]() . As
. As ![]() grows large, the impact of agent
grows large, the impact of agent ![]() ’s effort on
’s effort on ![]() approaches
approaches ![]() and can therefore be ignored when solving the private optimization problem in (9). However, the impact of changes in effort on the planner’s problem in (11) are unaffected by
and can therefore be ignored when solving the private optimization problem in (9). However, the impact of changes in effort on the planner’s problem in (11) are unaffected by ![]() .
.
19This elasticity measures the total effect of an increase in benefits on ![]() , taking into account the tax increase needed to finance the higher level of benefits.
, taking into account the tax increase needed to finance the higher level of benefits.
20This approach assumes that the other parameters in (18)—namely ![]() and
and ![]() —do not vary with
—do not vary with ![]() . In practice, these parameters are likely to vary with
. In practice, these parameters are likely to vary with ![]() . For example, the liquidity effects documented e.g., in Chetty (2008) imply that
. For example, the liquidity effects documented e.g., in Chetty (2008) imply that ![]() is likely to fall as
is likely to fall as ![]() rises, as liquidity constraints bind more tightly when
rises, as liquidity constraints bind more tightly when ![]() is low. Hence, one should ideally estimate all the sufficient statistics in (18) as a function of
is low. Hence, one should ideally estimate all the sufficient statistics in (18) as a function of ![]() to calculate the optimal benefit level.
to calculate the optimal benefit level.
21Cochrane’s conclusion that insurance markets for unemployment are incomplete rests on the assumption that utility is not state-dependent. If utility is state-dependent, consumption may fall during unemployment spells simply because the marginal utility of consumption is lower when not working. Gruber’s (1997) approach provides more definitive evidence of incomplete insurance by using variation in UI benefit amounts rather than simply quantifying the size of consumption drops during unemployment.
22If ![]() , as we would expect with low unemployment risk, then a 10% point increase in the replacement rate would lead to a 10% point reduction in the consumption drop absent crowd out.
, as we would expect with low unemployment risk, then a 10% point increase in the replacement rate would lead to a 10% point reduction in the consumption drop absent crowd out.
23Another prominent approach is to analyze the impacts of income fluctuations on consumption using statistical decompositions of the income process into permanent and transitory components and examining the covariances of these components with consumption (see e.g., Blundell, Pistaferri, & Preston, 2008). Jappelli and Pistaferri (2010) provide a comprehensive review of this work.
24To be clear, persistent wage shocks do not invalidate the use of temporary consumption drops to analyze optimal UI, because the observed consumption drop incorporates all future changes in income in an optimizing model (see Section 3.3.1). However, persistent wage shocks raise the possibility that the optimal insurance policy is not merely to provide benefits while the agent is out of work but also after he is reemployed.
25If utility is non-separable, one must bound the degree of complementarity between consumption and leisure in order to bound risk aversion using this method. Chetty uses the estimates of Cochrane (1991) and Gruber (1997) to place an upper bound on this complementarity parameter and shows that even at this upper bound, ![]() .
.
26Conversely, however, this approach is less likely to yield accurate predictions about ex-ante choices in risky environments.
27Technically, one must measure the willingness to pay in the high state, as ![]() appears in the denominator of
appears in the denominator of ![]() .
.
28In a different context, Browning and Crossley’s (2001) finding that unemployment shocks have little impact on consumption for individuals with high levels of assets suggests that ![]() may be
may be ![]() for unemployment (i.e., no state dependence for leisure).
for unemployment (i.e., no state dependence for leisure).
29For instance, suppose giving an agent $1000 increases his reported happiness from 2 to 3 in the low state and 7 to 9 in the high state. One cannot identify ![]() without knowing whether an increase in happiness from 2 to 3 translates into a smaller or larger welfare gain than an increase in happiness from 7 to 9.
without knowing whether an increase in happiness from 2 to 3 translates into a smaller or larger welfare gain than an increase in happiness from 7 to 9.
30A technical issue which arises in empirical implementation of (22) is that ![]() must be measured holding the tax
must be measured holding the tax ![]() fixed, whereas the elasticity
fixed, whereas the elasticity ![]() must be measured while permitting
must be measured while permitting ![]() to vary. Instead of attempting to estimate both parameters, Chetty uses numerical simulations to show that the effect of a UI benefit increase on job finding rates is virtually identical whether or not UI taxes are held fixed. This is because the fraction of unemployed individuals is quite small, making UI tax rates very low.
to vary. Instead of attempting to estimate both parameters, Chetty uses numerical simulations to show that the effect of a UI benefit increase on job finding rates is virtually identical whether or not UI taxes are held fixed. This is because the fraction of unemployed individuals is quite small, making UI tax rates very low.
31If utility is not state dependent, one could infer the agent’s degree of risk aversion ![]() from the size of moral hazard vs. liquidity effects and the consumption drop:
from the size of moral hazard vs. liquidity effects and the consumption drop: ![]() . This restriction, which is closely related to the formula for risk aversion in Chetty (2006a), could be evaluated empirically in future work.
. This restriction, which is closely related to the formula for risk aversion in Chetty (2006a), could be evaluated empirically in future work.
32Both formulas derived above continue to hold in this model with stochastic wages. Conversely, the Shimer and Werning formula also holds in a model with variable search intensity.
33This corresponds to Eq. (12) in Shimer and Werning (2007), where the unemployment rate is ![]() . The slight difference between the formulas (the
. The slight difference between the formulas (the ![]() factor in the denominator) arises because Shimer and Werning write the formula in terms of a partial-derivative-based elasticity. Here,
factor in the denominator) arises because Shimer and Werning write the formula in terms of a partial-derivative-based elasticity. Here, ![]() is the elasticity including the UI tax response needed to balance the budget; in Shimer and Werning’s notation, it is holding the tax fixed.
is the elasticity including the UI tax response needed to balance the budget; in Shimer and Werning’s notation, it is holding the tax fixed.
34One possibility is a model with impatient workers who wait to search for a job until they have no cash-on-hand. Such a model would generate significant liquidity effects but no impacts on ex-post wages, and would have very different welfare implications.
35Rothstein (2010) and Chetty, Friedman, Olsen, and Pistaferri (2011) present evidence that tax and transfer policies affect wage rates and the distribution of jobs in equilibrium. Rothstein shows that expansions of the Earned Income Tax Credit (EITC) depress wages for workers who are ineligible for the EITC, while Chetty et al. show that the tax schedule in Denmark affects even the earnings of workers unaffected by the tax incentives because of firm responses. The effects of social insurance on equilibrium outcomes could potentially be uncovered using a similar research design that focuses on groups whose incentives are not directly affected by the program.
36It is easy to show that ![]() is concave because there is no uncertainty following reemployment; however,
is concave because there is no uncertainty following reemployment; however, ![]() could be convex. Lentz and Tranas (2005) and Chetty (2008) report that non-concavity never arises in their simulations for a broad range of plausible parameters. Therefore, we assume that
could be convex. Lentz and Tranas (2005) and Chetty (2008) report that non-concavity never arises in their simulations for a broad range of plausible parameters. Therefore, we assume that ![]() is globally concave in the parameter space of interest and use first-order conditions to identify the optimal level of benefits.
is globally concave in the parameter space of interest and use first-order conditions to identify the optimal level of benefits.
37A related point is that the same formula also holds in the context of other social insurance programs where the structure of the positive model differs. For instance, in the context of health insurance, one may choose the intensity of care after getting sick rather than controlling ex-ante effort. The formula in (31) holds in such a model with an appropriate redefinition of the average marginal utilities and the elasticity that enters the planner’s budget constraint. Chetty (2006b) considers an example of “tenure review” that is formally analogous to this case.
38One potential rationale for this approach is that private markets are essentially at a corner of providing zero insurance against certain risks (e.g., unemployment), and thus marginal changes in public insurance can be evaluated under the assumption that there is no private insurance. Unfortunately, this is not an accurate description of insurance markets in many important applications such as health.
39Consistent with the results in Section 3.3.1, the distortion in ![]() has no impact on the formula if
has no impact on the formula if ![]() ; it is only because savings are taxed that this behavioral response matters.
; it is only because savings are taxed that this behavioral response matters.
40See Kroft (2008) for an analysis of optimal UI with social spillovers in takeup decisions.
41Landais, Michaillat, and Saez focus on benefits levels rather than the duration of benefits. However, the typical policy response to a recession is an extension in the duration of benefits rather than an increase in the level of benefits. Understanding why this is the case is an interesting open area for further work.
42This point illustrates a general weakness of the sufficient statistic approach, which is that the assumptions used to derive the formula are never explicitly tested because the parameters of the model are never fully identified. See Chetty (2009) for further discussion of these issues.
43Such screening through costly ordeals is only desirable if the ordeal is highly effective at separating agents with high vs. low valuations of the program. If the screening mechanism is not powerful, simply reducing benefit levels by an equivalent amount may yield larger welfare gains. See the chapter by Piketty and Saez in this volume for a discussion of related issues in the context of “workfare” models of taxation.
44The very high optimal replacement rates predicted by Hopenhayn and Nicolini’s model should essentially be interpreted as optimal consumption levels over the unemployment spell rather than optimal benefit levels.
45The literature may have developed in this way because it is most natural study selection in markets where there is some private provision of insurance. In the US, which has been the primary focus on empirical work because of data availability, private insurance has been much more important in the health care market than the other markets.
46One exception is Summers (1989), who compares the effects of mandates and taxes in a static model without uncertainty. Extending Summers’ analysis to insurance markets would be an interesting direction for future research.