17
EVA Implementation, Market Over-Reaction and the Theory of Low-Hanging Fruit
Barbara Lougee, Ashok Natarajan and James S. Wallace
One often hears the expression that a picture is worth a thousand words. This may be especially true when attempting to describe mathematical relationships. In such situations, charts, like pictures, are able to convey the hypothetical thousand words. Sometimes, however, a thousand words only takes one to the middle chapter of a longer story. In such cases, the reader (or viewer of the picture) could be led astray in thinking the picture is complete.
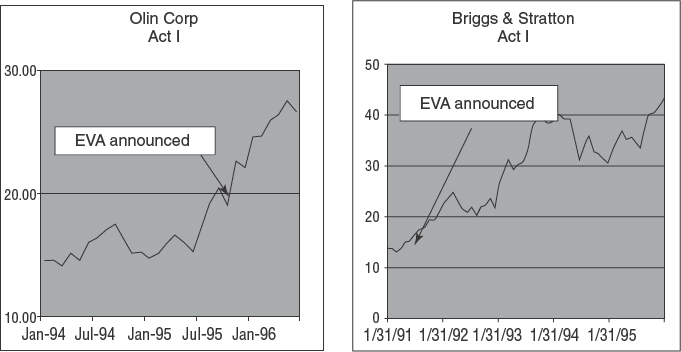
In an effort to sell their products in an efficient manner, marketers may justifiably resort to using time and space saving devices such as charts to convey their message. This appears to be the case with regard to recent advertisements that appeared in the Harvard Business Review.1 Stern Stewart and Company used charts in a series of advertisements to demonstrate a claimed relationship between a firm's stock price and the announcement of the firm adopting EVA. The advertisements had titles such as “Every Company Is in Business to Create Value. EVA Makes It Happen” and “Forget EPS, ROE, and ROI. EVA Is What Drives Stock Prices.” A pair of charts representing two of the featured companies, reproduced in Figure 17.1, documents a phenomenal stock price surge following the announcement of the firm's EVA adoption.
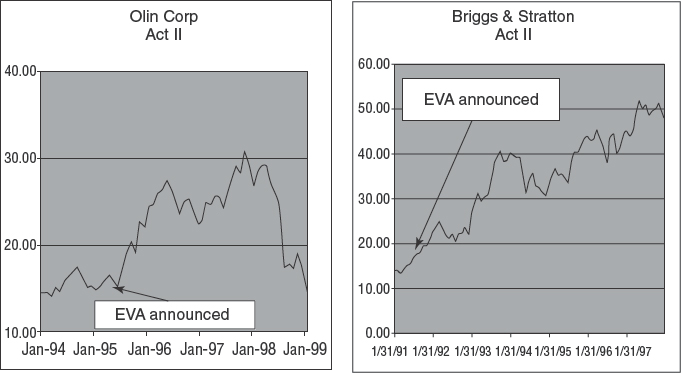
A fitting title to this story may be the “Tale of Two Firms.” It seems the charts only went to the middle chapters for this tale. As the following charts in Figure 17.2 demonstrate, these two companies experienced much different stock price performance the following two years.
By completing the next few chapters, i.e., years, we can see, at least in these examples, the mere act of announcing EVA adoption is not always sufficient to insure continual superior stock performance. At first glance it may appear that these two charts reveal vastly different stories. This may not be the case if we consider additional information. The advertisements really are making two claims. The one implied by the charts is that simply announcing EVA adoption leads to surging stock prices. As we see for these two firms, this was initially the case. The second claim being made explicitly is that EVA drives stock prices. For these two firms, during the period shown, this claim appears to have some validity. Olin averaged a negative $132M EVA for the couple of years prior to EVA adoption. This improved to an average negative $25M EVA for the implementation year and the year following implementation. Olin, however, was not able to maintain the improvement. EVA slipped to an average negative $55M over the last couple of years on the chart, corresponding to the ending drop in stock price. Briggs & Stratton's EVA, in contrast, continued to improve throughout the period shown, from an average −$41M prior to adoption, to −$20M in the period shortly after implementation, to an average positive $24M the last couple of years shown.2
Of course these are just two of many firms that have adopted EVA. In this paper we study over seventy firms that have contracted with Stern Stewart to implement EVA, examining several items. First, we wish to see if the market reacts positively, on average, to the announcement of the EVA adoption as demonstrated with the two firms above. Second, we examine subsequent stock performance several years later. Also related to the EVA adoption, we examine several management actions that have been hypothesized to be associated with residual income-based measures (e.g., investing decisions, share repurchases, asset utilization). Finally, we examine changes in the overall firm's calculated EVA from prior to EVA adoption, through the initial implementation period, to several years later.
We find, similar to stock price reaction in the above charts, firms experience superior stock price performance in the two-year period beginning with the adoption of EVA. On average, firms reported positive market-adjusted returns of over 7% in the two-year period including the year of announcement and the following year. During the next three-year period, however, the firms, on average, reported negative market-adjusted returns of approximately 6.5%. In other words, the previous gains were virtually all given back. This stock performance is consistent with our findings for calculated EVA. While still negative, the firms' average EVA improved nearly 40% in the period following EVA adoption compared to the prior couple of years. EVA did continue to improve during the period a few years later, however the improvement declined from nearly 40% to under 9%. These results, taken together, suggest that the market over-reacted to the initial EVA adoption. The data is suggestive that the market anticipated large performance gains, and further anticipated that these gains would persist. When the performance improvement declined, the market adjusted its valuations of these firms downward. Our findings are consistent with the firms initially experiencing large EVA improvements from “picking the low hanging fruit.” Suggestive evidence appears in such characteristics as firm dispositions following EVA adoptions. Dispositions (e.g., disposing of low return assets) increased over 50% in the two-year period following EVA implementation and then increased only an additional 9% the following two-year period. An obvious explanation is that the firm first identifies the actions that will have the biggest effect on EVA (i.e., the low-hanging fruit) and performs these actions first. It becomes increasingly more difficult to identify such fruitful actions, and hence improvements in EVA decline. Interestingly, the market did not appear to anticipate this phenomenon.
The remainder of the paper is organized as follows. In the next section we review some of the related literature. Next we describe both our sample selection procedure and our research design. The results are presented in the following section. We provide some concluding remarks in the final section.
LITERATURE REVIEW
Much of the early research examining the EVA concept has looked at its correlation with security returns, usually in relation to some measure of GAAP earnings (e.g., Biddle, Bowen & Wallace [1997], Chen and Dodd [1997]). These studies generally find that while a positive association exists between EVA and stock returns, traditional earnings does a relatively better job of explaining returns.
While the studies of correlations with current stock prices are interesting, they may cloud a more important question. Does the adoption of EVA provide internal incentives that lead to a better performing firm? This is nicely articulated in the Merrill Lynch studies that find earnings do matter. “EVA is indeed an important analytical tool for corporate managers as are all tools that focus on returns in excess of capital requirements. However, there is nothing in these results that supports the contention that earnings are irrelevant. This work suggests that EVA techniques by themselves will probably be no more effective in enhancing shareholder value than will other management techniques if the EVA process does not ultimately drive earnings and earnings growth” (Bernstein 1998, p. 6). Another researcher points out the possibility that too much attention is being placed on correlations with stock returns when that is probably not what is of interest to managers. Robert Kleiman, a professor who has studied EVA and shareholder value states, “When companies consider making EVA their primary performance criterion, they are searching for more than just a better financial metric. They are seeking a better way to motivate value-adding behavior throughout the organization” (Kleiman 1999, p. 80). This concern has led several researchers to question whether EVA and EVA-like management systems, when adopted by firms, lead to internal changes within the firm.
EVA, unlike accounting earnings, includes a charge for all capital, including equity financing. This should theoretically lead to a greater capital awareness among managers and affect behavior accordingly. Wallace (1997) is one of the first to study how EVA-type incentives affect internal decision-making. Wallace looks at a group of 40 firms that adopt an economic profit metric (including, but not limited to EVA) and compares certain operating, investing, and financing behavior of these firms before and after the metric adoption. Wallace compares these findings with a group of similar firms that continues to use traditional accounting metrics, such as EPS, in their incentive compensation contracts.
Wallace hypothesizes that the increased capital awareness associated with EVA measures will alter managers' behavior through investing, operating, and financing decisions. Specifically, he reasons that managers will become more selective in new investment since they will now face a capital charge based on a more comprehensive (and higher) cost of capital and capital base. He also reasons that managers, faced with a capital charge on all capital employed, will become more willing to dispose of under-performing assets. These assets, however, under traditional measures may appear profitable without an associated capital charge. Wallace finds that the firms adopting economic profit measures are significantly more willing to dispose of assets and, although they still increase new investment after the adoption, they do so at a significantly lower pace relative to the matched control sample of firms.
Wallace next looks at how the firms manage assets in place. He finds that assets turnover, defined as sales divided by average total assets, increases significantly following adoption, relative to the control firms. Wallace further reasons that the capital charge provides incentive to return capital to shareholders that, under prior incentives, may have been kept in low return forms. Wallace finds that share repurchases for the adopting firms significantly increase relative to the control firms, suggesting this is a preferred method over dividends to return capital. Finally, Wallace reports that residual income for the adopting firms increases relative to the control firms. He concludes that the incentive effects of these newly adopted metrics prove to be powerful. In other words, the firms get what they choose to measure and reward.
Balachandran (2001) extends Wallace (2001)’s examination of the investing decision by partitioning EVA adopters based on the performance measure they had previously employed. Balachandran hypothesizes that firms that previously used an earnings-based measure are addressing an overinvestment problem and that switching to an EVA-based measure will result in a decrease in investment and an increase in cash distributed to shareholders. In contrast, the author hypothesizes that firms that previously used ROI-based measures are addressing an under-investment problem and that switching to an EVA-based measure will result in an increase in investment and a decrease in cash distributed to shareholders. Balachandran finds significant results consistent with his predictions for firms switching from earnings-based measures, but insignificant results for the other partition of firms. Balachandran also reports that residual income significantly increased for both groups of firms from the period prior to the switch.
These studies represent a good first step toward learning whether adopting EVA-like measures provide increased shareholder value since these studies provide evidence of the incentive effects of EVA. While the research indicates that managers alter behavior when adopting economic profit measures, and that these changes may be consistent with shareholder value enhancement, the primary focus of these studies is not to investigate the impact on the firms' future performance of this behavior. Some recent studies have begun to fill this void.
Kleiman (1999) examines stock price performance of 71 firms that have adopted EVA as their economic profit measure and matches each of his 71 EVA firms to a single control firm based on industry classification and firm size. For an additional comparison, the author also matches each EVA firm to the median peer in the same four-digit SIC (instead of matching on only the single closest firm based on size).
Using market returns as a measure of firm performance, Kleiman finds the EVA firms to significantly outperform each control group. The EVA firms, on average have a 7.8 percent larger return over the three-year period following EVA adoption than do their industry and size matched control firm. The results are more pronounced, 28.8 percent over the three-year post-adoption period, when the comparison is made with median peer firms.
Hogan and Lewis (2000) find contrary evidence on the future performance of firms adopting economic profit plans. The authors examine 65 firms adopting a more general definition of economic profit (which includes EVA) and compare these firms to control firms matched on industry, size, and pre-event performance. Hogan and Lewis document significant improvements in operating performance for their sample firms in the four-year period following adoption. The authors also find, however, that the sample of control firms show no significant difference in operating performance to economic profit adopting firms. They conclude that economic profit plans are no better than traditional plans that provide a blend of earnings-based bonuses and stock-based compensation.
We extend the prior literature by examining both internal firm performance and external market reactions over an extended examination period subsequent to EVA adoption. Further, we partition the subsequent period in order to compare initial performance gains with subsequent period gains along with the associated market reactions in each period to the firm's performance in that period.
SAMPLE SELECTION
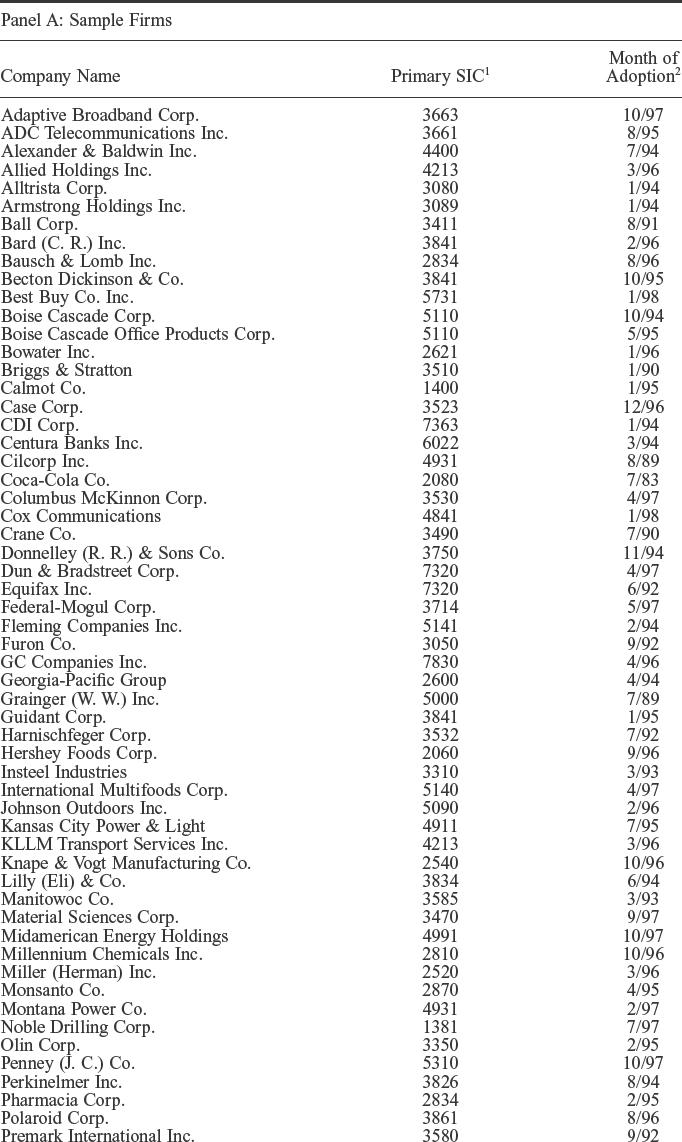
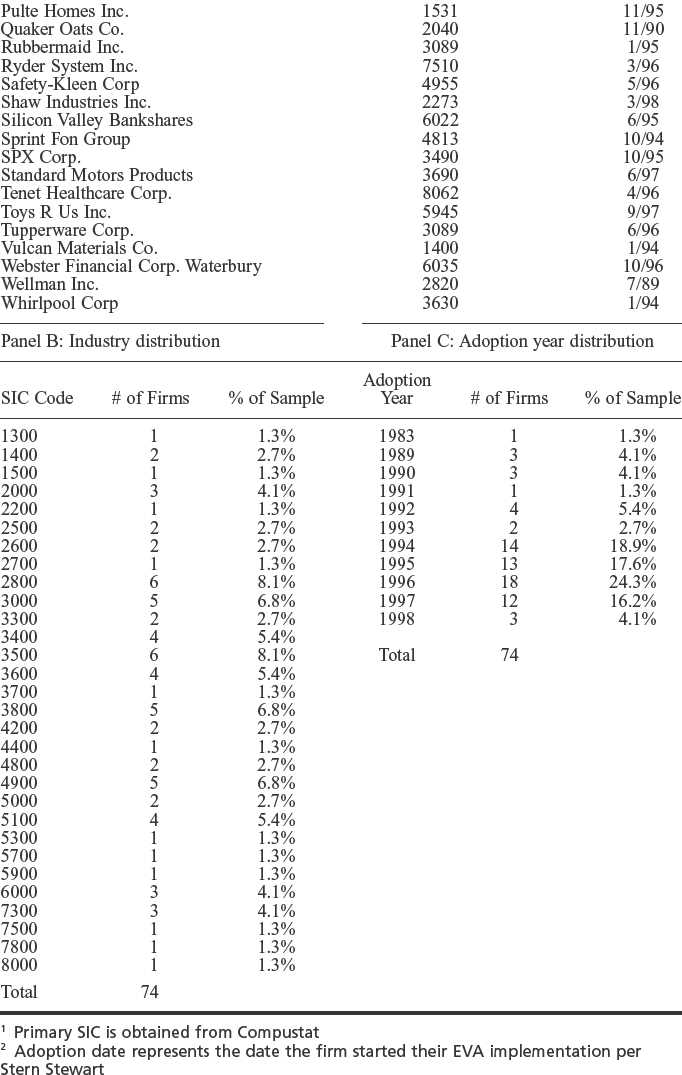
Our sample consists of 74 firms that not only adopted an EVA financial management system, but also contracted with Stern Stewart and Co. for the implementation. We deleted any firms that did not have the required financial and market data on Compustat and CRSP in order to do our empirical testing. The EVA adoption date was obtained directly from Stern Stewart. Table 17.1, Panel A contains a listing of the sample firms along with their primary SIC classification and their EVA adoption date. Panel B of Table 17.1 provides a breakdown of the SIC classifications. We compared this distribution to that of the S&P 500 (not shown) and found a great deal of similarity. The EVA sample had a larger representation in the 3000 SIC (36% to 27%) and a smaller representation in the 6000 SIC (4% to 16%), when grouped by 1 digit SIC. For the two samples, all other 1 digit SIC categories were within 2% of each other.
Panel B of Table 17.1 provides a distribution of the EVA adoptions by year of adoption. The earliest implementation took place in 1983, however only 14 (19%) of the adoptions occur prior to 1994. Nearly half of the adoptions took place in the three-year period from 1994 through 1996. A slight fall-off of implementations is noted following 1996. This is consistent with Balachandran (2001) who notes a similar decrease in the frequency of adoptions and suggests that there may be some degree of market saturation.
RESEARCH METHODOLOGY
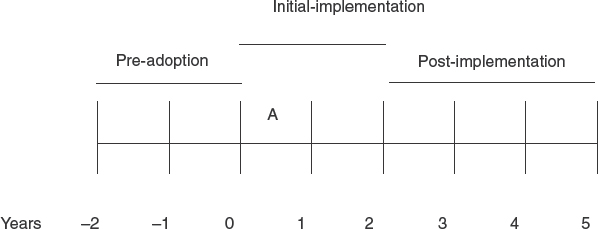
Our tests of EVA performance drivers, EVA performance, and the corresponding market reactions are based on the timeline appearing in Figure 17.3.
The letter A in Figure 17.3 represents the implementation date. This date occurs somewhere during year 0. As shown, the two years prior to year 0, years −2 and −1, represent the period prior to EVA adoption. The year in which implementation begins, year 0, and the subsequent year, year 1, represent the initial-implementation period. This period will be compared to both the pre-adoption period and the subsequent post-implementation period, years 2, 3, and 4.
Tests of EVA drivers and performance are conducted by first calculating the average level of each metric in each of the three periods. Each firm serves as its own control in these tests.3 This avoids some questionable matches resulting from the formulaic approaches used in prior studies.4 Using the firm as its own control, (i.e., comparing firm characteristics over time) is consistent with typical EVA-based performance plans. Performance is typically based on period-to-period improvements, not on levels relative to comparable firms (Young and O'Byrne [2001]).
RESULTS
First we study changes within firms surrounding the decision to adopt EVA. Our hypotheses are motivated by the claimed incentive effects associated with the increased focus on the capital charge embedded within the EVA computation. We examine seven variables, labeled as EVA drivers, each of which is also tested in Wallace (1997).
The first two variables are associated with investing decisions. Because there is likely a greater incentive to avoid excess invested capital under an EVA performance metric (unless that capital provides higher returns than the imputed cost of capital), it is reasonable to assume that firms will dispose of poorly performing assets to avoid the associated capital charge. In addition, firms will likely be more selective in newer investment because of the heightened concern for the associated capital charge. This leads to our first two hypotheses, stated in the null form.
(H1) There will be no effect on disposition of assets following the adoption of an EVA-based financial management system.
(H2) There will be no effect on new investment following the adoption of an EVA-based financial management system.
The results of our study are reported in Table 17.2. We report a significant increase in dispositions of assets during the implementation period relative to the prior period, however this level of increased dispositions does not continue into the post-implementation period. This finding is not surprising since firms will likely first target the worse performing assets where they will receive the largest savings. Once this “low-hanging fruit” is gone, it becomes more difficult to find areas that can provide the same level of EVA improvement and therefore it is natural to see a lessening of dispositions.
Unlike Wallace (1997), we find a slight, though significant, increase in new investment, both in the implementation and the post-implementation periods. Some critics of EVA claim EVA is biased against growth and encourages managers to milk a business through under-investment (Olsen 1996). Stern Stewart counter that the EVA framework encourages investment as long as the projects yield positive NPV. They further claim that their implementation of EVA compensation, with such items as three-year rolling bonus banks, mitigates any short-term gaming of the system (Leander 1997). John Sheily, President and Chief Operating Officer of the EVA firm Briggs & Stratton, shares this attitude. After being accused of missing opportunities to expand because of their EVA system, Sheily responds, “The assertion that Briggs and Stratton is ‘dieting its way down to the core’ is silly. We have made extensive capital investments in new products and facilities in the last few years. And we will continue to make significant capital investments” (Sheily [1997]).5 Our results support the view that EVA firms may be more selective in their investment choice, but they do not appear to be “dieting their way down to the core.”
Our next hypothesis involves whether the firm returns capital to the shareholders in order to avoid a capital charge on excess accumulated capital. Wallace (1997) noted that firms appear to favor share repurchases over dividends because of the “sticky” nature of dividends. Hypothesis (H3), stated in the null form follows.
(H3) There will be no effect on share repurchases following the adoption of an EVA-based financial management system.
We find that share repurchases significantly increase during the implementation period. This increase is likely associated with the corresponding significant increase in asset dispositions during this period. We also report an insignificant decrease in repurchases the following period.
Table 17.2 Changes in EVA drivers associated with the adoption of EVA1 (T-values in parentheses)12
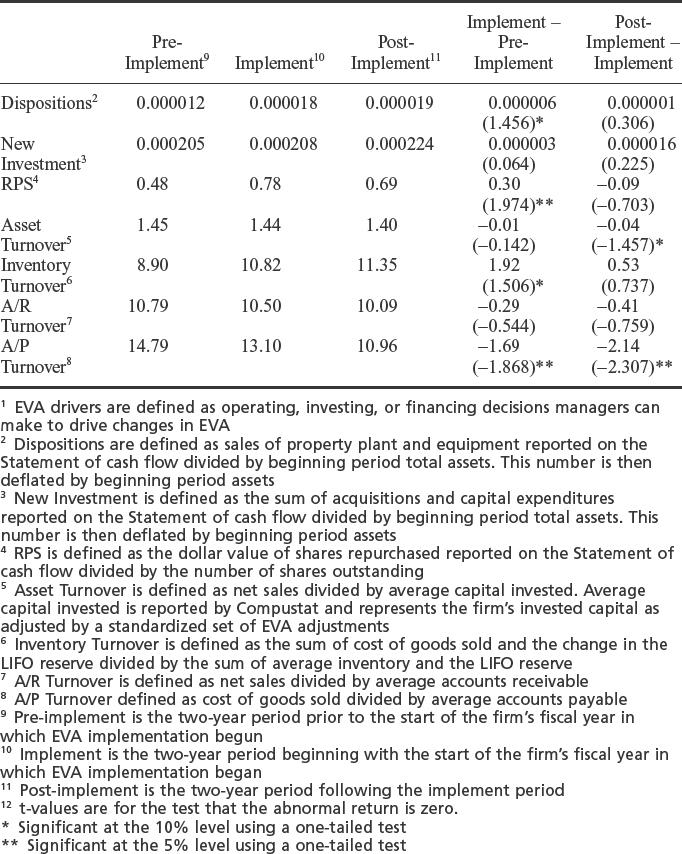
The next four hypotheses are all associated with capital utilization. In addition to paying out free cash flows, EVA is also increased by using existing assets more intensively. We examine asset turnover, defined as sales divided by average capital employed, inventory turnover defined as cost of goods sold divided by average inventory,6 accounts receivable turnover defined as sales divided by average accounts receivable, and accounts payable turnover defined as cost of goods sold divided by average accounts payable. The incentives associated with EVA's focus on capital would lead one to expect improvement in capital utilization (i.e., an increase in asset turnover, inventory turnover, and accounts receivable turnover, and a decrease in accounts payable turnover). Hypotheses (H4)–(H7), stated in the null form, follow.
(H4) There will be no effect on asset turnover following the adoption of an EVA-based financial management system.
(H5) There will be no effect on inventory turnover following the adoption of an EVA-based financial management system.
(H6) There will be no effect on accounts receivable turnover following the adoption of an EVA-based financial management system.
(H7) There will be no effect on accounts payable turnover following the adoption of an EVA-based financial management system.
We report significant increases in inventory turnover and significant decreases in accounts payable turnover in the initial implementation period. Only accounts payable turnover continues to be significant in the following period. Surprisingly, and in contrast to Wallace (1997), asset turnover is lower following EVA implementation, although insignificantly so during the implementation period.
Our next hypothesis involves how EVA performance changes following the firms' EVA adoptions. If the incentives implied by an EVA financial management system are effective, one would expect the behavior changes to translate into improvements in firm performance. Hypothesis (H8), stated in the null form, follows:
(H8) There will be no effect on firm performance following the adoption of an EVA-based financial management system.
Table 17.3 reports our findings on how firm performance, measured in terms of EVA, changes following the firms' EVA adoptions. Perhaps not surprisingly, EVA was on average negative for the sample firms prior to their decision to adopt EVA. Again, this follows the common wisdom that one is more apt to fix something that appears broken. While still negative, on average the firms improve EVA by nearly 40% during the implementation period. We hypothesize that this large increase in EVA helps account for the previously discussed increase in the firms' abnormal returns for the same period. We also hypothesize that this initial increase in EVA may be the result of “picking the low-hanging fruit” (e.g., selling non-performing assets).
Table 17.3 Firm performance (in $millions) for the periods surrounding EVA implementation. T-values in parentheses
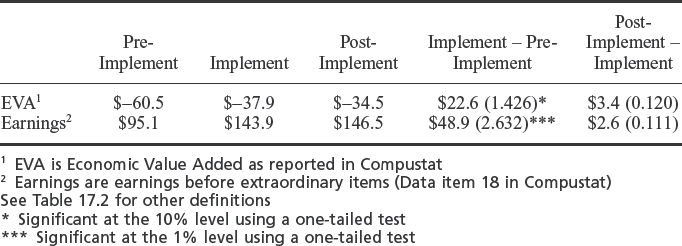
Quite telling is the computed EVA for the following period. While still improving, the improvement is only 15% of the prior period's improvement. We again hypothesize this diminished improvement in performance likely accounts for the negative abnormal returns previously discussed for the post-implementation period. The market may have initially over-reacted to the anticipated improvements in performance with a corresponding overvaluation of the firm's stock. When the continued improvements fail to materialize, the market revalues the firm's stock. These results are also consistent with the low-hanging fruit theory whereas it becomes increasingly more difficult to sustain improvement.
While EVA incentives are designed in motivate behavior leading to improved EVA performance, the stated ultimate goal of such plans is increased shareholder value. Therefore, to test this final linkage, we investigate how the market reacts to the firm's decision to adopt and implement an EVA-based financial system. This leads to our hypothesis (H9), again stated in null form.
(H9) There will be no effect on stock returns following the adoption of an EVA-based financial management system.
The results of our tests appear in Table 17.4. We first compute the pre-adoption abnormal returns.7 On average, the sample firms under-perform the market by a cumulative 2.6% during this two-year period. While not significant, this is consistent with the common notion that firms generally do not fix something that is not broken.
Table 17.4 Cumulative abnormal stock price reaction to the firm's EVA adoption announcement1
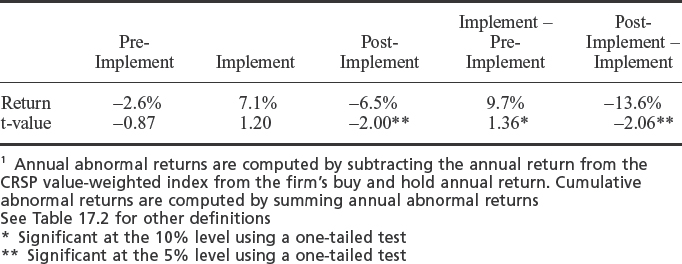
We next compute abnormal returns during the implementation period. During this two-year period the sample firms outperformed the market by a cumulative 7.1%. Although not to the degree implied by the Stern Stewart advertisements, this is consistent with the marketing hype that stock returns increase following the announcement of an EVA adoption.
Finally, we compute abnormal returns during the post-implementation period. During this three-year period the sample firms, on average, under-perform the market by a cumulative 6.5%. In other words, nearly all the “gains” of the prior period are given back. This evidence is suggestive that the market initially overvalues the sample firms around the time EVA adoption is announced, and later corrects the valuations after assessing the firms' subsequent performance.
The results presented in Tables 17.2–4 are designed to address the related questions of whether the firms' appear to be picking the low-hanging fruit, whether this helps explain their initial performance improvements, and whether the market appears to fail to anticipate this behavior and overreacts to EVA adoptions. We next address a different assertion that also appears in the Stern Stewart advertisements, namely that EVA drives stock prices. Hypothesis (H10), stated in the null form, relates to this assertion.
(H10) There will be no association between EVA performance and the firm's stock returns.
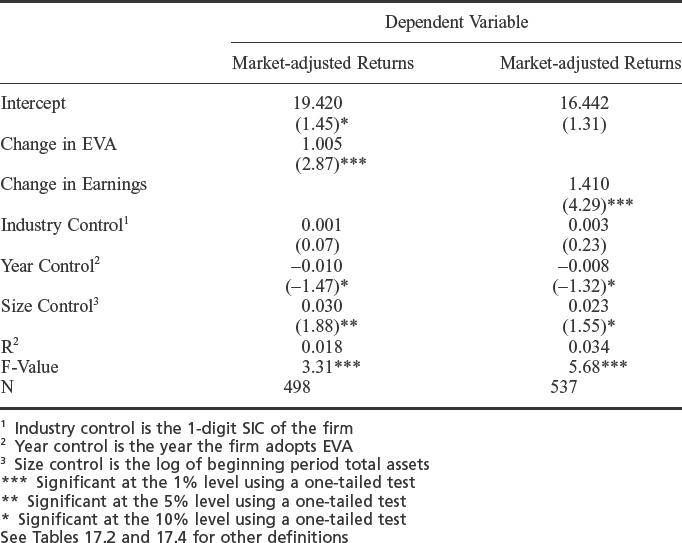
Table 17.5 reports our results. The first regression shows that, as claimed, there is a significantly positive association between market-adjusted returns and EVA improvement. This result occurs even after controlling for industry and size effects and changes over time.8
We next substituted traditional GAAP earnings for EVA in our test and find an even higher positive association between earnings and returns than between EVA and returns. In other words, EVA may appear to drive stock prices as stated in the advertisements, but that does not mean one should “forget earnings.” These results are consistent with prior research that has found a similar relative ranking among performance measures for information content (e.g., Biddle, et al. 1997).
SENSITIVITY
In order to test the robustness of our results we partitioned the sample firms into early and late EVA adopters. Early adopters are defined as firms that began implementation prior to 1994 and late adopters are those firms that began their EVA implementations in 1994 or subsequent years. We first computed EVA improvements for each firm from pre-adoption through post-implementation periods. We then compared these findings with market reactions in each corresponding period.
A rather interesting pattern emerges from this partition. While we find EVA improvement for both early and late adopters from the pre-adoption period to the initial implementation period, the improvement all but disappears for the late adopters in the post-implementation period. This suggests these later adopters may see EVA as a quick fix solution. This is further supported by the abnormal returns of each group of firms. The earlier adopters, in contrast to common thought, experienced positive abnormal returns in the period prior to adoption. These positive abnormal returns increased in the initial implementation period, and continue positive, though at a lower rate, in the post-implementation period. The later adopters experienced negative abnormal returns prior to adoption. This is more in line with the expectation that firms seek to fix what is broken. Corresponding to their EVA performance improvements in the initial implementation period these late adopters experienced positive abnormal returns. The abnormal returns turned negative for these firms in the post-implementation period corresponding to the failure to deliver continued EVA improvements.
Table 17.5 Regressions of abnormal stock price returns on firm performance and control variables. T-values in parentheses
SUMMARY
Stern Stewart has advertised EVA as the metric needed to drive stock price. Charts have been used to illustrate how a firm's stock price skyrockets following the announcement of a decision to adopt EVA. We test these claims by studying over seventy of Stern Stewart's EVA clients to see how their performance changes over time, from pre-EVA adoption, through initial implementation, and beyond. We then examine how the market reacts to the firms over the corresponding periods.
We find that, on average, the firms that chose to retain Stern Stewart to help them implement EVA were under-performers prior to adoption. This is reflected in both their low EVA and negative abnormal returns. On average the sample firms did quite well after their initial implementation relative to how they performed in the prior period. This is reflected in a nearly 40%, on average, increase in EVA and a corresponding average abnormal return in excess of 7%. The evidence suggests, however, that this rapid improvement was the result of doing the easier things first. In other words, the firms went after the low-hanging fruit. Once this fruit is picked, it becomes progressively more difficult to sustain the EVA improvement. We note that in the period following the initial EVA implementation the firms' improvements decline. We also note that the market appears to have expected the large improvements to continue. On average, the firms experienced negative abnormal returns of approximately 6.5% in this later period, virtually giving back the previous gains. This suggests that the market initially over-reacted to the EVA adoptions, over-valuing the firms based on overly optimistic expectations of future improvements, and later revalued the firms downward when those improvements failed to materialize.
NOTES
1. See Harvard Business Review, July 8, 1996 and September 10, 1996.
2. While an association is noted between EVA improvement and stock price performance, this does not prove EVA drives stock prices. We later compare EVA and traditional earnings with stock price performance and find a higher association between earning and stock price than between EVA and stock price.
3. Prior research is marked with inconsistency in the area of firm controls. Wallace (1997) matches sample firms to individual control firms based on industry classification and size. Kleiman (1999) also compares sample firms to a single control firm based on a match of industry and size, but the author further compares sample firms to the median peer firm within the same industry. Hogan and Lewis (2000) extend the matching procedure by utilizing a three characteristic match, including pre-event performance. Balachandran (2001) notes the inherent problems with these matching procedures and instead uses each firm as its own control.
4. Balachandran (2001) notes a matching based on industry and size would match Caterpillar with Compaq.
5. O'Byrne (1999) investigates this issue and provides a theoretical discussion of the conflict between shareholder value and economic profit caused by straight line depreciation and the more severe conflict between shareholder value and economic profit created by acquisition resulting from historical cost accounting. O'Byrne demonstrates how this conflict can be resolved through negative economic depreciation. This type of depreciation allows lesser charges in early years and more depreciation taken in the later years in order to match the cash flows of the asset. O'Byrne reports that only one EVA firm he is aware of uses such a method. He goes on to provide examples of how firms deal with the conflict. He finds many firms use “ad hoc” methods to mitigate the conflict between shareholder value and economic profit. In some cases, however, the conflict proves so extreme as to cause the firm to abandon EVA as a performance measure.
6. Inventory is calculated as Compustat™ data item D3, inventory, plus data item D240, LIFO reserve. Cost of goods sold is adjusted by the annual change in the LIFO reserve. Data item D240 is included in order to place all firms on a common FIFO basis.
7. Abnormal returns are computed by subtracting the annual return from the CRSP value-weighted index from the firm's buy and hold annual return. Cumulative abnormal returns are computed by summing annual abnormal returns. We also compute abnormal returns by substituting the S&P 500 index for the CRSP value-weighted index with similar findings.
8. Industry and size controls are included to mitigate the effect of not matching the sample firms against control firms based on industry and size, two measures used in prior research. We previously discussed our justification for using each firm as its own control. A year variable is included to mitigate the possible effects of any time clustering in our sample. We further address this issue under sensitivity analysis.
REFERENCES
Balachandran, S. 2001. Over-investment and Under-investment in Firms that Implement Residual Income-based Compensation, Working paper, Columbia University.
Bernstein, R. 1998. Quantitative Viewpoint: an Analysis of EVA – Part II, Merrill Lynch & Co. Global Securities & Economics Group, Quantitative & Equity Derivative Research Department. Pp. 1–7.
Biddle, G., R. Bowen, and J. Wallace. 1997. Does EVA beat earnings? Evidence on association with stock returns and firm values. Journal of Accounting and Economics 24, pp. 301–336.
Chen, S., and J. Dodd. 1997. Economic value added: An empirical examination of a new corporate performance measure. Journal of Managerial Issues. Pp. 318–333.
Hogan, C., and C. Lewis. 2000. The long-run performance of firms adopting compensation plans based on economic profits. Working paper, Vanderbilt University.
Kleiman, R. 1999. Some new evidence on EVA companies. Journal of Applied Corporate Finance 12, pp. 80–91.
Leander, T. 1997. EVA and Growth. EVAngelist 1, pp. 10–11.
O'Byrne, S. 1999. Does value based management discourage investment in intangibles? Working paper.
Olsen, E. E. 1996. Economic Value Added. Perspectives. Boston Consulting Group. Boston, Massachusetts.
Sheily, J. 1997. Wanton EVA: Briggs & Stratton's John Shiely sets the record straight. EVAngelist 1, pp. 8–9.
Stern Stewart. 1997. EVA and Growth. EVAngelist 1, pp. 10–11.
Stewart III, G. B. 1994. EVA: Fact or fantasy? Journal of Applied Corporate Finance 7, pp. 71–84.
Wallace, J. 1997. Adopting residual income-based compensation plans: Do you get what you pay for? Journal of Accounting and Economics 24, pp. 275–300.
Young, S., and S. O'Byrne. 2001. EVA and Value-Based Management: A Practical Guide to Implementation. McGraw Hill.
Reproduced by permission of Barbara Lougee, Ashok Natarajan and James S. Wallace.

