7
Disappearing Dividends
Changing Firm Characteristics or Lower Propensity to Pay?
Eugene F. Fama and Kenneth R. French
The proportion of U.S. firms paying dividends drops sharply during the 1980s and 1990s. In 1973, the first year of complete data coverage on NYSE, AMEX, and NASDAQ firms, 52.8% of publicly traded firms (excluding utilities and financials) pay dividends. This proportion rises to 66.5% in 1978. It then falls rather relentlessly. In 1999, only 20.8% of firms pay dividends.
The decline after 1978 in the percent of firms paying dividends raises three questions: (i) What are the characteristics of dividend payers? (ii) Is the decline in the percent of payers due to a decline in the prevalence of these characteristics among publicly traded firms, or (iii) have firms with the characteristics typical of dividend payers become less likely to pay?
Three characteristics tend to affect the likelihood that a firm pays dividends: profitability, growth, and size. Larger firms and more profitable firms are more likely to pay dividends, and high-growth firms are less likely to do so. The decline after 1978 in the percent of firms paying dividends is due in part to an increasing number of small, publicly traded firms with low reported earnings and high growth. This tilt in the population of firms is driven by an explosion of newly listed firms, as well as by the changing nature of the new firms. Newly listed firms always tend to be small, with high asset growth rates and high market-to-book ratios. What changes after 1978 is their profitability. In 1973–1977, the earnings of new lists average a hefty 17.79% of book equity, versus 13.68% for all firms. The profitability of new lists falls throughout the next 20 years; their earnings average only 2.07% of book equity in 1993–1998, versus 11.26% for all firms.
This decline in profitability is accompanied by a decline in the percent of new lists that pay dividends. During 1973–1977, one-third of newly listed firms pay dividends. In 1999, only 3.7% of new lists pay dividends. The surge in and the changing nature of new lists produce a swelling group of small firms with low profitability but high growth rates that have never paid dividends.
It is perhaps obvious that investors have become more willing to hold the shares of small, relatively unprofitable growth companies. This group of firms is a big factor in the decline in the percent of firms paying dividends. But the resulting tilt of the publicly traded population toward such firms is only half of the story for the declining incidence of dividend payers. Our more striking finding is that firms in general have become less likely to pay dividends. This change, which we characterize as a lower propensity to pay, suggests that the perceived benefits of dividends have declined over time.
The lower propensity to pay is quite general. For example, the percent of payers among firms with positive earnings declines after 1978, but the percent of dividend payers among firms with negative earnings also declines. Small firms become much less likely to pay dividends after 1978, but there is also a lower incidence of dividend payers among large firms. High-growth firms become much less likely to pay dividends after 1978, but firms with fewer investment opportunities also show less inclination to pay dividends.
Share repurchases jump in the 1980s, and it is interesting to examine the role of repurchases in the declining incidence of dividend payments. It turns out that repurchases are mainly the province of dividend payers, so they leave the decline in the percent of payers largely unexplained. Instead, the primary effect of repurchases is to increase the already high payouts of cash dividend payers.
TIME TRENDS IN CASH DIVIDENDS
We begin by examining the incidence of dividend payers among NYSE, AMEX, and NASDAQ firms. We exclude utilities from the sample to avoid the criticism that their dividend decisions are a byproduct of regulation. We exclude financial firms because our data on the characteristics of dividend payers are from COMPUSTAT and COMPUSTAT's historical coverage of financial firms is spotty.
Figure 7.1 shows the total number of firms each year since 1926, as well as the number of payers and non-payers. These data are from the Center for Research in Security Prices (CRSP). Until mid-1962, CRSP covers only NYSE firms. The jumps in the total number of firms in 1963 and 1973 in Figure 7.1 are due to the addition of first AMEX and then NASDAQ firms. Swelling numbers of new listings cause the total number of firms to expand by about 40%, from 3,638 firms in 1978 to 5,113 in 1999, with a peak of 5,670 in 1997. New lists average 5.2% of listed firms (114 per year) during 1963–1977, versus 9.6% (436 per year) for 1978–1999.
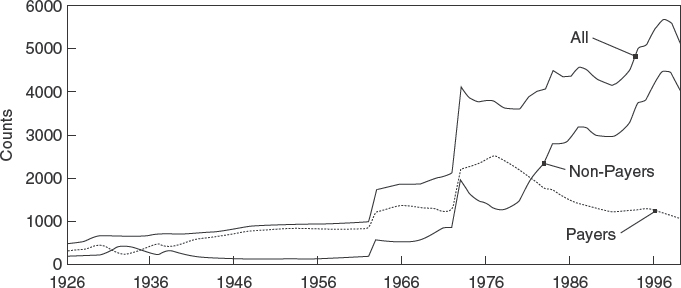
Figure 7.1 Number of firms in different dividend groups
Figure 7.2 shows that the proportion of firms paying dividends falls by half during the early years of the Great Depression, from 66.9% in 1930 to 33.6% in 1933, and then rises thereafter. In every year from 1943 to 1962, more than 82% of firms pay dividends. With the addition of AMEX firms in 1963, the proportion of dividend payers drops to 69.3%. The addition of NASDAQ firms in 1973 further lowers the proportion of payers to 52.8%, from 59.8% in 1972. The proportion of dividend payers rises to 66.5% in 1978, the peak for the post-1972 period of NYSE-AMEX-NASDAQ data coverage, and then declines sharply. In 1999, only 20.8% of firms pay dividends.
After 1977, more than 85% of new lists begin trading on NASDAQ, which might lead one to suspect that the declining incidence of dividend payers is a NASDAQ phenomenon. As Figure 7.3 shows, however, all three exchanges experience a declining incidence of dividends. The proportion of NYSE firms paying dividends drops from 88.6% in 1979 to 52.0% in 1999, a level not seen since the Great Depression. The proportions of AMEX and NASDAQ payers drop from their peaks of 63.4% and 54.1% in 1978 and 1977 to 16.9% and 8.6% in 1999. Thus, although it coincides with the explosion of NASDAQ new lists, the decline in the percent of firms paying dividends is not limited to NASDAQ.
Despite the fact that the total population of NYSE, AMEX, and NASDAQ firms grows by about 40%, the number of dividend payers shrinks by more than 50% from 1978 to 1999. There are 2,419 dividend payers in 1978 but only 1,063 in 1999 (see Figure 7.1). The rate at which dividend payers disappear from the sample (due to dividend terminations, delistings, and mergers) rises from 6.8% per year for 1963–1977 to 9.8% for 1978–1999. Most of this increase is due to mergers. The rate at which dividend payers terminate dividends remains relatively steady at 4–5% per year, consistent with previous evidence that only distressed firms (with strongly negative earnings) terminate dividends.1 Dividend payers also delist at a fairly constant rate (0.9% per year during 1978–1999 versus 0.8% for 1963–1977). In contrast, the rate at which dividend payers merge into other firms increases after 1977, from only 0.6% per year for 1927–1962 and 2.7% for 1963–1977, to 3.9% per year during 1978–1999.
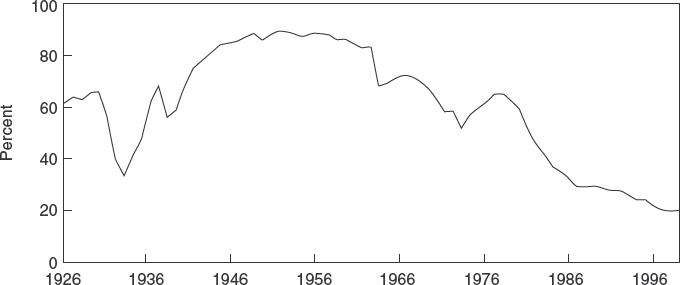
Figure 7.2 Percent of firms paying dividends
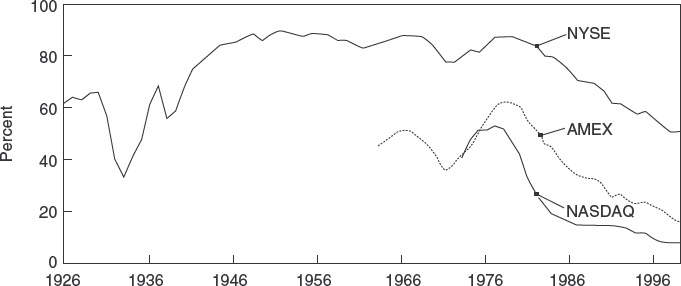
Figure 7.3 Percent of firms paying dividends
Although mergers contribute to the decline in the number of dividend payers, they are not important in the decline in the percent of payers. During the 1978–1999 period, non-payers merge into other firms at about the same rate (3.8% per year) as payers (3.9% per year), so mergers have little net effect on the percent of firms paying dividends. Delistings have a bigger impact on the percent of firms paying, but not in the direction one might expect. Non-payers delist at a higher rate (6.3% per year for 1978–1999) than payers (0.9% per year). Thus, although delistings reduce the number of firms paying dividends, they actually increase the percent of firms paying.
In the end, the decline in both the total number of dividend payers and the proportion of firms paying dividends is driven mainly by the failure of new payers to replace those that are lost. Former payers (always a relatively small group) resume dividends at an average rate of 11.8% per year during 1963–1977; this rate falls to 6.2% per year for 1978–1999 and is only 2.5% in 1999. New lists surge after 1978, but the proportion paying dividends in the year of listing declines from 50.8% for 1963–1977 to 9.0% for 1978–1999. Only 3.7% of new lists pay dividends in 1999. And the nonpaying new lists feed a swelling group of firms that never get around to paying dividends. The dividend initiation rate for firms that have never paid dividends drops from 7.1% per year for 1963–1977 to 1.8% for 1978–1999 and a tiny 0.7% for 1999. Thus, new lists that never become dividend payers are a big factor in the decline in the number of payers and, because they increase the number of sample firms, they play an even bigger role in reducing the proportion of firms paying dividends.
CHARACTERISTICS OF DIVIDEND PAYERS
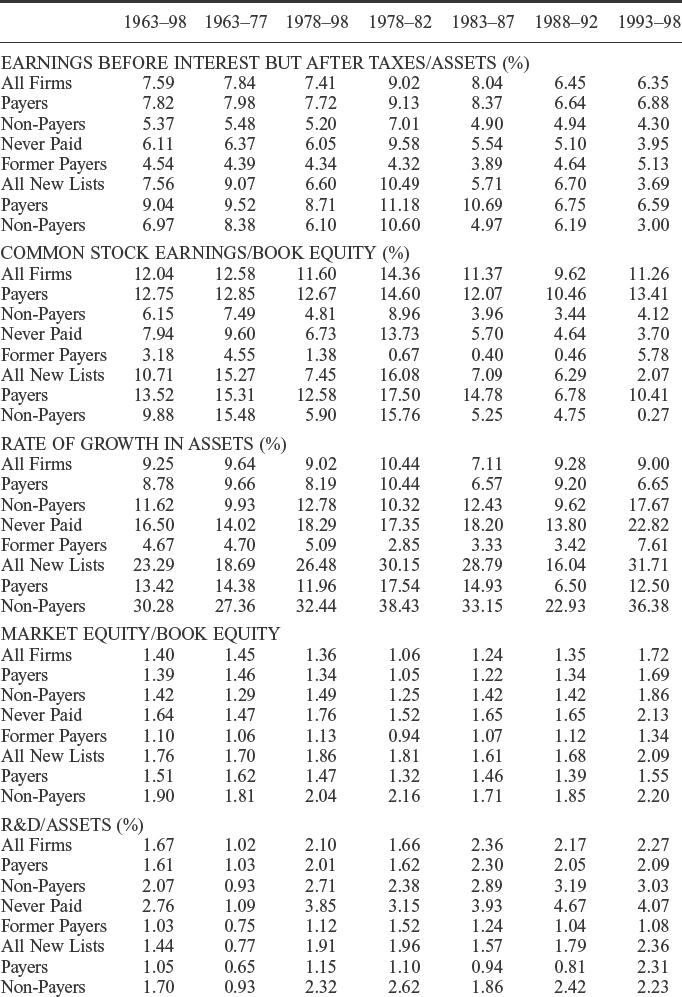
The decline in the percent of firms paying dividends raises two questions: (i) Does the population of firms drift away from the characteristics typical of dividend payers or (ii) do firms with the characteristics typical of payers become less likely to pay? We use COMPUSTAT data to answer these questions. Although the COMPUSTAT data are available for only 1963–1998, they do cover the post–1972 NYSE-AMEX-NASDAQ period and the post-1978 period of most interest to us. Table 7.1 summarizes the data.
Profitability
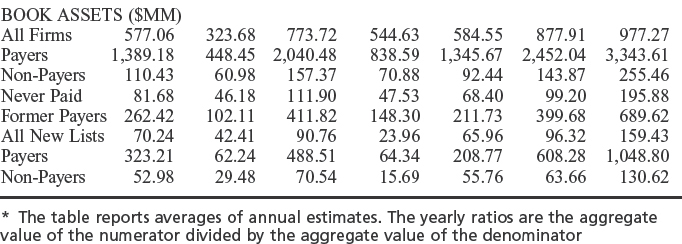
Dividend payers typically have higher measured profitability than non-payers. For the full 1963–1998 period, the ratio of aggregate earnings before interest to aggregate assets averages 7.82% per year for dividend payers versus 5.37% for non-payers. Among non-payers, this ratio averages 6.11% per year for firms that have never paid dividends and only 4.54% per year for former dividend payers.
Earnings before interest represent the payoff on a firm's assets, but earnings available for common may be more relevant for the decision to pay dividends. The gap between the profitability of payers and non-payers is even wider when profitability is measured as aggregate common stock earnings over aggregate book equity. For 1963–1998, this measure averages 12.75% for dividend payers, versus 6.15% for non-payers. Among non-payers, the average is 7.94% for firms that have never paid dividends and only 3.18% for former payers.
Low profitability becomes more common in the second half of the 1963–1998 period. Before 1982, fewer than 10% of firms have negative earnings before interest, but at least 20% of firms do after 1984. In the last three years of our COMPUSTAT period, 1996–1998, negative earnings before interest afflicts more than 30% of firms.
Many of the firms that are unprofitable later in the sample period are new listings. Until 1978, more than 90% of new lists are profitable. Thereafter, the fraction with positive earnings falls. In 1998, only 51.5% of new lists have positive common stock earnings. Before 1982, new lists – even new lists that do not pay dividends – tend to be more profitable than all publicly traded firms. After 1982, the profitability of new lists falls. The deterioration occurs as the number of new lists explodes, and it is dramatic for the increasingly large group of new lists that do not pay dividends. By 1993–1998 (when there are 511 new lists per year and only 5.2% paid dividends), the common stock earnings of newly listed non-payers average only a mere 0.27% of book equity, versus 11.26% for all firms. All three exchanges contribute to the growth of unprofitable new lists. Among firms that began trading between 1978 and 1998, 10.7% of NYSE new lists, 29.0% of AMEX new lists, and 23.6% of NASDAQ new lists have negative common stock earnings. The low profitability of new lists later in the sample period is in line with previous research on the low post-issue profitability of IPOs.2
Table 7.1 Profitability, growth, and size data for different dividend groups and for new listings*
Growth
Like profitability, opportunities for growth differ between dividend payers and non-payers. Firms that have never paid dividends have the strongest growth. Table 7.1 shows they have much higher asset growth rates for 1963–1998 (16.50% per year) than dividend payers (8.78%) or former payers (4.67%). Because the market value of a firm's stock tends to reflect its growth opportunities, we also look at ratios of the aggregate market value of assets to the aggregate book value. The average market-to-book ratio is higher for firms that have never paid dividends (1.64) than for payers (1.39) or former payers (1.10). Higher R&D expenditures also tend to be associated with firms that have stronger growth opportunities, and R&D expenditures of firms that have never paid dividends are on average 2.76% of their assets, versus 1.61% for dividend payers and 1.03% for former payers. Thus, although firms that have never paid dividends are less profitable than payers, they seem to have more growth opportunities. In contrast, former payers are victims of a double whammy – low profitability and low growth.
Newly listed firms are again of interest. Dividend-paying new lists have higher asset growth rates during 1963–1998 (13.42% per year) than do all dividend payers (8.78%), and the 1963–1998 average growth rate for nonpaying new lists – an extraordinary 30.28% per year – is almost twice as high as the 16.50% average growth rate for all firms that have never paid dividends.3
Firms that do not pay dividends are also big issuers of equity. During 1971–1998, the aggregate net stock issues of non-payers average 2.80% of the aggregate market value of their common stock, versus a trivial –0.05% for dividend payers. Dividend payers' share of gross stock issues drops from 90.4% for 1973–1977 to 35.8% for 1993–1998. Thus, firms that do not pay dividends currently account for almost two-thirds of the aggregate value of stock issues. This is not surprising, given that the non-payer group tilts increasingly toward growth firms with investment outlays greatly exceeding their earnings – the type of firm that would normally have significant financing needs.
Size
Dividend payers tend to be much larger than non-payers. During 1963–1977, the assets of payers average about seven times those of non-payers. In the non-payer group, former payers are about twice the size of firms that have never paid. In later years, as the number of firms grows and the number of payers declines, payers become even larger relative to non-payers. During 1993–1998, the assets of dividend payers average more than 13 times those of non-payers.
The aggregate earnings of dividend payers and non-payers provide more perspective on the relative size of these firms. Even during 1993–1998, when fewer than one-quarter of COMPUSTAT firms pay dividends, payers account for more than three-quarters of aggregate book and market values and all but 8.3% of aggregate earnings. The fact that dividend payers account for a large fraction of aggregate earnings (even at the end of the sample period) is, however, a bit misleading. Firms with negative earnings (mostly non-payers) become more common later in the sample period. As a result, dividend payers continue to account for a large fraction of aggregate earnings even though an increasing proportion of profitable firms, that in earlier times would have been dividend payers, are now non-payers.
Synopsis
In sum, three fundamentals – profitability, growth, and size – are factors in the decision to pay dividends. Dividend payers tend to be large, profitable firms with earnings on the order of investment outlays. Firms that have never paid dividends are smaller and they seem to be less profitable than dividend payers, but they have higher asset growth rates, higher market-to-book ratios, and higher R&D expenditures, and their investment outlays are much larger than their earnings. The salient characteristics of former dividend payers are low earnings and few investment opportunities.
Our findings on the characteristics of dividend payers and non-payers complement previous evidence that among dividend payers, larger and more profitable firms have higher payout ratios, and firms with higher growth have lower payouts.4 And all of these results are consistent with a pecking-order model of financing in which firms are reluctant to issue risky securities, and with the role of dividends in controlling the agency costs of free cash flow.5
THE PROPENSITY TO PAY DIVIDENDS
The steady decline after 1978 in the percent of firms paying dividends is due in part to the surge in the number of newly listed firms with the timeworn characteristics – small size, low earnings, and strong growth opportunities – of firms that have typically never paid dividends. But this is not the whole story. Our more interesting finding is that, no matter what their characteristics, firms in general have become less likely to pay dividends.
If the decline in the percent of dividend payers were due entirely to the changing characteristics of firms, then firms with particular characteristics would be as likely to pay dividends now as in the past. But this is not the case. In 1978, 72.4% of firms with positive common stock earnings pay dividends. In 1998, 30.0% of profitable firms pay dividends, less than half the fraction for 1978. Similarly, the proportion of dividend payers among firms with earnings that exceed investment outlays falls from 68.4% in 1978 to 32.4% in 1998. These results suggest that dividends become less common among firms with the characteristics (positive earnings and lower growth) typical of dividend payers. But firms with investment outlays that exceed earnings also become less likely to pay; the proportion paying dividends drops from 68.6% in 1978 to 15.6% in 1998. And, although dividends have never been common among unprofitable firms, these firms also become less likely to pay dividends in the 1980s and 1990s. Before 1983, about 20% of firms with negative common stock earnings pay dividends. In 1998, only 7.2% of unprofitable firms do. In short, the evidence suggests that, whatever their characteristics, firms have become less likely to pay dividends.
It is worth dwelling a bit on these findings. The surge in unprofitable nonpaying new lists causes the aggregate profitability of firms that do not pay dividends to fall in the 1980s and 1990s. But this decline in aggregate profitability hides the fact that an increasing fraction of firms with positive earnings – firms that in the past would typically have paid dividends – now choose not to pay. Similarly, for non-payers the spread of aggregate investment over aggregate earnings widens later in the sample period, again largely as a result of new lists. But an increasing fraction of firms with earnings that exceed investment – firms that in the past would typically have paid dividends – are now non-payers. In short, the surge in lower-profit, high-growth new lists causes the aggregate characteristics of non-payers to mask widespread evidence of a lower propensity to pay dividends.
To disentangle the effects of changing characteristics and changing propensity to pay on the percent of dividend payers, we use logit regressions to measure the probabilities that firms with given characteristics (size, profitability, and growth) pay dividends during 1963–1977, the 15-year period of COMPUSTAT coverage preceding the 1978 peak in the percent of dividend payers. We then apply the probabilities from the 1963–1977 base period to the sample firm characteristics observed in subsequent years to estimate the expected percent of dividend payers for each year after 1977. Since the probabilities associated with the various characteristics are fixed at their base period values, variation in the expected percent of payers after 1977 is due to the changing characteristics of sample firms. We then use the annual differences between the expected percent of payers (calculated using the base period probabilities) and the actual percent to measure the change in the propensity to pay dividends. (The details of the logit regression approach can be found in the longer version of our paper published in the Journal of Financial Economics.)
Table 7.2 shows the expected proportion of dividend payers obtained by applying the probabilities for 1963–1977 to the sample firm characteristics of subsequent years. For 1978, the expected proportion of payers is 66.9%. The actual proportion of dividend payers for 1963–1977 is 68.5%. Thus, roughly speaking, the characteristics of firms in 1978 are similar to those of the base period. The expected proportion of payers falls after 1978, reaching 52.1% in 1998. The 14.8 percentage point decline in the expected proportion of payers (from 68.5% to 52.1%) is an estimate of the effect of changing characteristics on the proportion of firms paying dividends. In other words, the decline in the expected proportion of dividend payers reflects the change in the population of publicly traded firms toward smaller, less profitable, higher-growth firms.
The difference between the actual percent of dividend payers for a given year of the 1978–1998 period and the expected percent measures changes in the propensity to pay dividends. For 1978–1980, the actual number of dividend payers is comparable to the expected number. The spread between the expected and actual percent widens thereafter. By 1998, when the base period probabilities predict that 52.1% of firms would pay dividends, only 21.3% actually do. The difference, 30.8 percentage points, between the expected and actual percents for 1998 is an estimate of the reduction in the percent of dividend payers due to a lower propensity to pay. In other words, of the total decline in the proportion of dividend payers between 1978 and 1998, roughly one-third (14.8 percentage points) is caused by the changing characteristics of publicly traded firms and two-thirds (30.8 percentage points) is caused by a reduced propensity to pay dividends.
Behavior of Dividend Payers versus Non-payers
Because there is inertia in dividend decisions, the likelihood that a dividend payer will continue to pay is higher than the likelihood that a non-payer with the same characteristics will initiate dividends. To examine how the effects of changing characteristics and changing propensity to pay differ between dividend payers and non-payers, we use separate 1963–1977 regressions for payers, former payers, and firms that have never paid to estimate the expected percents of payers in subsequent years. As shown in Table 7.2, the proportion of dividend payers expected to continue paying falls only a little, from 97.9% in 1978 to 97.0% in 1998. Thus, roughly speaking, the characteristics of dividend payers do not change much through time. Although our measure of lower propensity to pay – the difference between the expected and actual percent of payers – averages only a modest 1.2% per year, it is positive in all but one year of the 1978–1998 period. Moreover, this small decline in the propensity to pay has a nontrivial cumulative effect on the payer population: the annual spreads between expected and actual percents of payers for 1978–1998 cumulate to about 320 payers lost due to a lower propensity to pay.
Table 7.2 Estimates from logit regressions of the percent of firms expected to pay dividends each year (for all firms and grouped by dividend status)*
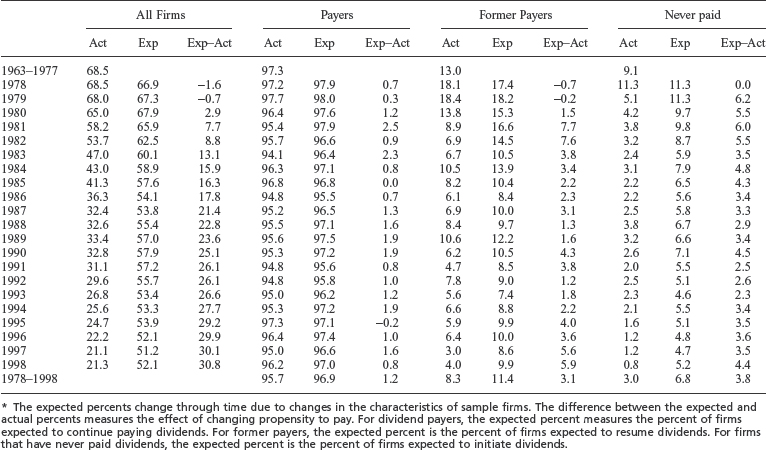
Changing characteristics and lower propensity to pay have bigger effects on the dividend decisions of former payers. When the average coefficients of the 1963–77 regressions for former payers are applied to the former payer samples of later years, the expected proportion of those resuming dividends falls (due to changes in characteristics) from 17.4% in 1978 to 9.9% in 1998. Given their characteristics, the propensity of former payers to resume dividends is also lower after 1978; the difference between expected and actual percents resuming is positive after 1979, and the average difference for 1978–98 is 3.1 percentage points. In 1998, 9.9% of former payers are expected to resume, but only 4.0% (less than half the expected number) actually do.
Changing characteristics and lower propensity to pay also have strong separate effects on the dividend decisions of firms that have never paid dividends. Changes in characteristics cause the expected proportion of dividend initiators among firms that have never paid to fall from 11.3% in 1978 to 5.2% in 1998, a decline of more than half. The consistently positive differences between the expected and actual percents of initiators after 1978 then suggest that controlling for characteristics, firms that have never paid dividends become even less likely to initiate dividends. For 1978–1998, the difference averages 3.8 percentage points (6.8% expected versus 3.0% actual). Of the 5.2% that are expected to start paying dividends in 1998, only 0.8% (less than one-sixth the expected number) actually do – rather strong evidence of a declining propensity to initiate dividends.
Portfolio Approach to Explaining the Declining Incidence of Dividends
The logit regressions summarized in Table 7.2 assume a specific functional form to model the relation between a firm's characteristics and the probability that it pays dividends. If this functional form is misspecified, our inferences may be incorrect. To confirm our results, we use a more robust portfolio approach to estimate the base period relation between firm characteristics and the likelihood that a firm pays dividends. This approach allows the base period probabilities to vary with characteristics in an unrestricted way.
For each year from 1963 to 1977, we form 27 portfolios using independent sorts on profitability, growth, and size. We sort firms into three equal groups according to profitability (low, medium, and high) and three equal groups according to growth (low, medium, and high). Instead of forming equal groups by size, however, we use the 20th and 50th percentiles of market capitalization for NYSE firms to assign NYSE, AMEX, and NASDAQ firms to portfolios. This prevents the growing population of small NASDAQ firms from changing the meaning of small, medium, and large over the sample period. (The 20th and 50th NYSE percentiles lead to similar average numbers of firms in the medium and large groups, and many more in the small group.)
We estimate the base period probabilities that firms in each of the 27 portfolios pay dividends as the sum of the number of payers in a portfolio during the 15 years of 1963–77 divided by the sum of the number of firms in the portfolio. For example, if the portfolio of firms with medium profitability, high growth, and small size has an average of 250 firms and 100 dividend payers per year in 1963–1977, then the base period probability that a firm in that portfolio pays dividends is 40%. These base period probabilities are free of assumptions about the form of the relation between characteristics and the probability that a firm pays dividends (except, of course, that all firms in a portfolio are assigned the same probability). The total number of observations (firm-years) in the base period probability estimates is always at least 45, and it is 165 or greater for all but one portfolio. The base period probabilities vary across portfolios in a familiar way – larger firms and more profitable firms are more likely to pay dividends, and higher-growth firms are less likely to pay.
We form portfolios each year after 1977 using breakpoints designed to have the same economic meaning as those of the 1963–77 base period. For profitability and investment opportunities, we assume values after 1977 are comparable to the 1963–1977 values and use the average profitability and growth breakpoints from the base period. As a result, the number of firms in each portfolio varies according to changes in the distribution of these characteristics across firms. In contrast, the size breakpoints for each year are the 20th and 50th NYSE percentiles for that year, so the proportions of firms in the three size groups vary through time with the size and number of AMEX and NASDAQ firms relative to NYSE firms.
We use the actual proportion of dividend payers in a portfolio for 1963–1977 to estimate the expected percent of payers in that portfolio for each year after 1977. Since the expected percent of payers for each portfolio is fixed, the aggregate expected percent of dividend payers varies over time only because changes in the characteristics of firms alter the allocation of firms among the 27 portfolios. Any trend in the expected percent of payers after 1977 can thus be attributed to changing characteristics. The difference between the expected percent of payers for a year and the actual percent again measures the effect of changes in the propensity to pay dividends.
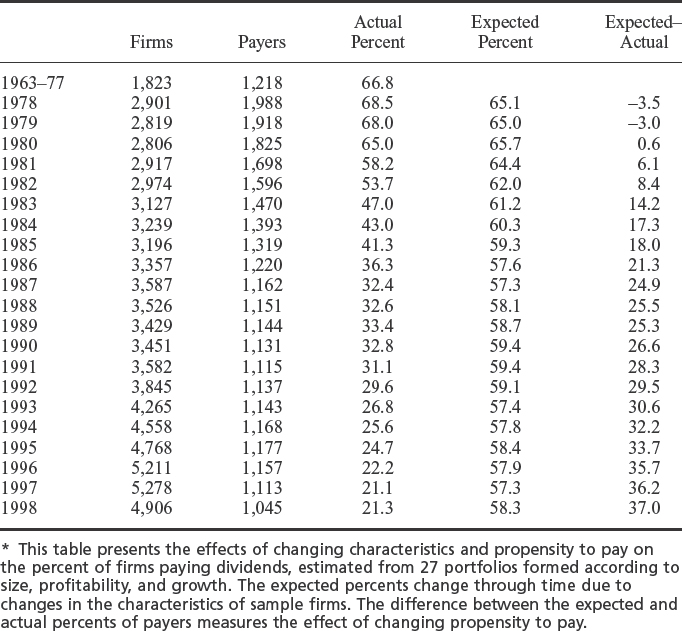
Using the portfolio approach lowers our estimate of the effect of changing characteristics on the decline in the percent of dividend payers. The expected proportion of payers falls by only 6.8 percentage points, from 65.1% in 1978 to 58.3% in 1998 (Table 7.3). Correspondingly, a greater share of the decline in the percent of payers is attributable to a lower propensity to pay. In 1978, the actual proportion of payers is 3.5 percentage points above the expected. After 1979, however, the expected percent exceeds the actual, and by increasing amounts. In 1998, 58.3% of firms are expected to pay dividends, but only 21.3% actually do. Thus, the end-of-sample shortfall in the proportion of dividend payers due to a lower propensity to pay is 37.0 percentage points.
What kinds of firms do not pay dividends in 1998 that would have paid in earlier years? The answer is – all kinds. Lower propensity to pay cuts across all size, profitability, and growth groups. Whatever their characteristics, most large firms pay dividends at the 1978 peak. The 1978 proportion of payers exceeds 85.0% in all nine large-firm portfolios, and it is above 92.0% in seven of the nine. But even among large firms, the propensity to pay declines sharply after 1978. The 1998 proportion of payers is below 80.0% for all nine large-firm portfolios, it is below 65.0% for five of the nine, and it is 40.6% or less for three large-firm portfolios.
Table 7.3 Estimates from the portfolio approach of the percent of firms expected to pay dividends each year*
The decline in the propensity to pay dividends is even greater among small firms. The 1978 proportion of dividend payers is less than 40.0% in only one of the nine small-firm portfolios and it is 52.0% or higher in seven. In contrast, the 1998 proportion of dividend payers exceeds 20.0% in only four small-firm portfolios. In the five small-firm portfolios with low profitability or high growth, dividend payers become an endangered species; the 1998 proportion of payers is 13.1% or less.
Finally, the propensity to pay declines substantially from 1978 to 1998 for firms with high growth. The large-firm portfolios provide striking examples. In 1978, 85.7%, 97.8%, and 92.4% of the firms in the three large-firm portfolios with high growth pay dividends. In 1998, only 28.4%, 40.6%, and 33.6% pay. It is clear that, like firms in the other portfolios, large rapidly growing firms no longer feel compelled to pay dividends.
SHARE REPURCHASES
Dividends have long been an enigma. Since they are taxed at a higher rate than capital gains, they are presumably less valuable than capital gains. The fact that many firms continue to pay dividends is then difficult to explain. The declining propensity to pay suggests that firms are responding to the tax disadvantage of dividends. The results in Table 7.4 are consistent with this view; share repurchases surge beginning in the mid-1980s. For 1973–1977 and 1978–1982, aggregate share repurchases average 3.37% and 5.12%, respectively, of aggregate common stock earnings. For 1983–1998, repurchases are 31.42% of earnings.6
For our purposes, however, repurchases turn out to be rather unimportant. In particular, because repurchases are primarily the province of dividend payers, they leave most of the decline in the percent of payers unexplained. Instead, repurchases primarily increase the already high cash payouts of dividend payers.
We first address a problem. Most researchers treat all share repurchases as non-cash dividends, but there are at least two important cases in which repurchases should not be viewed as a substitute for dividends: (i) repurchased stock is often reissued to employee stock ownership plans (ESOPs) or as executive stock options, and (ii) repurchased stock is often reissued to the acquired firm in a merger.7 The annual change in treasury stock is a better measure of repurchases that qualify as non-cash dividends. Treasury stock captures the cumulative effects of stock repurchases and reissues, and it is not affected by new issues of stock (seasoned equity offerings). Treasury stock data are not available on COMPUSTAT before 1982, so our first measured change is for 1983. But the treasury stock data do cover the period of strong repurchase activity. (Some firms use the retirement method, rather than treasury stock, to account for repurchases; our aggregate changes in treasury stock include the net repurchases of these firms, measured for each firm as the difference between purchases and sales of stock, when the difference is positive, and zero otherwise.)
Table 7.4 Aggregate dividends, share repurchases, share issues, and changes in treasury stock as percents of aggregate earnings and market equity*
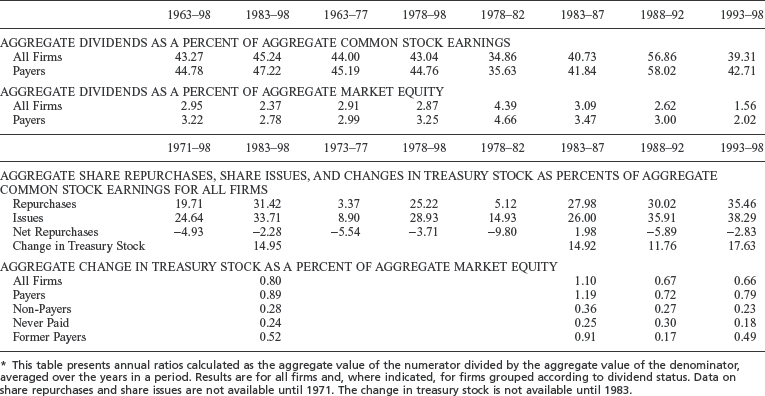
During 1983–1998, the annual change in treasury stock is 14.95% of earnings, and gross share repurchases are 31.42% of earnings. Cash dividends are 45.24% of common stock earnings, so if gross repurchases are treated as an additional payout of earnings, the total payout for 1983–1998 averages 76.66% of earnings. Substituting the more appropriate annual change in treasury stock drops the payout to (a still high) 60.19% of earnings.
Aggregate changes in treasury stock are substantial relative to aggregate earnings, but they fall far short of explaining the decline in the percent of dividend payers due to a lower propensity to pay. During 1983–1998, on average, only 14.5% of non-payers have positive changes in treasury stock. And the percent of such firms overstates the extent to which firms substitute repurchases for dividends.8 In contrast, 33.4% of dividend payers have positive changes in treasury stock. The aggregate changes in treasury stock of dividend payers average 0.89% of their aggregate market equity (versus 0.28% for non-payers). Aggregate cash dividends average 2.78% of the aggregate market equity of dividend payers during 1983–1998. Thus, dividend payers use share repurchases rather than dividends for about 25% of their payouts to shareholders.
The cash dividend payout ratio of dividend payers shows no tendency to decline. The aggregate dividends of payers are 47.22% of their aggregate common stock earnings in 1983–1998 and 42.71% in 1993–1998, versus 45.19% in 1963–1977. We infer that the large share repurchases of 1983–1998 are mostly due to an increase in the desired payout ratios of dividend payers, who are nonetheless reluctant to increase their cash dividends.
Finally, even during the 1993–1998 period, when dividend payers are only 23.6% of COMPUSTAT firms, they account for 91.7% of common stock earnings. It is thus not surprising that the aggregate payout ratio (the ratio of aggregate dividends to aggregate common stock earnings) for all firms is basically the same as the ratio for dividend payers – and likewise shows no tendency to decline over time. In fact, the aggregate payout ratio for all firms actually increases from 33.95% in 1973–1977, when 64.3% of firms pay dividends, to 39.31% in 1993–1998, when only 23.6% of firms pay dividends.9
We emphasize, however, that the aggregate payout ratio says nothing about the propensity of firms to pay dividends. As noted earlier, the surge in unprofitable, non-paying new lists in the 1980s and 1990s keeps the aggregate profits of non-payers low even though the non-payer group includes an increasing fraction of firms with positive earnings – firms that in the past would have paid dividends. As a result, the aggregate payout ratio for all firms masks widespread evidence of a lower propensity to pay dividends among individual firms of all types.
CONCLUSIONS
From a post-1972 peak of 66.5% in 1978, the proportion of dividend payers among NYSE, AMEX, and NASDAQ firms falls to 20.8% in 1999. The decline in the incidence of dividend payers is in part due to an increasing tilt of publicly traded firms toward the characteristics – small size, low earnings, and high growth – of firms that typically have never paid dividends. This change in the nature of publicly traded firms is driven by a surge in new listings after 1978 and by the changing nature of new lists, producing a swelling group of small firms with low profitability but high growth that have never paid dividends.
But the change in the characteristics of publicly traded firms only partially explains the declining incidence of dividend payers. Our more interesting result is that, whatever their characteristics, firms have simply become less likely to pay dividends.
The evidence that firms have become less likely to pay dividends, even after controlling for characteristics, suggests that the perceived benefits of dividends have declined through time. Some (but surely not all) of the reasons for this may be lower transactions costs for selling stocks (due in part to the increased use of open-end mutual funds), more sophisticated corporate governance techniques (reducing the reliance on dividends as a means of corporate discipline), and larger holdings of stock options by managers who prefer capital gains to dividends.
NOTES
1. H. DeAngelo and L. DeAngelo, “Dividend Policy and Financial Distress: An Empirical Examination of Troubled NYSE Firms,” Journal of Finance, Vol. 45, 1990, pp. 1415–1431; H. DeAngelo, L. DeAngelo, and D. Skinner, “Dividends and Losses,” Journal of Finance, Vol. 47, 1992, pp. 1837–1863.
2. B. Jain and O. Kini, “The Post-Issue Operating Performance of IPO Firms,” Journal of Finance, Vol. 49, 1994, pp. 1699–1726; W. Mikkelson, M. Partch, and K. Shah, “Ownership and Operating Performance of Companies That Go Public,” Journal of Financial Economics, Vol. 44, 1997, pp. 281–307.
3. The profitability advantage of dividend payers over firms that have never paid dividends is probably exaggerated, however, for three reasons: (i) If investments take time to reach full profitability, profitability (measured by accounting earnings as a percent of assets) is understated for growing firms. And firms that have never paid dividends grow faster than dividend payers. (ii) When R&D is a multiperiod asset, mandatory expensing of R&D causes earnings and assets to be understated. If R&D is growing, profitability is therefore understated. R&D as a percent of assets is higher for firms that have never paid dividends than for dividend payers, and this differential increases over time, from 0.32% in 1973–1977 to 1.98% in 1993–1998. (iii) Since firms that have never paid dividends grow faster, their assets are on average younger than those of dividend payers. Inflation is then likely to cause us to overstate the profitability advantage of dividend payers relative to firms that have never paid.
4. See our unpublished working paper entitled “Testing Tradeoff and Pecking Order Predictions About Dividends and Debt,” Sloan School of Management, MIT, Cambridge, MA (1999).
5. The pecking order model is developed by S. Myers and N. Majluf in “Corporate Financing and Investment Decisions When Firms Have Information the Investors Do Not Have”, Journal of Financial Economics, Vol. 13, 1984, pp. 187–221, and by S. Myers in “The Capital Structure Puzzle,” Journal of Finance, Vol. 39, 1984, pp. 575–592; see also elsewhere in this issue. The agency costs of free cash flow are addressed in M. Jensen, “Agency Costs of Free Cash Flow, Corporate Finance, and Takeovers,” American Economic Review, Vol. 76, 1986, pp. 323–329.
6. In their paper entitled “Cash Distributions to Shareholders,” Journal of Economic Perspectives, Vol. 3, 1989, pp. 129–149, L. Bagwell and J. Shoven argue that the increase in repurchases indicates that firms have learned to substitute repurchases for dividends in order to generate lower-taxed capital gains for stockholders. But subsequent tests of this hypothesis produce mixed results; see DeAngelo, DeAngelo, and Skinner (2000), cited earlier; M. Jagannathan, C. Stephens, and M. Weisbach, “Financial Flexibility and the Choice Between Dividends and Stock Repurchases,” Journal of Financial Economics, Vol. 57, 2000, pp. 355–384; and G. Grullon and R. Michaely, “Dividends, Share Repurchases, and the Substitution Hypothesis,” unpublished manuscript, Cornell University, Ithaca, NY (2000).
7. In their article entitled “Dividend Policy,” in Handbooks in Operations Research and Management Science: Finance, edited by R. Jarrow, V. Maksimovic, and W. Ziemba (Amsterdam: North-Holland, 1995, pp. 793–838), F. Allen and R. Michaely show that the surge in repurchases after 1983 lines up with a surge in mergers.
8. Consider a firm that repurchases shares in one fiscal year and reissues them as part of an ESOP, executive compensation plan, or merger in the next. Because the repurchase and reissue are spread across two fiscal years, they cause a positive change in treasury stock in the first year and a negative change in the second. Although the repurchase just accommodates a reissue, a simple count of firms with positive changes in treasury stock misclassifies the repurchase as a substitute for a cash dividend. On average, 6.9% of non-payers have negative changes in treasury stock during 1983–1998. The results for 1993–1998 are similar; 14.5% of non-payers have positive changes in treasury stock and 6.6% have negative changes.
9. This is consistent with the results in A. Dunsby, “Share Repurchases, Dividends, and Corporate Distribution Policy,” Ph.D. thesis, The Wharton School, University of Pennsylvania, Philadelphia, PA (1995).
Reproduced from Journal of Applied Corporate Finance, Vol. 14 No. 1 (Spring 2001), pp. 67–79.
