
3.3 Spatial hearing basics
In the previous section, it was described how various stages of the auditory system respond to ITDs, ILDs and their resemblance to the cross-correlation function. In this section, the relation between physical attributes of sound sources and these localization cues will be described.
3.3.1 Spatial hearing with one sound source
The simplest listening scenario is when there is one sound source in free-field. Free-field denotes an open space with no physical objects from which sound is reflected. Anechoic chambers are rooms frequently used for experimentation under free-field-like conditions. Due to their highly sound absorbent walls there are virtually no reflections, similarly to free-field. Localization denotes the relation between the location of an auditory object and one or more attributes of a sound event. A sound event denotes sound sources and their corresponding signals responsible for the perception of the auditory object. For example, localization may describe the relation between the direction of a sound source and the direction of the corresponding auditory object. Localization blur denotes the smallest change in one or more attributes of a sound event such that a change in location of the auditory object is perceived. For sources in the horizontal plane, localization blur with respect to direction is smallest for sources in the forward direction of a listener. It is slightly larger for sources behind the listener and largest for sources to the sides. In other words, the precision with which a listener can discriminate the direction of a source in the horizontal plane is best if the source is in the front and worst if a source is on the side.
In order to understand how the auditory system discriminates the direction of a source, the properties of the signals at the ear entrances have to be considered, i.e. the signals available to the auditory system. Most generally, the ear input signals can be viewed as being filtered versions of the source signal. The filters modeling the path of sound from a source to the left and right ear entrances are commonly referred to as head-related transfer functions (HRTFs). Figure 3.2(a) illustrates the left and right HRTFs, h1 and h2, for a source at angle ϕ. For each source direction different HRTFs need to be used for modeling the ear entrance signals. A more intuitive, but only approximately valid view for the relation between the source angle ϕ and the ear entrance signals is illustrated in Figure 3.2(b). The difference in length of the paths to the ear entrances, d2 − d1, can be expressed as a function of the source angle ϕ. As a result of the different path lengths, there is a difference in arrival time between both ear entrances. The most simple formula for the difference in path length between the left and right ear is the ‘sine law’ for spatial hearing as proposed by von Hornbostel and Wertheimer [266],
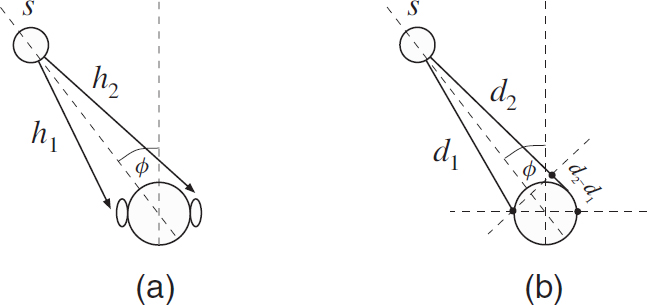
Figure 3.2 (a) Paths of a source to the ear entrances modeled with HRTFs; (b) a more intuitive view relates the source angle to a path distance difference resulting in an arrival time difference at the ear entrances. Additionally, head shadowing results in an intensity difference between the ear entrance signals as a function of the source angle.
![]()
where κ is the distance of the two microphones modeling the two ear entrances. Since the effect of the curved path around the head is ignored, κ is chosen larger than the actual distance between the ears. Another limitation of the sine law is that head shadowing is ignored, i.e. the effect of the head on the intensities of the ear entrance signals is not considered. Several improved formulas were introduced to account for the curved path of sound around the head. An overview of different path length difference formulas has been given by Blauert [26].
As a result of the path length difference from the source to the two ear entrances, there is a difference in arrival times of sound at the left and right ears, denoted interaural time difference (ITD). Note that the physiologically relevant range of ITD is about ±1 ms. This range is related to distance between the ears, by e.g. (3.1), and the resulting physically possible range of ITDs.
Additionally, the shadowing of the head results in an intensity difference of the left and right ear entrance signals, denoted interaural level difference (ILD). For example, a source to the left of a listener results in a higher intensity of the signal at the left ear than at the right ear.
Diffraction, reflection, and resonance effects caused by the head, torso, and the external ears of the listener result in that ITD and ILD not only depend on the source angle ϕ, but also on the source signal. Nevertheless, if ITD and ILD are considered as a function of frequency, it is a reasonable approximation to say that the source angle solely determines ITD and ILD as implied by data shown by Gaik [90]. When only considering frontal directions (−90° ≤ ϕ ≤ 90°) the source angle ϕ approximately causally determines ITD and ILD. However, for each frontal direction there is a corresponding direction in the back of the listener resulting in a similar ITD–ILD pair. Moreover, if only ITDs are considered, a cone of positions exist with virtually equal ITDs at all positions of the cone. This concept is referred to as the cone of confusion. Thus, the auditory system needs to rely on other cues for resolving this front/back ambiguity. Examples of such cues are head movement cues, visual cues, and spectral cues (different frequencies are emphasized or attenuated depending on the elevation of a sound source) [26].
3.3.2 Ear entrance signal properties and lateralization
The previous discussion implies that ITD and ILD are ear entrance signal properties which provide to the auditory system information about the direction of a sound source in the horizontal plane. A specific ITD–ILD pair can be associated with the source direction (when disregarding the front/back ambiguity). With headphones, the ear entrance signals are (ideally) equal to the signals given to the left and right transducers of the headphones. Therefore, it is possible to evaluate the effect of ITD and ILD independently of each other with experiments carried out with headphones. Figure 3.3 shows an experimental setup for generating coherent left and right ear entrance signals, e1(n) and e2(n), given a single audio signal s(n). ITD is determined by the delays and equal to d2 − d1 and ILD is determined by the scale factors a1 and a2, and expressed in dB is 20 log10(a2/a1).
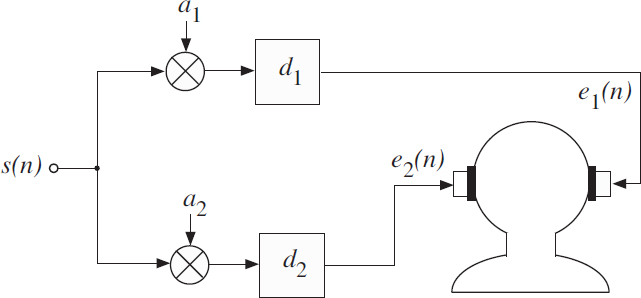
Figure 3.3 Experimental setup for generating coherent left and right ear entrance signals with specific ITD and ILD.
Figure 3.4(a) illustrates perceived auditory objects for different ITD and ILD [26, 107, 229, 284] for two coherent left and right headphone signals, as generated by the scheme shown in Figure 3.3. When left and right headphone signals are coherent, have the same level (ILD = 0), and no delay difference (ITD = 0), an auditory object appears in the center between the left and right ears of a listener. More specifically, the auditory object appears in the center of the frontal section of the upper half of the head of a listener, as illustrated by Region 1 in Figure 3.4(a). By increasing the level on one side, e.g. right, the auditory object moves to that side as illustrated by Region 2 in Figure 3.4(a). In the extreme case, when only the signal on the left is active, the auditory object appears at the left side as illustrated by Region 3 in Figure 3.4(a). ITD can be used similarly to control the position of the auditory object. For headphone playback, a subject's task is usually restricted to identifying the lateral displacement of the projection of the auditory object to the straight line connecting the ear entrances. The relationship between the lateral displacement of the auditory object and attributes of the ear entrance signals is denoted lateralization.
So far, only the case of coherent left and right ear input signals was considered. Another ear entrance signal property that is considered in this discussion is a measure for the degree of ‘similarity’ between the left and right ear entrance signals, denoted interaural coherence (IC). IC here is defined as the maximum value of the normalized cross-correlation function,
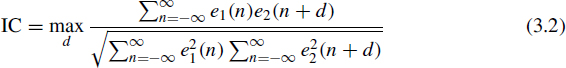
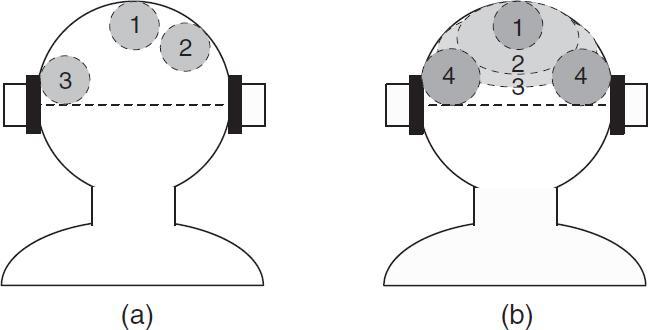
Figure 3.4 (a) ILD and ITD between a pair of headphone signals determine the location of the auditory object which appears in the frontal section of the upper head; (b) the width of the auditory object increases (1–3) as the interaural coherence (IC) between the left and right headphone signals decreases, until two distinct auditory objects appear at the sides (4).
where delays d corresponding to a range of ±1 ms are considered, which is the physiologically plausible range for ITD, as discussed in Section 3.3.1. IC as defined has a range between zero and one. IC = 1 means that two signals are coherent (signals are equal with possibly a different scaling and delay) and IC = 0 means that the signals are independent. IC may also be defined as the signed value of the normalized cross-correlation function with the largest magnitude, resulting in a range of values between minus one and one. A value of minus one then means that the signals are identical, but with a different sign (phase inverted).
When two identical signals (IC = 1) are emitted by the two transducers of the headphones, a relatively compact auditory object is perceived. For wideband signals the width of the auditory object increases as the IC between the headphone signals decreases until two distinct auditory objects are perceived at the sides, as illustrated in Figure 3.4(b) [58].
Conclusively, one can say that it is possible to control the lateralization of an auditory object by choosing ITD and ILD. Furthermore, the width of the auditory object is related to IC.
3.3.3 Sound source localization
The usual result of lateralization experiments is that the auditory objects are perceived inside the head, somewhere between the left and right ear. One of the reasons for the fact that these stimuli are not externalized is that the single frequency-independent ILD or ITD is a poor representation of the acoustical signals in the free field. The waveforms of sound sources in the real world are filtered by the pinna, head and torso of the listener, resulting in an intricate frequency dependence of the ITD and ILD. For the ILD, this frequency dependence is visualized in Figure 3.5. The ILD fluctuates around zero for an azimuth of zero. For increasing azimuth, the ILD tends to increase as well. However, this increase is stronger at high frequencies than at low frequencies. This is caused by the fact that the acoustic shadow of the head is more effective for shorter wavelengths (i.e., higher frequencies).
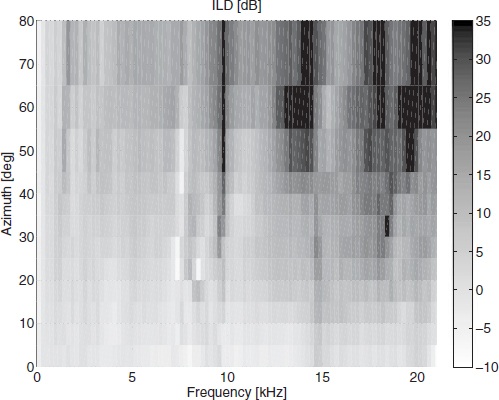
Figure 3.5 Interaural level difference as a function of frequency for various azimuth angles.
The observation that ILDs vary stronger with position at high frequencies than at low frequencies, and the fact that human subjects are sensitive to ITDs as well, resulted in the duplex theory formulated by Lord Rayleigh in 1907 [251]. This theory states that sound source localization is facilitated by interaural level differences at high frequencies and by interaural time differences at low frequencies.
Besides causing a frequency dependence of the ITD and ILD cues, reflections and diffraction also result in pronounced notches and peaks in the signal spectra themselves [272]. These specific properties of the magnitude spectra facilitate sound source localization in the vertical plane. The frequencies at which these features occur depend on the elevation of the sound source. This is visualized in Figure 3.6. The magnitude spectrum in dB is given as a function of the elevation of a sound source in the front of the listener (azimuth = 0°). Especially for frequencies above approximately 8 kHz, differences in the magnitude spectrum of up to 30 dB can occur, depending on the elevation.
Due to differences in the shape of individual heads and ears, the exact spectral features in HRTF spectra differ from individual to individual. When positioning sound sources by HRTF convolution, it is therefore important to apply individual HRTFs. If individual HRTFs are used, subjects are not able to discriminate between real and virtual sound sources presented over headphones [115, 177, 273]. If non-individualized HRTFs are used, however, subjects report poor elevation accuracy and front–back confusions [271, 275]. Some attempts have been made to increase localization performance with non-individualized HRTFs by emphasizing the pinna effects [288] or the interaural differences [73].
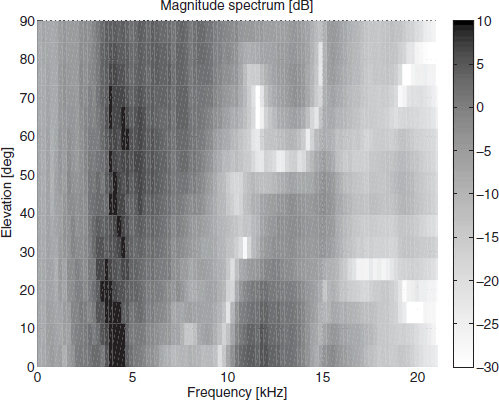
Figure 3.6 HRTF magnitude spectrum as a function of the elevation of a sound source at zero degrees azimuth.
So far, only elevation and azimuth were considered, but there is evidence that spatial cues also depend on the distance of a sound source [53, 240], especially for close-range positions.
3.3.4 Two sound sources: summing localization
Spatial hearing with two sound sources has a high practical relevance because stereo loudspeaker listening depends on perceptual phenomena related to two sound sources (the two sources are the two loudspeakers in this case). Also for multi-channel loudspeaker listening the two-source case is relevant since it is based on similar phenomena.
Previously, the ear entrance signal properties ITD and ILD were related to source angle. Then the perceptual effect of ITD, ILD, and IC cues was discussed. For two sources at a distance (e.g. loudspeaker pair), ITD, ILD, and IC are determined by the HRTFs of both sources and by the specific source signals. Nevertheless, it is interesting to assess the effect of cues similar to ITD, ILD, and IC, but relative to the source signals and not ear entrance signals. To distinguish between these same properties considered either between the two ear entrance signals or two source signals, respectively, the latter are denoted inter-channel time difference (ICTD), inter-channel level difference (ICLD), and inter-channel coherence (ICC). For headphone playback, ITD, ILD, and IC are (ideally) the same as ICTD, ICLD, and ICC. In the following a few phenomena related to ICTD, ICLD, and ICC are reviewed for two sources located in the front of a listener.
Figure 3.7(a) illustrates the location of the perceived auditory objects for different ICLD for two coherent source signals [26]. When left and right source signals are coherent (ICC = 1), have the same level (ICLD = 0), and no delay difference (ICTD = 0), an auditory object appears in the center between the two sources, as illustrated by Region 1 in Figure 3.7(a). By increasing the level on one side (hence employing the concept of amplitude panning, see Chapter 2), e.g. right, the auditory object moves to that side, as illustrated by Region 2 in Figure 3.7(a). In the extreme case, when only the signal on the left is active, the auditory object appears at the left source position as is illustrated by Region 3 in Figure 3.7(b). ICTD can be used similarly to control the position of the auditory object (i.e., time panning is employed). This principle of controlling the location of an auditory object between a source pair is also applicable when the source pair is not in front of the listener. However, some restrictions apply for sources to the sides of a listener [211, 256]. There is an upper limit for the angle between such a source pair beyond which localization of auditory objects between the sources degrades.
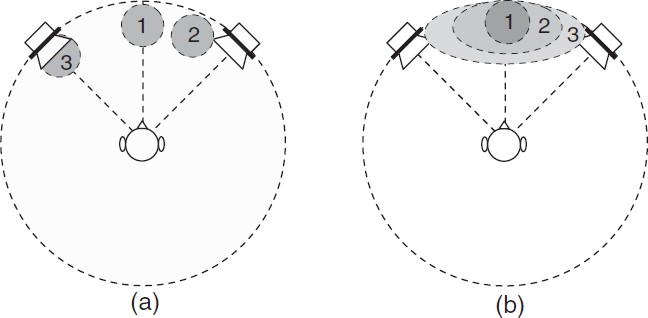
Figure 3.7 (a) ICTD and ICLD between a pair of coherent source signals determine the location of the auditory object which appears between the two sources; (b) the width of the auditory object increases (1–3) as the IC between left and right source signals decreases.
When coherent wideband signals (ICC = 1) are simultaneously emitted by a pair of sources, a relatively compact auditory object is perceived. When the ICC is reduced between these signals, the width of the auditory object increases [26], as illustrated in Figure 3.7(b). The phenomenon of summing localization, e.g. an auditory object appearing between a pair of frontal loudspeakers, is based on the fact that ITD and ILD cues evoked at the ears crudely approximate the dominating cues that would appear if a physical source were located at the direction of the auditory object. The mutual role of ITDs and ILDs is often characterized with time–intensity trading ratios [26] or in the form of the classic duplex theory [251]: ITD cues dominate localization at low frequencies and ILD cues at high frequencies. The relevance of ITD and ILD cues as a function of frequency is illustrated in Figure 3.8.
The insight that when signals with specific properties are emitted by two sources the direction of the auditory object can be controlled is of high relevance for applications. It is this property, which makes stereo audio playback possible. With two appropriately placed loudspeakers, the illusion of auditory objects at any direction between the two loudspeakers can be generated. (More on this topic is discussed in Section 2.2).
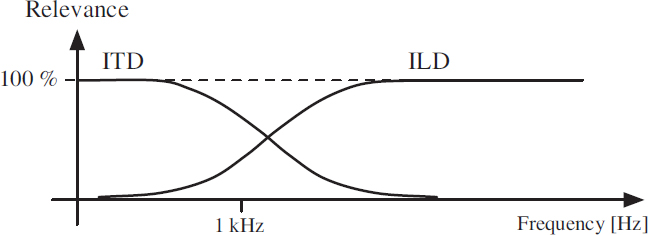
Figure 3.8 The duplex theory states that ITD dominate localization at low frequencies and ILD at high frequencies. The transition between ITD and ILD dominance is about 1–2 kHz.
Another relevance of these phenomena is that for loudspeaker playback and headphone playback similar cues can be used for controlling the location of an auditory object. This is the basis, which makes it possible to generate signal pairs which evoke related illusions in terms of relative auditory object location for both loudspeaker and headphone playback. If this were not the case, there would be a need for different signals, depending on whether a listener uses loudspeakers or headphones.
3.3.5 Superposition of signals each evoking one auditory object
Above, only phenomena were described where a single auditory object appears. However, an auditory spatial image often consists of a number of auditory objects distributed in (perceived) space. Consider the case of two independent sound sources. In this context, independent sources denote independent signals, e.g. different speech signals or instruments. Over a short period of time (e.g. 20 ms) such signals may be correlated, but when observed over a sufficiently long period of time (e.g. a few seconds) such signals are statistically independent. When one source emits a signal, a corresponding auditory object is perceived at the direction of that source (left scenario in Figure 3.9). When another independent source at a different location emits a signal, another corresponding auditory object is perceived from the direction of that second source (middle scenario in Figure 3.9). When both sources emit their independent signals simultaneously, usually two auditory objects are perceived from the two directions of the two sources, in which the position of each source independently is determined by ICLD and ICTD parameters. From the linearity property of HRTFs it follows that in the latter scenario the ear entrance signals are equal to the sum of the two ear entrance signals of the two one-active-source scenarios (as indicated in the right scenario in Figure 3.9). More generally speaking, the sum of a number of ear entrance signals associated with independent sources usually results in distinct auditory objects for each of the sources. In many cases, the directions of the resulting auditory objects correspond to the directions of the sources.
This perceptual feature is not only a remarkable ability of the auditory system, but also a necessity for formation of auditory spatial images corresponding to the physical surroundings of a listener. In Section 3.6, a model is described aiming at explaining this phenomenon, i.e. how the auditory system is able to localize sources given the complex mix of signals at the ear entrances in multi-source scenarios.
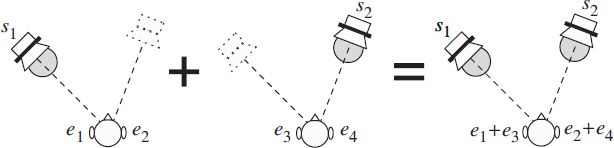
Figure 3.9 When two independent sources are concurrently active (right), usually two auditory objects appear at the same directions where auditory objects appear for each source emitting a signal individually (left and middle).
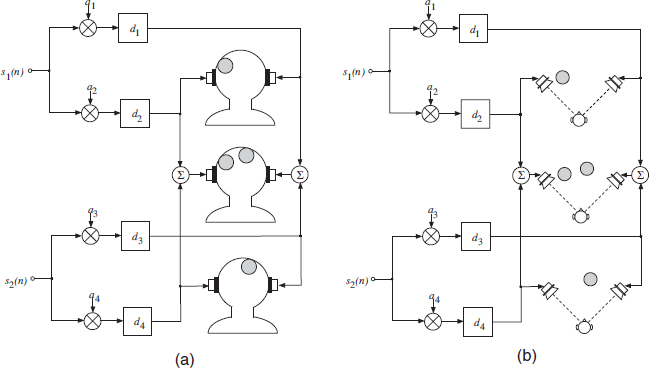
Figure 3.10 By adding two different pairs of signals corresponding to single auditory objects, the composite signal pair usually results in two auditory objects at the same locations as the auditory objects corresponding to each signal pair for (a) headphone playback and (b) loudspeaker playback.
The principle described for the superposition of ear entrance signals also holds for signal pairs generated as illustrated in Figure 3.3. For example, if a number of such signal pairs are generated for different independent base signals, then the composite signal pair usually results in perceived auditory objects at the locations of the auditory objects appearing when the signal pairs are played back separately. From the linearity property of HRTFs this follows not only for headphone playback, but also for two sources emitting these signals. This property is illustrated for headphones and sources in Figure 3.10(a) and (b), respectively. Mixing techniques for generating stereo signals given a multitrack recording (separately recorded instruments) are based on the described principle.