
7.5 Single ITD approximation
In the previous experiments, the phase difference between corresponding HRTF pairs was parameterized as a frequency-dependent property. From physical considerations, it is likely that the inter-aural phase characteristic closely mimics a linear phase (delay) behavior, with some small deviations (see Figure 7.2). In the current experiment, we investigate whether the linear-phase approximation is feasible in combination with parameterized HRTF spectra. In other words, the frequency-dependent interaural phase parameters are reduced to a single inter-aural time delay (ITD) parameter for each sound source position.
7.5.1 Procedure
Given the dominance of low frequencies in ITD-based sound source localization, the ITD for a specific HRTF pair was estimated from the low-frequency part only (i.e. from 0 to 1.5 kHz). The ITD parameter was estimated by minimizing the L2 norm of the inter-aural phase error within the specified frequency range (see [202] for details). The resulting ITD was subsequently used to generate the HRTF phase spectra by computing the corresponding phase difference at the center frequencies of each parameter band. HRTF analysis and synthesis was performed using overlapping parameter bands at a fixed spectral resolution of 1 ERB (w = 1).
Since the objective of this test was to investigate potential audibility of a linear-phase approximation, no adaptive measurement procedure was employed. Instead, subjects were presented with three intervals. One of these intervals contained a noise burst processed with a parameterized, linear-phase HRTF, while the two other intervals were convolved with the original, unmodified HRTFs. Subjects had to indicate the odd one out in a series of 30 trials for each of the 9 spatial positions. As a control condition, the same experiment was employed with a frequency-dependent phase parameterization (denoted by ‘nonlinear phase’). The various sets of 30 trials for 9 positions and the two different conditions were presented in random order.
7.5.2 Results and discussion
The average (pooled across subjects) percentage correct responses for the nine different sound source positions are shown in Figure 7.6. The circles represent the linear-phase parameterization and the crosses denote the control condition using frequency-dependent phase parameters. The error bars denote the standard deviation of the mean (across subjects). The dashed vertical line represents the expected percentage correct based on chance; the dotted lines represent the corresponding 95% confidence interval.
The results indicate that for most positions, the linear-phase approximation method (circles) resulted in response rates of about 30–40% correct. This also holds for the control condition (squares). Furthermore, for most positions the inter-subject variability (represented by the error bars) is relatively constant. The only exception is position 4. For this position, the linear-phase approximation resulted in statistically significant higher correct responses than what one would expected based on pure guessing. This result is not observed for the control condition (crosses).
These results indicate that for most positions, the frequency-dependent phase parameters can be reduced to a single ITD parameter without significant perceptual consequences. The one exception is position 4. For this position, subjects had a score that is statistically significantly different from what one would expect based on chance. This effect is not observed for the corresponding control condition, which indicates that subjects indeed used the different inter-aural phase cues for detecting the target. However, despite the statistical significance, the mean score for position 4 is still quite low (around 45% correct), which indicates that the cue that subjects used is quite weak.
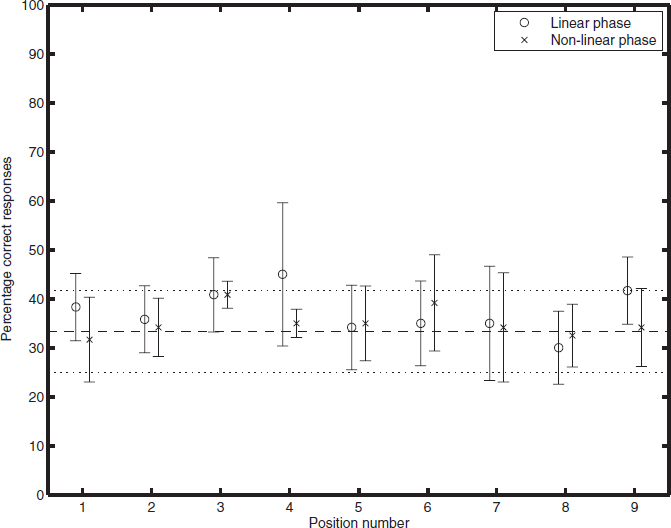
Figure 7.6 Average percentage of correct responses for nine different sound source positions. The circles correspond to the linear-phase approximation; the crosses to the frequency-dependent (nonlinear) phase method. Error bars denote the standard deviation across subjects. The dashed lines represent the 95% confidence intervals based on chance.