
10.5 Subjective evaluation
Informal listening indicated that the scheme described here offers a benefit over conventional stereo playback, especially for off-sweet-spot listening. The goal for the subjective test was not to gain specific psychophysically interesting data, but to get some evidence that the scheme is preferred by listeners compared with conventional stereo playback.
10.5.1 Subjects and playback setup
Eight subjects participated in the tests. Six of these subjects had already participated in the past in subjective tests for audio quality evaluation. The subjects all had an age between 26 and 37 years and reported normal hearing. The test was carried out in a sound insulated room mimicking a typical living room. For audio playback a laptop computer (Apple PowerBook G4) was used with an external D/A converter (MOTU 896) connected directly to eight active loudspeakers (Genelec 1029A).
The loudspeakers were arranged in front of the subject, as illustrated in Figure 10.14. All loudspeakers were always switched on and the subjects had no explicit knowledge from which loudspeakers sound was emitted.
10.5.2 Stimuli
Eleven different stereo music clips were selected. The clips were obtained from CDs and were of lengths between 10 and 15. In order to demonstrate that the described scheme performs well for audio material which is encoded with a typical audio coder, the clips were encoded using MP3 [40] at 192 kb/s. The MP3 encoder integrated with Apple QuickTime 6 was used.
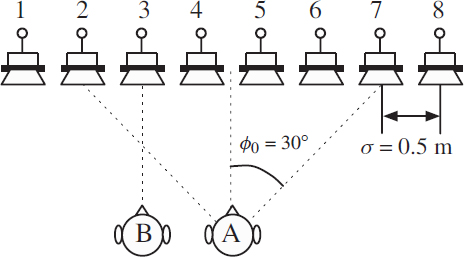
Figure 10.14 A subjective test was carried out with a loudspeaker setup as shown.
Three of the clips were used as training items and the other eight clips were used in the test. The clips contained classical, jazz, rock/pop, and latin music.
Each of the clips was processed to generate two types of eight-channel stimuli. One stimulus type, denoted standard stereo (SS), emits the stereo signal out of loudspeakers 2 and 7, mimicking a standard stereo configuration. The second type of stimulus, denoted front array (FA), is processed according to Equation (10.27) such that the virtual sound stage is reproduced with loudspeakers 2–7 and plane waves with angles ±40° are reproduced with loudspeakers 1–8.
10.5.3 Test method
Each subject conducted the test twices, directly after each other, with a different listening position. The two listening positions are indicated as A and B in Figure 10.14. In position A, the subject was located centered such that loudspeakers 2–7 formed a standard stereo listening setup with ϕ0 = 30°. In position B, the subject was more to the side, i.e. at the lateral position of loudspeaker 3. It was indicated to the listeners that the virtual stage ranges from loudspeakers 2–7.
The subjects were asked to grade different specific properties and the overall audio quality of the processed clips. For each corresponding stimulus pair, SS and FA, one stimulus had to be graded relative to the other one (reference), where either SS or FA was with 50% chance declared to be the reference. Randomization in term of declaring SS or FA as the reference and the ordering of the clips was carried out for each subject individually. The three different grading tasks of the test are summarized in Table 10.1. Task 1 assesses the quality of the virtual sound stage. Task 2 evaluates distortions introduced by the processing that are not related to the spatial aspect of sound. Task 3 assesses the overall audio quality. Note that for all three tasks the ITU-R 7-grade comparison scale [149], shown in Table 10.2, was used.
Before the test, the subject was given written instructions. Then, a short training session with three clips was carried out, followed by the two tests (listener in position A and B) containing the eight clips listed in Table 10.3.
Table 10.1 Tasks and scales of the subjective test.
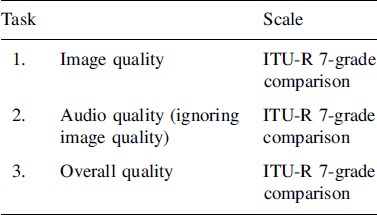
Table 10.2 The ITU-R 7-grade comparison scale for comparing an item A with a reference item R.
| 3 | A much better R |
| 2 | A better R |
| 1 | A slightly better R |
| 0 | A same R |
| -1 | A slightly worse R |
| -2 | A worse R |
| -3 | A much worse R |
Table 10.3 The eight music clips used for the test.
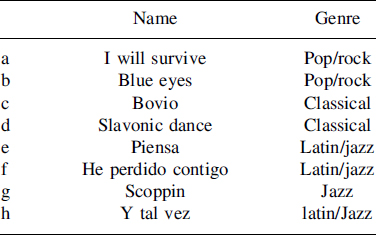
Figure 10.15 illustrates the graphical user interface that was used for the test. The subject was presented with (frozen) sliders for the reference and for the corresponding other stimulus. With the ‘Play’ buttons the subject could listen to either the reference or corresponding other stimulus. The subject could switch between the stimuli at any time, while the sound instantly faded from one type of stimulus to the other. Informal listening indicated that such instant switching greatly facilitates comparison of the spatial attributes of the stimuli.
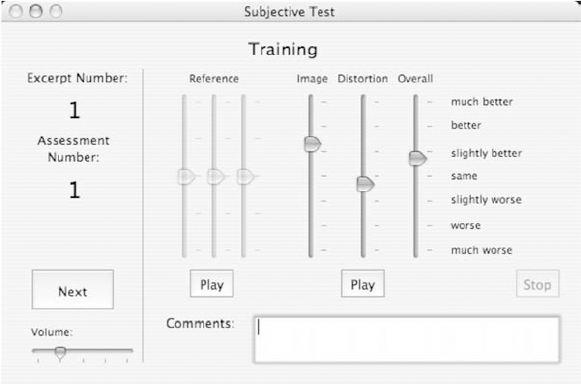
Figure 10.15 The graphical user interface used for the test. The left three (frozen) sliders correspond to the reference and the right three sliders to the corresponding other stimulus.
The duration of the test session (test in Position A, test in Position B) varied between the listeners due to the freedom to repeat the stimuli as often as requested. Typically the test duration was between 30 and 50 minutes.
10.5.4 Results
Figure 10.16 shows the results of the tests with the subjects located at listening position A (sweet spot). The letters indicated on the x-axis correspond to the specific clip labels given in Table 10.3. The grading scale on the y-axis corresponds to the comparison scale given in Table 10.1, where positive gradings indicate that FA (described scheme) is better than SS (standard stereo). The left panel shows the gradings and 95% confidence intervals for each clip, averaged for all subjects. The right panel shows the results averaged for all clips and subjects. The gradings are shown for the attributes image quality, distortion, and overall quality. The image quality indicates that the subjects preferred the virtual sound stage of the described scheme. The distortion, in most cases close to zero, indicates that the scheme described introduces relatively few distortions if at all. The subjects preferred the described scheme, as is implied by the positive overall quality gradings.
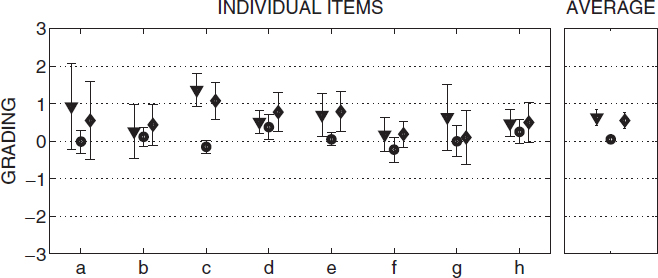
Figure 10.16 The subjective test results for the subjects in position A (sweet spot). The grading and 95% confidence intervals for each clip averaged over all subjects (left) and overall average gradings (right) are shown (triangle = image quality, circle = distortion, diamond = overall quality). Positive gradings indicate that FA is better than SS.
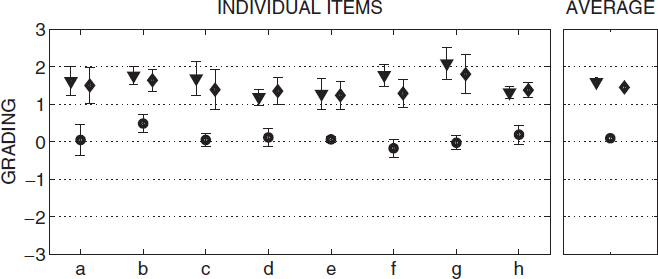
Figure 10.17 The subjective test results for the subjects in position B (off-sweet-spot). The grading and 95% confidence intervals for each clip averaged over all subjects (left) and overall average gradings (right) are shown (triangle = image quality, circle = distortion, diamond = overall quality). Positive gradings indicate that FA is better than SS.
The results for the test with the subjects in the off-sweet-spot position, B, are shown in Figure 10.17. The conclusions here are similar, only that the degree of improvement compared with stereo is significantly larger, as expected, since the virtual stage for stereo with a listener not in the sweet spot is degraded.