


Fabric Vision
Fabric Vision functionality is part of the Gen 5 Fibre Channel technology. Fabric Vision provides rich set of tools that provides extra management, monitoring, and diagnostic tools.
This chapter includes the following sections:
7.1 Fabric Vision
IBM b-type Fabric Vision technology is an advanced hardware and software architecture. It combines capabilities from Fabric Operating System (FOS), b-type Gen 5 devices, and IBM Network Advisor to help administrators address problems before operations are affected and accelerate new application deployments.
The Fabric Vision license includes support for Flow Vision, Monitoring Alerting Policy Suite (MAPS), Clear Link Diagnostic Port, Fabric Watch, and Advanced Performance Monitoring. Switches with Fabric Watch (FW) and Advanced Performance Monitoring (APM) licenses automatically obtain FOS V7.2.x Fabric Vision license features simply by upgrading to FOS V7.2.x.Switches with only FW or APM can upgrade to Fabric Vision by purchasing other licenses.
Fabric Vision technology includes the following features:
•ClearLink diagnostic tests: Ensure optical and signal integrity for Gen 5 Fibre Channel optics and cables.
•Credit Loss Recovery: Helps overcome performance degradation and congestion due to buffer credit loss.
•Bottleneck Detection: Identifies and alerts administrators to device or ISL congestion, and abnormal levels of latency in the fabric. This feature works with Brocade Network Advisor to automatically monitor and detect network congestion and latency in the fabric.
•Monitoring, Alerting, and Performance Suite (MAPS): Provides a new, easy-to-use solution for policy-based threshold monitoring and alerting. MAPS proactively monitors the health and performance of the SAN infrastructure to ensure application uptime and availability. By utilizing both pre-built rules and policy-based templates, MAPS simplifies fabric-wide threshold configuration, monitoring, and alerting. Administrators can configure the entire fabric (or multiple fabrics) at one time by using common rules and policies, or customize policies for specific ports or switch elements through Brocade Network Advisor.
•Fabric Performance Impact (FPI) monitoring: Provides the ability to automatically mitigate the effects of slow drain devices or even resolve the slow drain behavior at the source.
|
Note: FPI now provides improved latency monitoring and detection. It is the preferred tool to replace the credit loss and bottleneck detection tools in FOS 7.3.x and later.
|
•Forward Error Correction (FEC): Enables recovery from bit errors in inter-switch links (ISLs), enhancing transmission reliability and performance.
7.1.1 Flow Vision
Flow Vision enables administrators to identify, monitor, and analyze specific application flows to preform troubleshooting, maximize performance, avoid congestion, and optimize resources. Flow Monitor is integrated with Brocade MAPS to enable threshold-based monitoring and alerting of flows. Flow Vision includes these features:
•Comprehensive visibility into application flows in the fabric, including the ability to learn (discover) flows automatically.
•Monitoring of application flows within a fabric at a specific port.
•Pre-defined flow to discover all application flows going through all device ports on a switch for network provisioning and planning.
•Statistics that are associated with the specified flows to gain insights into application performance, including the following statistics:
– Transmit frame count
– Receive frame count
– Transmit throughput
– Receive throughput
– SCSI Read frame count
– SCSI Write frame count
– Number of SCSI Reads and Writes per second (IOPS)
•When NPIV is used on the host, users can monitor Virtual Machine (VM)-to-LUN-level performance.
•Monitoring of various frame types at a switch port to provide insights into the storage I/O access pattern at the LUN level, reservation conflicts, and I/O errors.
•MAPS to enable threshold-based monitoring and alerting of flows.
•Flow Generator, which is a built-in traffic generator for pre-testing and validating the data center infrastructure including route verification and integrity of optics, cables, ports, back-end connections, and ISLs before deployment.
|
Note: Flow Vision is covered in greater detail in 12.9, “Flow Vision” on page 322. It offers many performance-related tools that work together with Fabric Vision and more specifically MAPS to provide a rich set of performance monitoring and troubleshooting tools.
|
7.2 ClearLink Diagnostics Port
ClearLink Diagnostic Port (D_Port) mode allows you to convert a Fibre Channel port into a diagnostic port for testing link traffic and running electrical loopback and optical loopback tests. The test results can be useful in diagnosing various port and link problems.
D_Port functionality is supported only on 16 Gbps-capable platforms, running Fabric OS 7.0.0 or later. The ports must use 10 Gbps or 16 Gbps Brocade-branded small form-factor pluggable (SFP) transceivers. It is also supported on 8-Gbps LWL SFP, 8-Gbps ELWL SFP, ICL ports, QSFP, and QSFP+ ports.
A Fabric Vision license is required to use Clear Link Diagnostics for third-party adapters and controllers.
|
Note: Starting with Fabric OS 7.4.0, D_Port tests can be performed if the Fabric Watch and Performance Monitor feature licenses are present.
|
Table 7-1 shows switches and FOS levels that support ClearLink Diagnostics.
Table 7-1 Switches and minimum FOS levels that support ClearLink Diagnostics
|
IBM Model
|
Machine type
|
Brocade Model
|
Minimum FOS
|
|
SAN768B-2
|
2499-816
|
DCX 8510-8
|
v7.0.0
|
|
SAN384B-2
|
2499-416
|
DCX 8510-4
|
v7.0.0
|
|
SAN24B-5
|
2498-F24
|
Brocade 6505
|
v7.0.1
|
|
SAN48B-5
|
2498-F48
|
Brocade 6510
|
v7.0.0
|
|
SAN96B-5
|
2498-F96
|
Brocade 6520
|
v7.1.0
|
|
SAN42B-R
|
2498-R42
|
Brocade 7840
|
v7.3.0
|
7.2.1 Enabling D_port Diagnostics by using IBM Network Advisor
Enabling D_port diagnostics by using IBM Network Advisor is accomplished by selecting Monitor → Troubleshooting → FC → Diagnostic Port Test.
Figure 7-1 shows D_Port diagnostics being enabled.
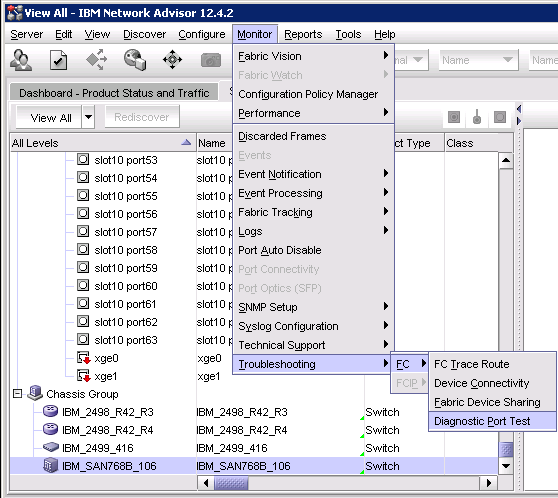
Figure 7-1 D_Port diagnostics being enabled
7.2.2 Selecting and running D_port diagnostics
Select D_port diagnostics testing and the Diagnostic Port Test panel is displayed. All ports eligible for D_Port testing are presented in the left pane. Individual ports are selected from that pane by completing these steps:
1. Highlight the port and click the Left arrow. Conversely, to remove a port, highlight the port in the Selected Ports pane and click the Right arrow.
2. To start the test select the Start button. The results are displayed in the lower right pane.
3. When all tests are complete, remove ports from the selected ports pane and click Close to close the panel.
Figure 7-2 shows the D_Port testing panel with port added and testing results in the lower pane.
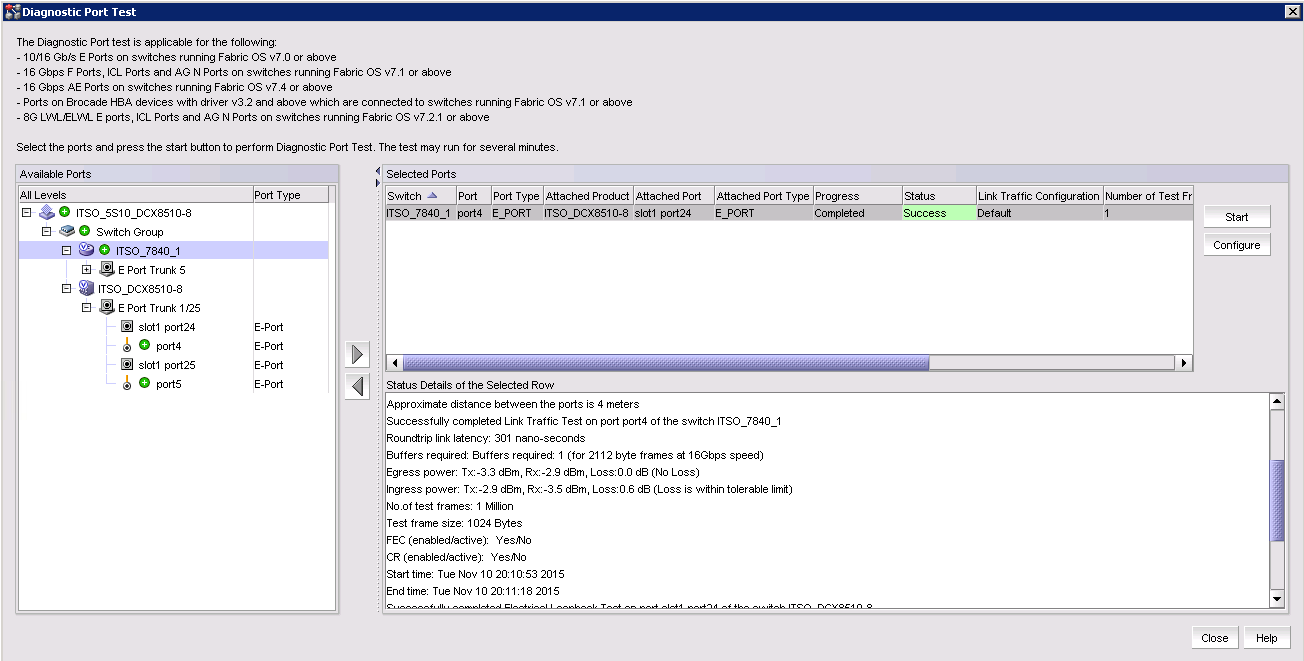
Figure 7-2 Shows the D_Port testing panel with switch Port added and testing results
|
Note: For ClearLink use and detailed configuration information that includes sample test scenarios, see the FOS Administration Guide at:
|
7.3 Bottleneck detection
Bottleneck Detection identifies and alerts administrators to device or ISL congestion, and abnormal levels of latency in the fabric. When it is applied to F_Ports, Bottleneck Detection can continuously monitor for medium or high levels of latency on a device port and provide notification about the nature and duration of the latency. Bottleneck Detection can also serve as a confirmation about host information when storage latencies are suspected as the cause of poor host performance.
The reverse (eliminating the storage as the source of poor performance) is also true. When applied to E_Ports, Bottleneck Detection can alert administrators when it detects high levels of latency on an ISL. High levels are often the result of congestion or latency from elsewhere in the fabric, but also can be a condition that can occur as a result of device latencies from multiple flows.
Network Advisor works with Bottleneck Detection to automatically monitor and detect network congestion and latency in the fabric, providing visualization of bottlenecks in a connectivity map and product tree. Network Advisor can also show exactly which devices and hosts are affected by a bottlenecked port.
FOS v6.3 marked the initial release of Bottleneck Detection and later enhanced in v6.3.1b to include latency detection for F_Ports. Alerting is accomplished through RASlog entries only by producing a RASlog message (AN-1003) when a latency threshold is exceeded. The message has a severity level of WARNING.
7.3.1 Enabling, displaying, and disabling bottleneck detection
Enabling, displaying, and viewing bottleneck detection in the command line interface is accomplished by using the commands below. These commands set the alerts with default parameters that can be altered as needed based on the environment and level of monitoring wanted.
The bottleneckmon --status command returns information about whether the monitor is enabled and what parameters are set as shown in Example 7-1.
Example 7-1 Results of the bottleneckmon --status
switch:admin> bottleneckmon --status
Bottleneck detection - Enabled
==============================
Switch-wide sub-second latency bottleneck criterion:
====================================================
Time threshold - 0.800
Severity threshold - 50.000
Switch-wide alerting parameters:
================================
Alerts - Yes
Latency threshold for alert - 0.100
Congestion threshold for alert - 0.800
Averaging time for alert - 300 seconds
Quiet time for alert - 300 seconds
The bottleneckmon [--enable |--disable] -alert command enables or disables the monitor with the default settings. If no response is returned after running these commands, the CLI will return only a prompt. See Example 7-2.
Example 7-2 Bottleneck monitor being enabled and disabled for all ports on a switch
switch:admin>bottleneckmon --enable -alert
switch:admin>
switch:admin>bottleneckmon --disable -alert
switch:admin>
When viewing the statistics, the --show command reports the number of bottlenecked ports or will report that the service is not enabled if the tools are disabled or FOS v7.4 or greater is installed. See Example 7-3.
Example 7-3 bottleneckmon --show command output
switch:admin> bottleneckmon --show
==================================================================
Tue Nov 10 20:27:42 UTC 2015
==================================================================
List of bottlenecked ports in most recent interval:
None
==================================================================
Number of
From To bottlenecked ports
==================================================================
Nov 10 20:27:32 Nov 10 20:27:42 0
Nov 10 20:27:22 Nov 10 20:27:32 0
Nov 10 20:27:12 Nov 10 20:27:22 0
7.3.2 Enabling bottleneck monitor in IBM Network Advisor
To enable the bottleneck monitor with IBM Network Advisor, select Monitor → Performance → Bottlenecks.
Figure 7-3 shows the Bottleneck monitors being enabled.
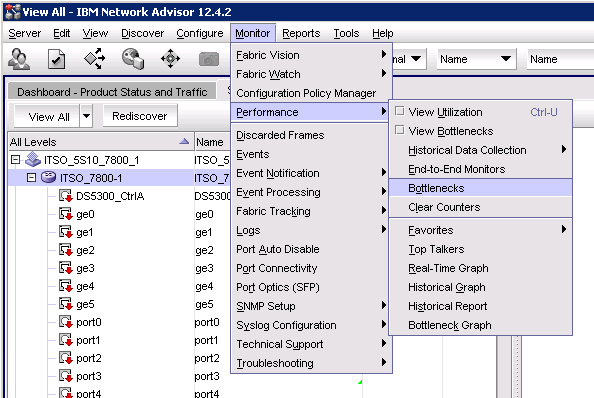
Figure 7-3 Enabling the Bottleneck monitor
7.3.3 Configuring Bottleneck monitors
After you select the Bottlenecks option, a Bottleneck monitor window is displayed. This window allows for configuration of notification thresholds on a whole switch or by ports basis.
Figure 7-4 shows the Bottlenecks configuration window.
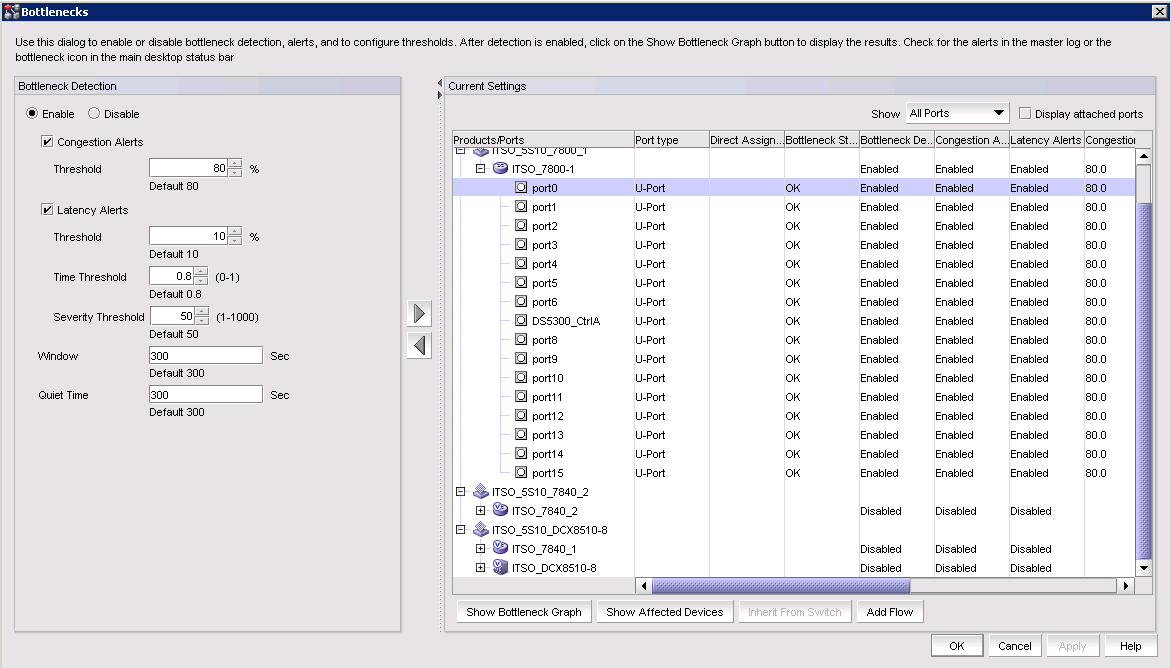
Figure 7-4 Bottlenecks configuration window
|
Note: The FOS Administration Guide contains detailed configuration instructions and recommendations. It is available on the following website:
|
7.3.4 Bottleneck Monitor Suggested initial settings
Field experience shows that the original strategy of enabling Bottleneck Detection with conservative values for latency thresholds almost always yields no results. There was a concern that aggressive values would result in Bottleneck Detection alert storms, but this has not been the case. Even the most aggressive values result in relatively few alerts being generated. As a result, it is now a preferred practice that the most aggressive settings are tried first and then backed off gradually if too many alerts are seen.
The following is a suggested set of graphical user interface (GUI)-based settings for all F-ports being monitored:
•Congestion 50%
•Latency 20%
•Window 60 seconds
•Quiet Time 60 seconds
The window time represents the size of the time window to look at when determining whether to alert.
Quiet time is used to throttle the frequency of the alerts between consecutive alerts.
Table 7-2 provides some suggested starting values for various levels of bottleneck monitoring.
Table 7-2 Suggested starting values for three levels of monitoring
|
Parameter
|
Conservative Setting
|
Normal Setting
|
Aggressive Setting
|
|
Congestion
|
0.8
|
0.5
|
0.1
|
|
Latency
|
0.3
|
0.2
|
0.1
|
|
Window
|
300
|
60
|
5
|
|
Quiet time
|
300
|
60
|
1
|
7.3.5 Displaying bottleneck statistics
Bottlenecks are reported through alerts in the Master Log. A bottleneck cleared alert is sent when the bottleneck is cleared.
Bottlenecks can be highlighted in the Connectivity Map and Product List. Select Monitor → Performance → View Bottlenecks. If a port is experiencing a bottleneck, a Bottleneck icon is displayed in the Connectivity Map for the switch and fabric, and in the Product List for the port, switch, and fabric, as shown in Figure 7-5. In example shown, port15 and port22 are bottlenecked.
Figure 7-5 Ports Icons displaying bottlenecks
|
Note: For detailed instructions on displaying bottleneck output, see the Brocade FOS Administration Guide at:
|
7.4 Buffer credit depletion and recovery
FOS V7.1 and later supports buffer credit recovery. This feature allows links to recover after buffer credits are depleted when the logic is enabled. The buffer credit recovery feature also maintains performance. If a credit is lost, a recovery attempt is initiated. During link reset, the frame and credit loss counters are reset without performance degradation.
Credit recovery is supported on E_Ports, F_Ports, and EX_Ports. Buffer credit recovery is enabled automatically across any long-distance connection for which the E_Port, F_Port, or EX_Port buffer credit recovery mechanism is supported.
To enable backend port credit loss recovery with the link reset only option and to display the configuration, issue these commands:
switch:admin> creditrecovmode --cfg onLrOnly
switch:admin> creditrecovmode --show
Internal port credit recovery is Enabled with LrOnly
C2 FE Complete Credit Loss Detection is Enabled
To enable back-end port credit loss recovery with the link reset threshold option and to display the configuration, issue these commands:
switch:admin> creditrecovmode --cfg onLrThresh
switch:admin> creditrecovmode --show
Internal port credit loss recovery is Enabled with LrThresh
C2 FE Complete Credit Loss Detection is Enabled
To disable back-end port credit loss recovery and to display the configuration, issue these commands:
switch:admin> creditrecovmode --cfg off
switch:admin> creditrecovmode --show
Internal port credit loss recovery is Disabled
C2 FE Complete Credit Loss Detection is Enabled
|
Note: In FOS 7.2 and lower, use the bottleneckmon --cfgcredittools command to enable buffer credit depletion and detection tools. For syntax and use, see the Fabric OS Command Reference Supporting Fabric OS v7.2.x and earlier at MyBrocade:
|
7.5 Fabric Performance Impact monitoring
The FPI tool monitors the latency on E_Ports and F_Ports over different time periods and uses that to determine the performance impact to the fabric and network.
FPI monitoring is automatically enabled for new b-type switches already running Fabric OS 7.3.0 or later, or if the legacy bottleneck monitoring feature was not enabled before the switch firmware was upgraded to Fabric OS 7.3.x or 7.4.0.
|
Note: To use FPI monitoring, the legacy bottleneck monitoring feature cannot be enabled. You can use the bottleneckmon --status command to verify the bottleneck monitoring status. To disable the legacy bottleneck monitoring, use the bottleneckmon --disable command.
|
To enable FPI, if previously disabled, complete the following steps:
1. Log in to IBM Network Advisor using an ID with administrator privileges.
2. Select Monitor → Fabric Vision → MAPS → Configure and the MAPS Configuration window is displayed (Figure 7-6).
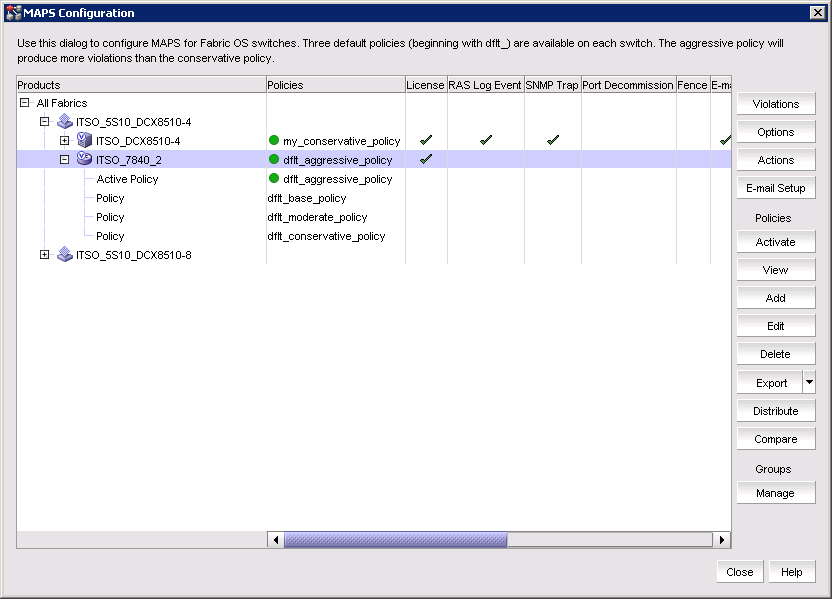
Figure 7-6 Shows the MAPS Configuration window
3. Select the Options button to display the MAPS Options window (Figure 7-7). Select FPI (Fabric Performance Impact) Monitoring.
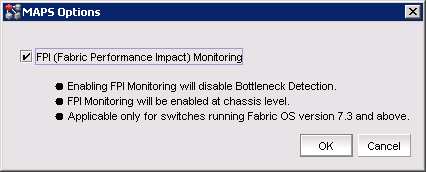
Figure 7-7 Shows the MAPS Options panel with FPI check box set
4. Select OK to return to the MAPS Configuration window.
5. Select Close to return to the main IBM Network Advisor window.
For more information about CLI commands to enable and display FPI settings, see the Fabric OS Command Reference available on the following website:
7.6 Managing Forward Error Correction
FEC is described in“Forward Error Correction” on page 16.
7.6.1 Enabling, disabling, and viewing FEC status
|
Important: Enabling FEC is disruptive to traffic.
|
To enable FEC on a single port and to display the configuration, issue these commands:
switch:admin> portcfgfec --enable -FEC 5/28
Warning : FEC changes will be disruptive to the traffic
FEC has been enabled.
switch:admin> portcfgfec --show 5/28
Port: 412
FEC Capable: YES
FEC Configured: ON
FEC via TTS Configured: OFF
FEC State: active
To disable the FEC feature on a port range, issue these commands:
switch:admin> portcfgfec --disable -FEC 0-8
Warning : FEC changes will be disruptive to the traffic
FEC has been disabled.
Warning : FEC changes will be disruptive to the traffic
FEC has been disabled.
Warning : FEC changes will be disruptive to the traffic
FEC has been disabled.
To disable the FEC feature on a port range, issue these commands:
switch:admin> portcfgfec --disable -FEC 0-8
Warning : FEC changes will be disruptive to the traffic
FEC has been disabled.
Warning : FEC changes will be disruptive to the traffic
FEC has been disabled.
|
Note: Additional use and syntax can be found in the Fabric OS Command Reference v7.4.1 Guide at:
|
7.7 Monitoring, Alerting, and Performance Suite
MAPS provides an easy-to-use solution for policy-based threshold monitoring and alerting. MAPS proactively monitors the health and performance of the SAN infrastructure to ensure application uptime and availability. By utilizing both pre-built rules and policy-based templates, MAPS simplifies fabric-wide threshold configuration, monitoring, and alerting. Administrators can configure the entire fabric (or multiple fabrics) at one time by using common rules and policies, or customize policies for specific ports or switch elements through Brocade Network Advisor.
MAPS replaces FW as the preferred method of fabric monitoring, and cannot coexist with FW. The FW configuration must be migrated to a MAPS compatible format.
In Fabric OS 7.4.0, MAPS is no longer optional. It replaces Fabric Watch, and provides a set of monitors that work even if the MAPS license is not activated. MAPS monitors field-replaceable units (FRUs), environmental and switch resources (such as memory), and so on.
|
Important: MAPS activation is a non-reversible process. After it is enabled, it is enabled for any version of Fabric OS 7.2.0 or later. It is not required to be enabled at FOS 7.4.0 or later. Fabric Watch is no longer an option. If you want to use a monitoring and alerting tool, you must enable MAPS.
|
The Fabric Watch feature is not part of Fabric OS 7.4.0, and only becomes active if you downgrade to a version of Fabric OS before 7.2.0. This process enables Fabric Watch with its last configured settings. These settings will be the defaults if no custom settings are available.
For detailed migration instructions, see the Monitoring and Alerting Policy Suite Administrator’s Guide, which is available on the following website:
7.7.1 Enabling MAPS
If Fabric Watch is not in use, or a fresh configuration that ignores previous Fabric Watch policies is wanted, MAPS can quickly start monitoring a switch using MAPS with one of the predefined policies that are available in MAPS.
If Fabric Watch is in use, the policies can be converted MAPS policies and will use the same thresholds.
|
Note: Fabric Watch policies must be converted into MAPS policies before you install Fabric OS 7.4.0. MAPS will then automatically use the policy named fw_active_policy to provide the same monitoring functionality as Fabric Watch is using.
|
For instructions on how to convert Fabric Watch Policies into MAPS Policy, see “Converting Fabric Watch policies to MAPS policies” on page 204.
To enable MAPS in IBM Network Advisor with a default policy, select the menu options Monitor → Fabric Vision → MAPS → Enable.
Figure 7-8 shows MAPS being enabled by using IBM Network Advisor.
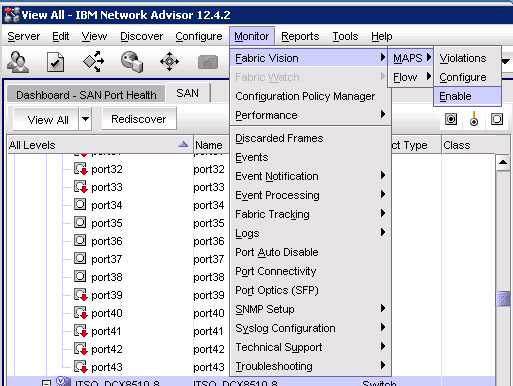
Figure 7-8 Enabling MAPS by using IBM network Advisor
Maps can also be enabled by using the command-line interface (CLI). Detailed instructions and examples are available in the Monitoring and Alerting Policy Suite Administrator’s Guide for Fabric OS v7.4.0, which is available on the following website:
Converting Fabric Watch policies to MAPS policies
|
Note: To retain the Fabric Watch policies and thresholds, this conversion must be completed before you install Fabric OS 7.4.0.
|
To convert an existing Fabric Watch policy to a MAPS policy, complete the following steps:
1. Start a CLI session to the switch using an ID with administrative privileges.
2. Enter the command mapsconfig --fwconvert.
The command creates a MAPS policy named fw_active_policy that can then be applied when MAPS is enabled as described in 7.7.2, “Configuring MAPS with Fabric Watch Rules” on page 204.
|
Note: This command converts the Fabric Watch policy only. MAPS must then be enabled and have the converted policy applied.
|
7.7.2 Configuring MAPS with Fabric Watch Rules
To continue using the same Fabric Watch thresholds in MAPS, the FW rules must be converted into MAPS policies before you install FOS V7.4.0. MAPS will then use the policy named fw_active_policy to provide the same monitoring rules.
To enable MAPS and apply the converted policy, complete the following steps:
1. Log in to IBM Network Adviser with an ID with administrative privileges.
2. Select Monitor → Flow Vision → MAPS → Enable to display the Enable MAPS window as shown in Figure 7-9.
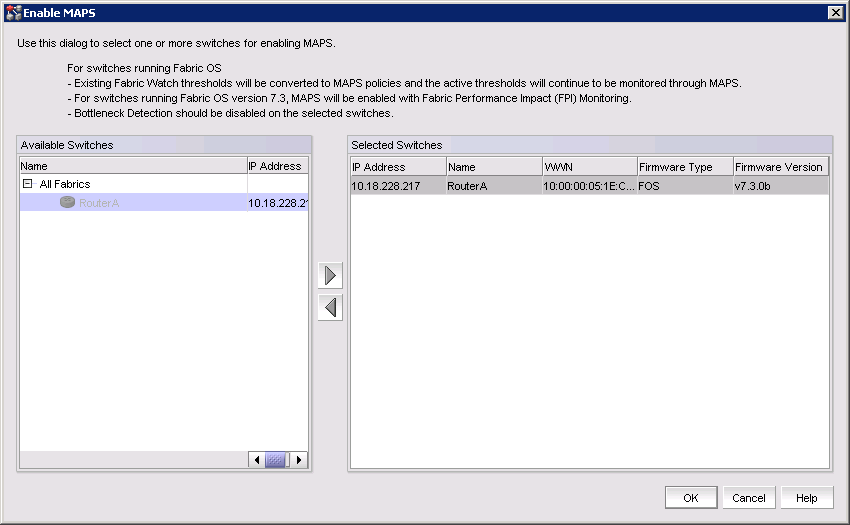
Figure 7-9 Enable MAPS window
3. Select the switch or switches from the Available Switch pane and click the Right Arrow to move it to the selected switches pane.
4. Click OK to start the MAPS enable process. A status panel is displayed when it is complete as shown in Figure 7-10.
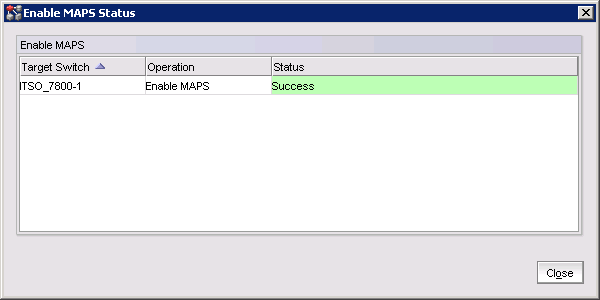
Figure 7-10 Enable Maps Status window
|
Note: If the switch is not at or above Fabric OS v7.2.0, IBM Network Advisor displays a message that indicates that the switch is not available for conversion.
|
5. Click Close return to the main IBM Network Advisor window.
When MAPS is enabled with an existing converted Fabric Watch policy, the policy is automatically applied and enabled on the switch that has been migrated to MAPS. To confirm that the policy has been enabled, select Monitor → Fabric Vision → MAPS → Configure. The MAPS Configuration window is displayed as shown in Figure 7-11.
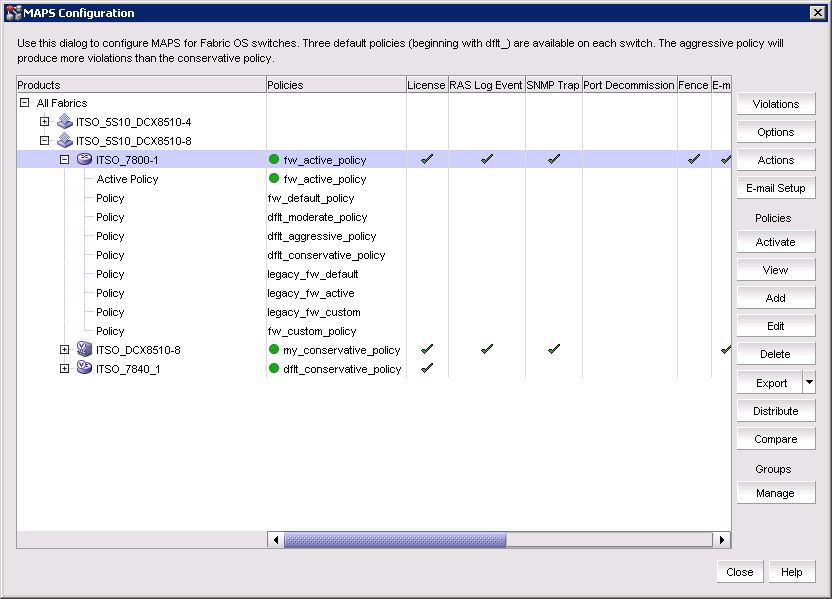
Figure 7-11 MAPS Configuration window with the “fw_active_policy” applied
If the fw_active_policy is present for the switch, it is automatically applied to the switch when MAPS is enabled.
7.7.3 MAPS Slow Drain Device Quarantine
In a fabric, many flows share a link or virtual circuit (VC). However, the credits that are used to send traffic or packets across the link are common to all the flows that are using the same link. Because of this structure, a slow-draining device might slow down the return of credits and have a negative effect on the healthy flows through the link.
Figure 7-12 illustrates how this process works. In the figure, the inability of the slow-draining device (1) to clear frames quickly enough is causing backpressure not just to the edge device (2), but also to the core (3) and the appliance (4) that is trying to reach the slow-draining device.
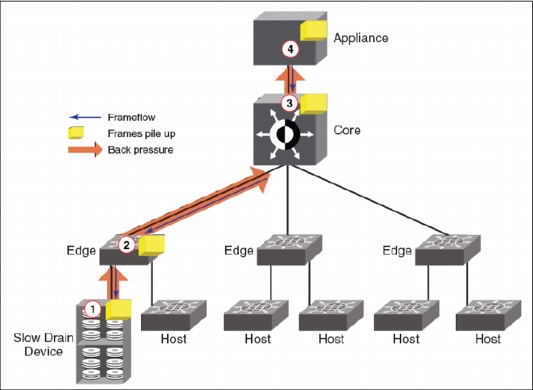
Figure 7-12 Slow drain device
To remedy this effect, Slow Drain Device Quarantine (SDDQ) was created. This feature, with Quality of Service (QoS) monitoring, allows MAPS to identify a slow-draining device and quarantine it by automatically moving all traffic destined to the F_Port that is connected to the slow-draining device to a low-priority VC so that the traffic in the original VC does not experience backpressure.
Enabling and disabling actions at a global level allows you to configure rules with stricter actions, such as port fencing, but disable the action globally until you can test the configured thresholds. After you validate the thresholds, you can enable port fencing globally without having to change all of the rules.
|
Note: For SDDQ to take effect, the Fabric Vision license must be installed on the switch where the slow draining device is detected, and on the switch where the quarantine action is to occur. Intermediate switches do not need the Fabric Vision license for this feature to work, but they must have QoS enabled on all ISLs.
|
To enable SDDQ, complete the following steps:
1. Log in to IBM Network Advisor by using an account with administrative privileges.
2. Select Monitor → Flow Vision → MAPS → Configure to display the MAPS Configuration window.
3. Select All Fabrics in the Products window and click Actions. The MAPS Policy Actions window is displayed as shown in Figure 7-13.
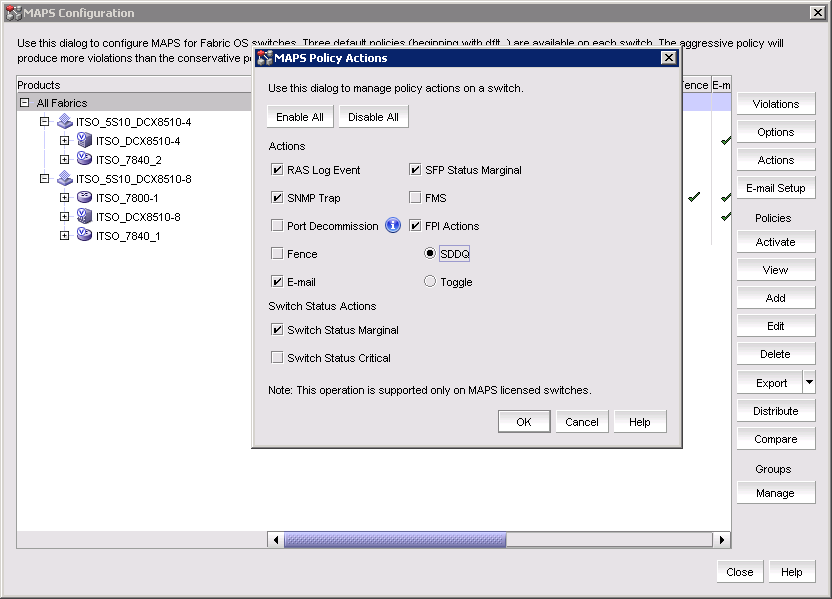
Figure 7-13 MAPS Policy Action panel
4. Select FPI Actions, and then select the SDDQ radio button.
5. Click OK on the MAPS Policy Actions window.
6. Click Close on the MAPS Configuration window.
SDDQ can be disabled in the same manner by clearing the FPI Actions check box.
7.7.4 MAPS port fencing
MAPS supports port fencing and port decommissioning for both E_Ports and F_Ports. These actions automatically take ports offline when configured thresholds in a specific rule are exceeded. Port fencing immediately takes ports offline, which might cause loss of traffic. Port decommissioning takes a port offline more slowly, but without loss of traffic. Both are disabled by default. Port decommissioning and port fencing can only be configured for the port health monitoring system rules, which affect the monitoring systems for which decommissioning is supported.
Port fencing is enabled by using the MAPS Policy Actions window. For instructions on how to access this panel, see 7.7.3, “MAPS Slow Drain Device Quarantine” on page 206. When the panel is open, select Fence under the Actions options. Figure 7-14 shows the Fence option selected.
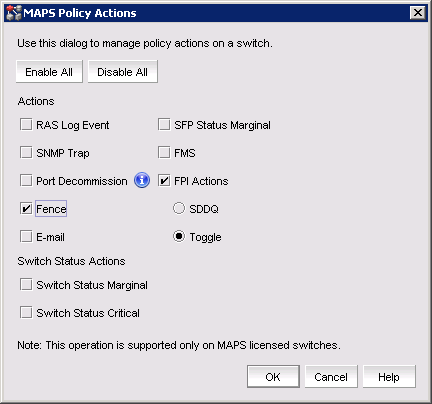
Figure 7-14 MAPS Policy Actions panel with the fenced option selected
7.7.5 MAPS Toggling and decommissioning
MAPS supports port fencing and port decommissioning for both E_Ports and F_Ports. These actions automatically take ports offline when configured thresholds in a rule are exceeded. Port fencing immediately takes ports offline, which might cause loss of traffic. Port decommissioning takes a port offline more slowly, but without loss of traffic. Both are disabled by default. Port decommissioning and port fencing can only be configured for the port health monitoring system rules, which affect the monitoring systems for which decommissioning is supported.
MAPS supports port toggling, which allows Fabric OS to recover a port that has been bottlenecked by a target device. Although there are many reasons why the target device could be bottlenecked, one of the most common is a temporary glitch in an adapter or its software.
Port toggling in MAPS temporarily disables a port and then enables it again, allowing the port to reset and recover from the issue. If the port does not recover, Fabric OS suspends the port, forcing the port traffic to switch over to a different path if one is available.
To enable recovering ports by using port toggling, MAPS assumes that there is a redundant path to the target device. It does not check to see whether there is one, nor can it check to see whether traffic to or from the target device has been switched over to a redundant path. MAPS also assumes that while the port is being toggled, the operational state of the port will not be changed by any other mechanism, such as an administrator disabling or moving the port, or a port fencing operation.
Port Toggling and decommissioning are enabled by using the MAPS Policy Actions window. For instructions on how to access this window, see 7.7.3, “MAPS Slow Drain Device Quarantine” on page 206. When the panel is open, select the Toggle check box under the FPI options or the Port Decommission check box under the Actions options. Figure 7-14 on page 209 shows the Fence option selected. Figure 7-15 shows the MAPS Policy Actions window with the toggle and decommission options selected.

Figure 7-15 MAPS Policy Actions window with Toggle and Port Decommission options selected
7.7.6 MAPS Dashboard
The MAPS dashboard provides a summary view of the switch health status that allows administrators to easily determine whether everything is working according to policy or whether further investigation is required.
IBM Network Advisor provides a MAPS Widget on the Dashboard view of the main window. See Chapter 4, “IBM Network Advisor” on page 49 for more information about IBM Network Advisor views and widgets.
The widget displays the number of MAPS threshold violations for all network objects (such as ports, trunks, switches, and circuits) for all MAPS-capable devices. In addition, the MAPS dashboard widgets include the Fabric Watch threshold violations for devices with the Fabric Watch license or FC devices running Fabric OS 7.2.0 or later with the Fabric Vision license but not migrated to MAPS.
By default, the MAPS Dashboard widget that is shown in Figure 7-16 refreshes every minute. If any violations occur on fabrics in your area of responsibility (AOR) during the minute refresh time frame, the widget refreshes every 10 seconds. If you delete, discover, or unmonitor a device, the widget refreshes. MAPS violation data is stored in the database for 30 days. The system purges old data (over 30 days) every night at 12 midnight. The system also purges violations from deleted or unmonitored devices.
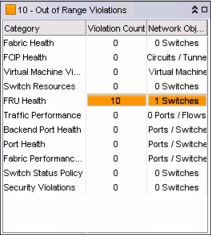
Figure 7-16 Out of Range Violations Widget
The Out of Range Violations widget includes the following fields and components. It always displays whether or not there is an associated violation.
•Fabric Health
•FCIP Health
•FRU Health
•Port Health
•Backend Port Health
•Security Violations
•Switch Resources
•Switch Status Policy
•Traffic Performance
•Virtual Machine Violations
The widget offers color coding to highlight the worst severities and device counts of the violation category. The widget can also be customized to display the categories by user preference.
To access additional data from the widget, right-click any row and select Violations to navigate to the Violations window.
|
NoteD_Port: Detailed information and instructions about configuration and displaying the MAPS violations is available in the Monitoring and Alerting Policy Suite Administrator’s Guide, which is available on the following website:
|
..................Content has been hidden....................
You can't read the all page of ebook, please click here login for view all page.