


B-type SAN monitoring and management with IBM Spectrum Control
This chapter describes the IBM Spectrum Control 5.2.9 b-type SAN monitoring and management capabilities. It provides guidance on how to integrate your b-type fabric with the tool itself and how to perform the most common monitoring and management activities with IBM Spectrum Control.
This chapter includes the following sections:
|
Note: IBM Spectrum Control was formerly known as IBM Tivoli Storage Productivity Center (versions 5.2.7 and earlier).
|
6.1 Software prerequisites
|
Note: This chapter does not cover the software installation for the products described or their initial configuration. Instead, it describes integration of b-type switch devices with IBM Spectrum Control, and the available functions and capabilities that are supported for this type of devices.
|
Before proceeding any further with the topics that are described in this chapter, ensure that you have the following software prerequisites:
•A running instance of IBM Network Advisor 12.4.X and Storage Management Initiative (SMI) Agent. Fabrics and switches should be already discovered and managed by IBM Network Advisor before the SMI Agent integration. See the links in 6.2, “Interoperability matrixes for supported switches and directors” on page 142 for detailed information about supported versions.
•A running instance of IBM Spectrum Control 5.2.9.
|
Important:
•IBM Network Advisor and IBM Spectrum Control cannot be installed on the same server.
•If you are planning to integrate your b-type switches without the SMI Agent implementation (not recommended), then IBM Network Advisor is not required.
|
For information about IBM Network installation and configuration, see Chapter 4, “IBM Network Advisor” on page 49.
For installation and configuration instructions for IBM Spectrum Control 5.2.8 and later, see the IBM Knowledge Center at the following link:
For information about installing IBM Tivoli Productivity Center 5.2.7 and earlier releases, see the following link:
6.2 Interoperability matrixes for supported switches and directors
As a part of the prerequisites, interoperability between the b-type switches and IBM Spectrum Control 5.2.9 needs to be checked before you add and manage the b-type devices with the tool. See the following link for the corresponding compatibility matrix:
For overall hardware, products and platform, and Spectrum Control interoperability, see the following link:
IBM Spectrum Control supports homogeneous fabrics for Brocade, Cisco, and QLogic vendors. Heterogeneous fabrics are not supported. Specifically, fabrics with switches from two (or more) vendors are not supported unless all switches of one of the vendors are in NPV (N_Port Virtualization) mode.
Access Gateway mode switches are supported in Spectrum Control 5.2.8 and higher, but with some limitations. Refer to the following link for details:
|
Notes:
•FICON support for b-type switches is available in IBM Network Advisor integrated SMI agent. However, there is no differentiation of FICON from FC in IBM Spectrum Control.
•Spectrum Control 5.2.9 now displays the switch blade number, port number, and blade names just as they were defined in other tools, such as IBM Network Advisor.
|
6.2.1 Virtual Fabrics support
Spectrum Control 5.2.8 and later supports Virtual Fabrics, with the following limitations:
•If b-type switches are partitioned into virtual fabrics, the virtual fabrics and switches are displayed in the IBM Spectrum Control GUI, but the physical fabrics and physical switches are not.
•The virtual fabrics and switches are displayed as though they were physical fabrics and switches. Therefore, there is no indication on which virtual fabrics are actually on the same physical fabric, and you cannot see which virtual switches are on the same physical switch.
•You must use a CIM agent to collect performance metrics for b-type switches that are partitioned into virtual fabrics. The simple network management protocol (SNMP) agent will not collect these performance metrics.
6.3 Monitoring agents for switches and fabrics
Depending on the type of information you want to collect or the functions that you want to use on your b-type switches and fabrics, you can use these items as valid data sources communication methods to set up your switch devices in IBM Spectrum Control:
•SMI (CIM) Agent
•SNMP agent
•Storage Resource agents (IBM Tivoli Storage Productivity Center v5.2.7 and earlier)
•A combination of these agents
Table 6-1 summarizes the fabric and switches monitoring capabilities of IBM Spectrum Control 5.2.9 and the agents supported for each one of those functions.
Table 6-1 Spectrum Control 5.2.9 Monitoring functions versus supported agents
|
Function
|
Agents
|
|
Monitor performance
|
SMI Agent or SNMP agent
|
|
Collect information about switches and switch ports
|
Preferred: SMI Agent
Also supported: SNMP agent, Storage Resource agent (IBM Tivoli Storage Productivity Center v5.2.7 and earlier only)
|
|
Collect information about topology connectivity
|
Preferred: SMI Agent
Also supported: SNMP agent, Storage Resource agent (IBM Tivoli Storage Productivity Center v5.2.7 and earlier only)
|
|
Collect information about zoning information and zone control
|
Preferred: SMI Agent
|
|
Generate alerts
|
Preferred: SMI Agent
Also supported: SNMP agent
|
|
Collect information about hosts, endpoint devices, and device-centric and host-centric information
|
Storage Resource agent (IBM Tivoli Storage Productivity Center v5.2.7 and earlier only)
|
The following agents are available:
•The Storage Resource Agent (in-band - IBM Tivoli Storage Productivity Center 5.2.7 and earlier only) is deployed on a per server basis. It provides in-band fabric and switch self-discovery by using the server’s host bus adapter (HBA) connections to the storage network. When the agent is deployed, it will autopopulate the Switches and Fabrics views of Tivoli Storage Productivity Center. A schedule can be then defined to retrieve information that is related to the switch configuration changes. However, it will not allow you to gather performance statistics, zoning information or to generate alerts. In addition to these limitations, if multiple fabrics are present, at least one server connection on each fabric is required to manage them.
•The SNMP Agent v1/v3 (out-of-band) allows the user to add and manage b-type switches in IBM Spectrum Control by using the SNMP v1/v3 protocol. However, it will not collect any zoning information or information that is related to hosts and endpoint devices. Both configuration probe and performance data gathering are supported when you use the SNMP protocol to communicate with the switches. To model your fabric environment with this method, you need to manually add each switch to IBM Spectrum Control. Protocol versions v1 and v3 are supported. However, v3 is the typical use and v1 is included only for existing support purposes.
•The SMI Agent (out-of-band) is deployed by default along with the IBM Network Advisor installation. It is also the preferred communication method setup between IBM Spectrum Control and your b-type switches. Both configuration probe and performance data gathering are supported by the SMI Agent. This agent is the most complete connectivity method in terms of fabric monitoring and management delivered capabilities. The configuration within Spectrum Control is as easy as inputting the SMI Agent’s connection parameters (IP address, user name, and password). When it is deployed, Spectrum Control will communicate with all of your IBM Network Advisor managed fabrics by using the SMI Agent.
|
Note: For IBM Spectrum Control 5.2.8 and later, Storage Resource agents cannot be used to manage switches and fabrics.
|
6.3.1 Monitoring and managing fabrics with the Storage Resource Agent (IBM Tivoli Storage Productivity Center 5.2.7 and earlier only)
The Storage Resource Agent is deployed by default during the Tivoli Storage Productivity Center server installation. The agent provides host-based information to IBM Tivoli Storage Productivity Center. In the case of IBM Tivoli Storage Productivity Center server counts with HBA connections to the SAN, the agent can gather detailed topology information for the entire fabric using in-band connection through the HBA. To gather host-level and detailed HBA information for hosts other than the IBM Tivoli Storage Productivity Center server, the agent must be installed on each host where that information is wanted.
The Storage Resource agent provides the following functions:
•Gathers information about the SAN by querying switches and devices for topology and identification information.
•Gathers host-level information for the local system.
•Gathers information about the zoning of the fabric.
•Gathers information about the HBAs installed on the local system, including make, model, and driver versions.
•Gathers event information that is detected by the HBAs and forwards it to the Device server.
Storage Resource agents can complete the following tasks:
•Gather host-level and HBA information about the host that contains the Storage Resource agent.
•Provide detailed identification for devices that are in the same zone as the Storage Resource agent. The Storage Resource agent identifies the device by worldwide name (WWN) if the Storage Resource agent is not in the same zone as the device rather than being able to uniquely identify the device by device type (for example, host, and subsystem).
•Identify endpoint devices that are based on the endpoint device that is responding to Request Node Identification Data (RNID) or other queries.
•Gather a subset of the switch attributes. Some switch attributes can be collected only by using out-of-band Fabric agents.
•Tivoli Storage Productivity Center does not collect information about aliases through the Storage Resource agents.
When you deploy Storage Resource agents to hosts, the agents automatically run the discovery process and provide information about the fabrics or switches to which the hosts are attached. For example, if you have b-type switches and have Storage Resource agents deployed on the computers that are attached to these switches, the switches are automatically discovered when you deploy the Storage Resource agents.
Discovering fabrics with the Storage Resource agent provides the following information:
•Fabric WWN, information about fabric-to-switch relationships, and key attributes
•Host and device information (collected from Storage Resource agents only), including HBA information
•Basic information to identify the host and devices in the fabric
After a discovery is run, you can run probes to collect topology and zoning information for the fabrics. For b-type switches, use SMI Agents to collect all fabric data and enable performance monitoring, and use Storage Resource agents to collect information about HBAs.
For information about how to add switches and fabrics with the Storage Resource Agent, see 6.4, “Adding switches and fabrics” on page 148.
6.3.2 Monitoring and managing fabrics with the SNMP Agent (out-of-band)
IBM Spectrum Control uses SNMP (v1 or v3) queries to discover information about the switches and fabrics. Management Information Base (MIB) information is collected from the switches by the out-of-band fabric agent. Switches and directors are added as out-of-band agents and contacted from the IBM Spectrum Control Device server by SNMP.
The SNMP fabric agent provides the following functions:
•Gathers information about the fabric by querying the switch or director for topology information.
•Gathers virtual SAN information for Cisco switches.
Note the following limitations:
•Topology information is only gathered for the switch that was added as an out-of-band fabric agent. The agent cannot gather the topology information for any other switches that are connected to it unless they are also defined as out-of-band fabric agents. If you are doing out-of-band discovery on a fabric with several switches, you must install an out-of-band fabric agent for each switch in the fabric to discover the whole fabric.
•Device information is limited. Most devices are unknown with a type equal to “Other” and identified by their WWN.
•A working Ethernet connection must exist between the switch and the IBM Spectrum Control server.
•To enable events from the switch to the IBM Spectrum Control server, the switch must be configured to send SNMP traps to it.
For information about how to add switches and fabrics by using the out-of-band (SNMP) agent, see 6.4, “Adding switches and fabrics” on page 148.
6.3.3 Monitoring and managing fabrics with the Brocade SMI Agent
The Brocade SMI Agent is deployed by default with any IBM Network Advisor Professional Plus or IBM Network Advisor Enterprise edition installation. If you do not want to install IBM Network Advisor, select the option during the installation process to deploy only the SMI agent (“SMI Agent Only”). This option does not require a license, and deploys only the integrated SMI agent without the IBM Network Advisor management interface.
When you add fabrics and switches for monitoring, you can specify the SIM agent that manages them. IBM Spectrum Control connects to the SMI agent and automatically discovers the fabrics and switches that it manages. You can then add the discovered fabrics and switches, and configure data collection.
SMI agents provide the following benefits for fabric management:
•Probes do not occur in the data path.
•Propagation of alerts for real-time SAN events is not degraded by using fabric agents.
For information about how to add switches and fabrics by using the SMI Agent, see 6.4, “Adding switches and fabrics” on page 148.
6.3.4 Monitoring and managing fabrics with multiple agents
Sometimes it is not possible to deploy a single agent to cover all of the monitoring and management needs, or there is a specific need of redundancy to losing communication with the switch devices. For such cases, IBM Spectrum Control allows multiple connection methods to be defined for your switches and fabrics.
As mentioned earlier, using multiple agent types allows the redundant collection of information if one type of agent fails. Additionally, some types of agents provide certain features and information that the other agents do not. However, using multiple agent types can increase network traffic and the management load on the switches.
As an example, consider a set of switches monitored only by the Storage Resource Agent (SRA) that is deployed on a server that is attached by Fibre Channel to your fabric. The SRA, which uses in-band communication with the fabric, does not collect performance data. You can add this functionality by adding the switches by using an SNMP or SMI Agent.
Figure 6-1 shows the IBM Spectrum Control confirmation window when you add a switch by using SNMP. This switch was already managed by IBM Tivoli Storage Productivity Center by using the SRA. The request is successfully completed but a message is displayed to indicate that the switch was already managed. However, as a result of this new capability, you can enable Performance Monitoring for the switch.

Figure 6-1 Adding a switch to IBM Virtual Storage Center by using SNMP
Figure 6-2 shows the confirmation of the Performance Monitoring data collection activation on the switch.
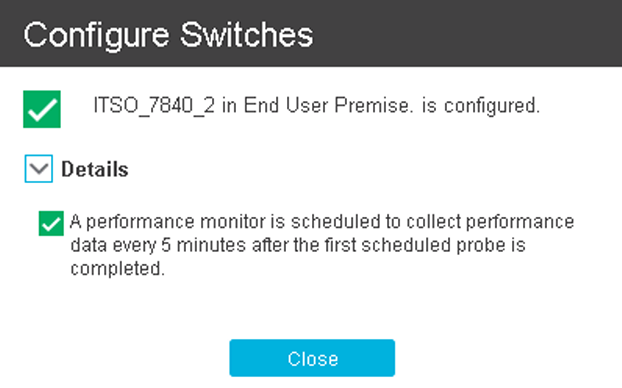
Figure 6-2 Switch configuration by using the SNMP confirmation window
After the additional Performance Monitoring capabilities are added, enable the monitor as described in 6.6, “Enabling the switch performance monitoring” on page 160.
6.4 Adding switches and fabrics
IBM Spectrum Control can discover devices in the SAN and collect data about the performance of those devices. This data collection can be performed either by using SNMP agents, SMI agents, or a combination of both. For versions 5.2.8 and later, the Storage Resource Agent is no longer available as connection method.
6.4.1 Device discovery
In IBM Spectrum Control, discovery is no longer available as a separate job as in earlier releases. Discovery now runs as part of adding a device or as part of probing a device.
For example, a switch that is attached to a server is discovered during a server probe. If you add a device to a SMI Agent, running the Add Device wizard again by using the SMI Agent will discover the new device. You will then be able to configure the device. Even if you do not run the Add Device wizard again in this situation, the next probe iteration will discover the new device. You will be able to see the new device in the list of switches and fabrics.
6.4.2 Device probes
In IBM Spectrum Control, a probe process is scheduled for a switch device, not for a data source (SNMP or SMI) or for a Monitoring Group.
When you start or schedule a probe for a switch, IBM Spectrum Control will probe the complete fabric, not just that switch. In this sense, the entire fabric can be thought of as a device. Thinking of the complete fabric makes sense because you need the information from the complete fabric to show any data paths.
|
Note: If multiple data sources are available, IBM Spectrum Control selects the best for a particular switch. For example, a SMI agent switch data source will always be used as preferred communication method, even if an SNMP agent data source is available.
|
6.4.3 Adding switches by using SNMP Agent (out-of-band)
If you want to add the switch to IBM Spectrum Control by using SNMP (for example, because you do not have a CIM Agent that is managing this switch), complete the following steps:
1. From the Spectrum Control top menu bar, select Network and then Switches. Then click Add Switch.
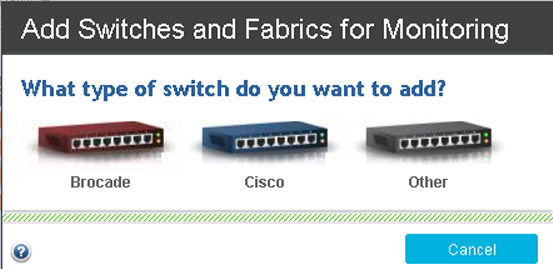
Figure 6-3 Switch vendor selection
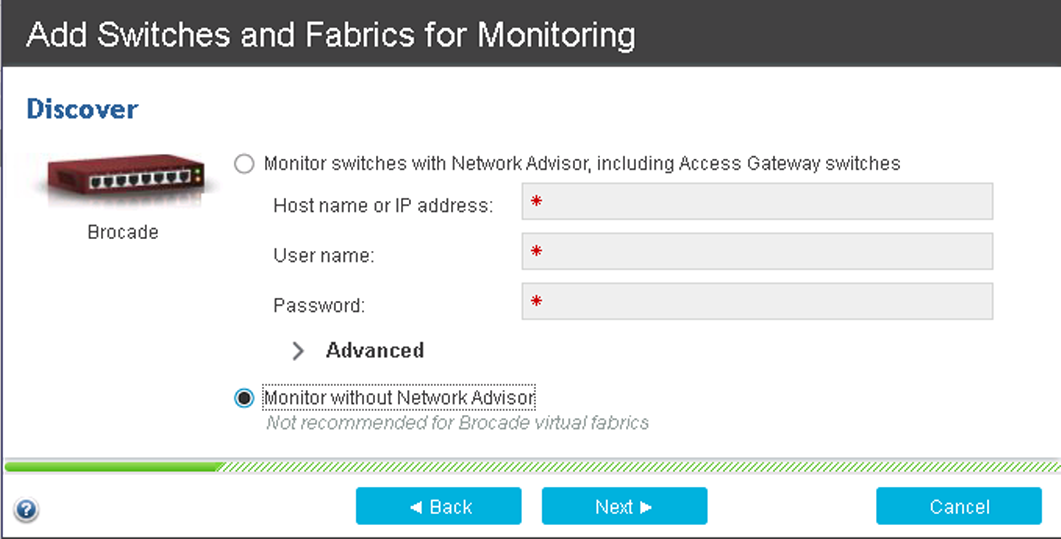
Figure 6-4 Selecting the switch discovery method
4. Select which SNMP protocol version to use (v1 or v3) and complete the information for the SNMP data source as shown in Figure 6-5, then click Next to continue.
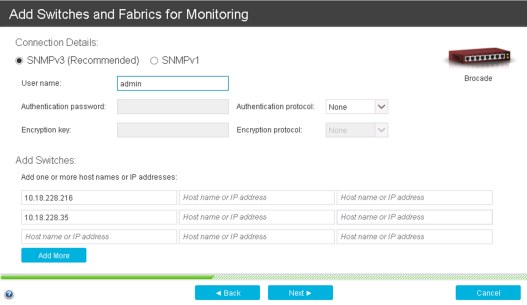
Figure 6-5 SNMP data sources configuration
5. IBM Spectrum Control will now verify that it can communicate with the switch by using SNMP as well as discover which devices are available through this data source.
|
Note: If you select SNMPv1 as the communication protocol and the discovery process fails, ensure that these conditions are true:
•The switch has SNMPv1 enabled,
•The SNMP v1 community that is being used is correct.
•If SNMP v1 control access is enabled, that the IP of the Spectrum Control server is added to the list of addresses that are allowed to communicate by SNMPv1 with the switch.
|
6. After the switches are discovered, the wizard will ask to set up the configuration probe and performance data schedules.
7. The wizard completes and a configuration probe is run to collect information about the switches.
8. Configure the SNMP trap notifications. SNMP traps are generated by the switch and directed to IBM Spectrum Control as an indication that something in the fabric changed and that a discovery must occur to identify the changes. The default configuration for handling switch traps is to send them from the switch to port 162 on the IBM Spectrum Control system. To successfully generate and receive traps, there are some configuration requirements:
– The trap destination parameter on the switch must be set. This parameter is the host that receives the trap and sends it to IBM Spectrum Control. The parameter is set on the switch.
– The destination port parameter on the switch must be set. IBM Spectrum Control listens on port 162 by default. This parameter is set on the host.
– The traps must be sent as SNMPv1. This parameter is set on the switch.
– The trap severity level must be set to generate traps for change conditions. This level typically is set to send error level traps and anything more severe. This parameter is set in IBM Spectrum Control.
9. To complete the switch setup, enable the device’s default or custom alerts so you are automatically notified when certain conditions are detected. For more information, see 6.9, “Alerting” on page 175.
6.4.4 Adding switches with the SMI Agent
If the switch that is being added to IBM Spectrum Control is available through a SMI Agent, complete the following steps:
1. From the Spectrum Control top menu bar, select Network → Switches → Add Switch.
Figure 6-6 Switch vendor selection
3. Select Monitor with Network Advisor as shown in Figure 6-7 and complete the connection information. Depending on the SMI agent connection parameters that you entered during the IBM Network Advisor installation, you might need to change the default communication protocol and port.

Figure 6-7 SMI agent connection information
Click Next.
4. A connection will be established with the remote SMI agent to query about its managed fabrics and devices. When this polling is complete, a new configuration window is displayed that lists the switches that are managed by the SMI Agent, as shown in Figure 6-8.
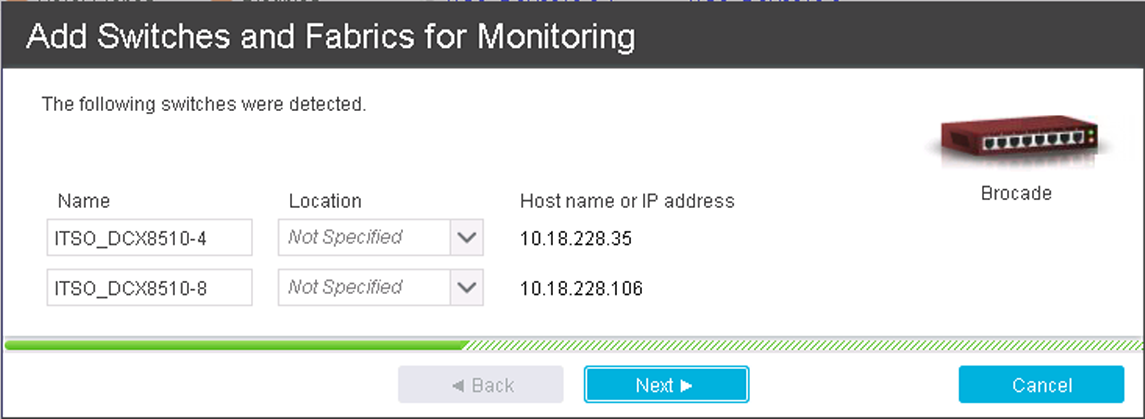
Figure 6-8 Review the discovered switches information
If wanted, make the corrections on the discovered switches’ name and location fields and then click Next.
5. When the switches are discovered, the wizard will ask to set up the configuration probe and performance data schedules.
6. The wizard completes and a configuration probe is run to collect information about the switches.
7. If you want to use SNMP for data source redundancy, add the discovered switches by using SNMP as described in 6.4.3, “Adding switches by using SNMP Agent (out-of-band)” on page 149.
8. Configure the SNMP trap notifications. SNMP traps are generated by the switch and directed to IBM Spectrum Control as an indication that something in the fabric changed and that a discovery must occur to identify the changes. The default configuration for handling switch traps is to send them from the switch to port 162 on the IBM Spectrum Control system. To successfully generate and receive traps, there are some configuration requirements:
– The trap destination parameter on the switch must be set. This parameter is the host that receives the trap and sends it to IBM Spectrum Control. The parameter is set on the switch.
– The destination port parameter on the switch must be set. IBM Spectrum Control listens on port 162 by default. This parameter is set on the host.
– The traps must be sent as SNMPv1. This parameter is set on the switch.
– The trap severity level must be set to generate traps for change conditions. This level typically is set to send error level traps and anything more severe. This parameter is set in IBM Spectrum Control.
9. To complete the switch setup, enable the device’s default or custom alerts so you are automatically notified when certain conditions are detected. For more information, see 6.9, “Alerting” on page 175.
6.4.5 Adding switches by using Storage Resource Agent (IBM Tivoli Storage Productivity Center 5.2.7 and earlier)
To discover a new switch and its fabric with this method, the Storage Resource agent must be deployed on at least one of the servers that are connected to the SAN fabric to be discovered. Complete the following tasks to implement the Storage Resource agents.
Implementing Storage Resource agents
The Storage Resource Agent can be deployed either by using the Tivoli Storage Productivity Center GUI or by a comma-delimited file. This section guides you through the GUI deployment procedure.
For more information about all the available Storage Resource agent deployment methods or about the Storage Resource agent itself, see the Tivoli Storage Productivity Center documentation on the IBM Knowledge Center:
Adding and managing a Storage Resource agent is not a new function for the Tivoli Storage Productivity Center. The functionality was migrated from the stand-alone GUI to the web-based GUI.
Use the web-based GUI to add servers by deploying Storage Resource agents. This process enables full server monitoring, which gathers the following server information:
• Asset information
• File and file system attributes
• Database application information
• Network-attached storage (NAS) device information
• Topology information
• Information about zoning and the fabrics that are visible to the server
|
Note: You must have Administrator privileges to deploy an SRA.
|
Before you deploy a Storage Resource Agent on a server, you need to disable the firewall for inbound connections (just for deployment purposes) on both the server where the agent will be deployed and the Tivoli Storage Productivity Center server. Otherwise the process might fail.
Adding Storage Resource agents manually by using the GUI
This section shows an example of adding a Storage Resource Agent manually on a Windows System. To do so, complete these steps:
1. From the Tivoli Storage Productivity Center GUI left navigation pane, select Server → Resources → Servers as shown in Figure 6-9.
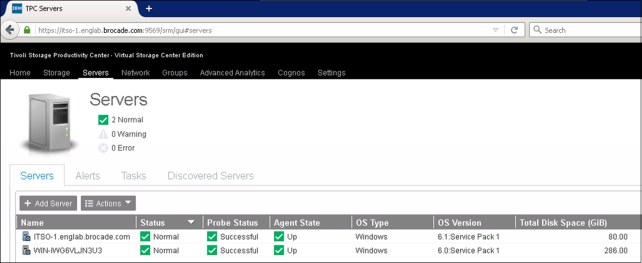
Figure 6-9 Server view main window
2. On the left of the top bar, click Add Server. The Add Server window appears as shown in Figure 6-10. Make sure that Deploy an agent for full server monitoring is selected, and select Manually.
|
Note: The From Discovered Servers option is not available for adding Storage Resource Agents.
|

Figure 6-10 Add Server window
3. Create a Storage Resource Agent deployment job as shown in Figure 6-11. This example shows the simplest authentication method, which is User Name/Password. Secure Shell (SSH) is also available. You also need to provide the fully qualified installation path, for example “C:Program FilesIBMTPC_SRA”. Additionally, Storage Resource agent will run in a non-daemon mode. You can also choose to overwrite previous installation agents to force installation of the Storage Resource agent.
Click Next to continue.

Figure 6-11 Deploy agent details dialog window
4. Configure a schedule for the agent deployment job on Figure 6-12. In this example, after you click Finish, the deployment job runs immediately.

Figure 6-12 Schedule agent deployment
5. On the Servers panel, the agent deployment job is displayed as shown in Figure 6-13.

Figure 6-13 Deploying the agent
When the deployment completes, the agent is ready to start collecting data as shown in Figure 6-14.
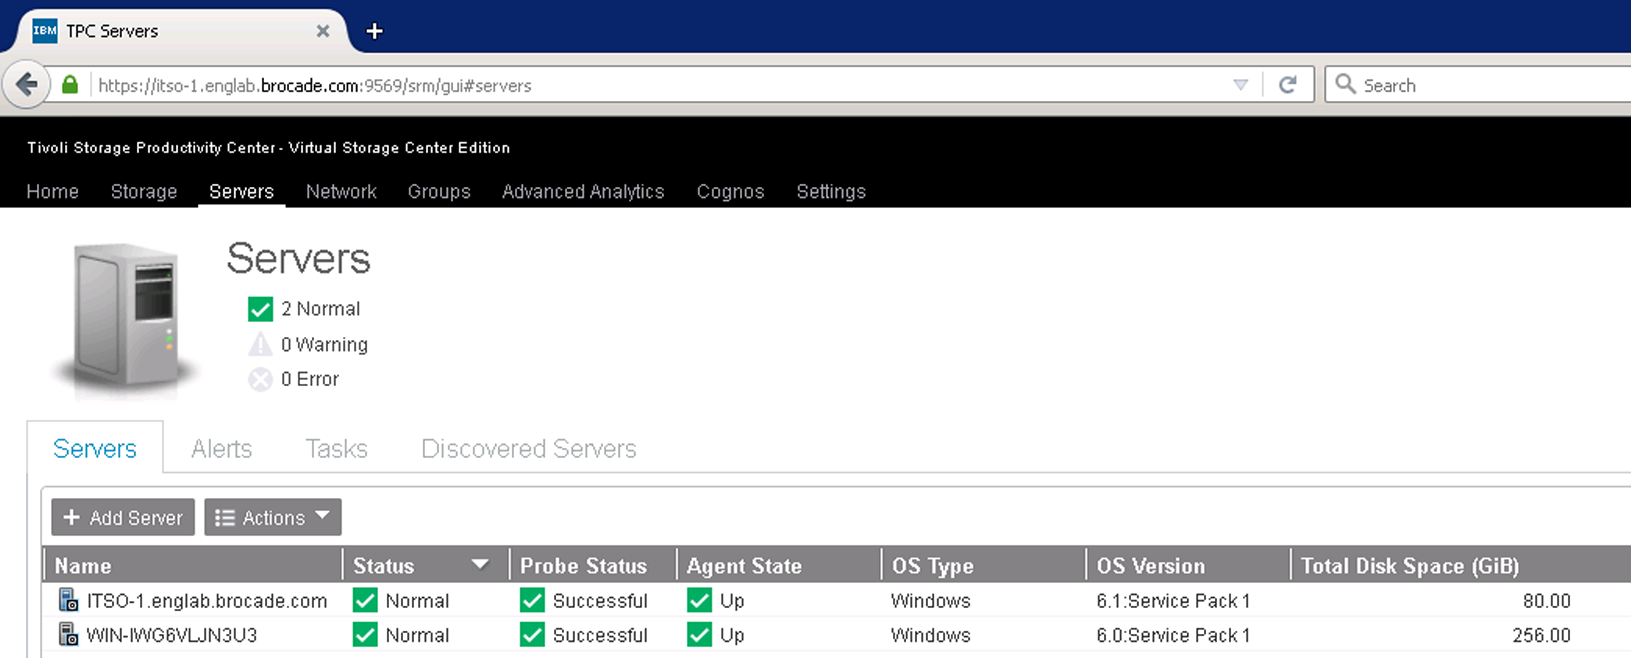
Figure 6-14 Agent successfully deployed
|
Note: If there are any issues with the agent deployment, you can take action immediately by right-clicking the deployment and opening the following pane as shown in Figure 6-15.
|

Figure 6-15 Failed agent deployment
|
Note: For Tivoli Storage Productivity Center V5.2, the Storage Resource agents that are installed with the Tivoli Storage Productivity Center server have the Fabric function disabled. This configuration is used because of potential fabric or switch firmware defects. In the past, it has been observed with products other than Tivoli Storage Productivity Center, that certain in-band fabric commands can cause a switch with a firmware defect to hang or reboot.
When Tivoli Storage Productivity Center does its initial probes, it might cause such an error in both fabrics at the same time, which can cause a large impact. Turning off the Fabric function prevents this scenario because you have the opportunity to schedule the probes so they do not run at the same time.
|
For more information about the Storage Resource agent deployment and limitations, see the following Tivoli Storage Productivity Center documentation link in the IBM Knowledge Center:
Self-discovered switches and fabrics
During the Storage Resource agent’s first probe run and in addition to the host-related server information, the agent will retrieve information pertaining the switches and fabrics where the server is connected.
When the Storage Resource Agent probe run is complete, the switches and fabrics will be automatically added to the Switches and Fabrics views of Tivoli Storage Productivity Center, as shown in Figure 6-16.

Figure 6-16 Storage Resource agent self discovered switches
To retrieve the complete information of your switches and fabrics, start each switch’s configuration probe as shown in Figure 6-17.

Figure 6-17 Start the switch configuration probe
6.5 Testing connectivity for a switch
To list and test the multiple connections for a switch, complete the following steps:
1. Select Network on the IBM Spectrum Control top menu, then select Switches.
2. In the Switches view, right-click the switch that you want, then select Connections and finally Test Connection. The multiple connections to that device will be listed as shown in Figure 6-18. To test any of these connection methods, click the one that you want.
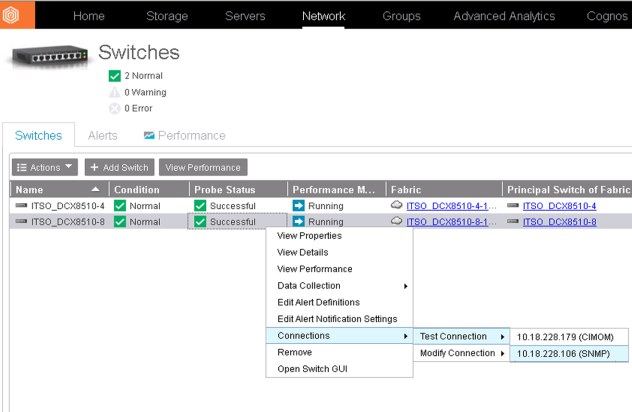
Figure 6-18 Switch connections list and test
The connection test’s results are displayed, as shown in Figure 6-19.

Figure 6-19 Switch connection test results
6.6 Enabling the switch performance monitoring
If you did not configure the Performance Monitoring data collection at the time the switch device was added, you can do so at any time. To configure collection, follow the procedure that is described below, when the configuration data collection probe completes the first discovery run.
|
Note: Depending on the connection agents defined for the switch, Performance Monitoring might not be able to be enabled. Review Table 6-1 on page 144 to ensure that the available agents support this functionality.
|
To configure and enable Performance Monitor data collection, complete the following steps:
1. Select Network on the IBM Spectrum Control top menu, then select Switches.
2. In the Switches view, right-click the wanted switch, then select Data Collection and then Schedule. The data collection schedule configuration window is displayed as shown in Figure 6-20.

Figure 6-20 Data collection schedule configuration window
3. Click the drop down menu and enable the Performance monitor schedule, then select the sampling interval.
|
Note on collected samples: IBM Spectrum Control records performance statistics in a form of samples. Each sample is composed of the actual metric’s value and a time stamp. The interval selection in the Performance monitor schedule represents the interval by which IBM Spectrum Control will generate a sample by averaging the performance data values that are gathered throughout that interval. The time stamp that is assigned to the sample represents the time that this averaging was done.
|
4. Click Save.
5. The result of the scheduling action appears, as shown in Figure 6-21.
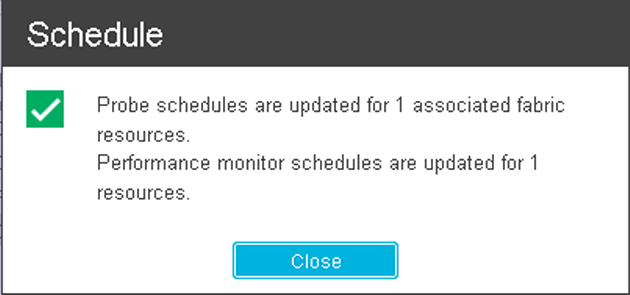
Figure 6-21 Performance monitoring scheduling confirmation
6. In the Switches view, the new Performance Monitor Status for your switch should be Running, as shown in Figure 6-22.
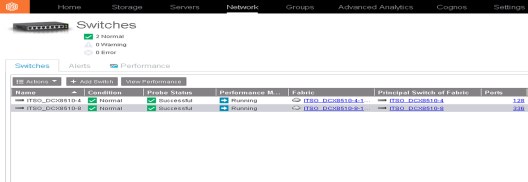
Figure 6-22 Performance monitor status shown as running
6.6.1 Troubleshooting Performance Monitor data collection problems
Sometimes, the performance monitor data collection might be affected by problems that are related either with internal IBM Spectrum Control components, external switch components, or communication agents (SMI or SNMP) components. This situation will be reflected in the Performance Monitor Status under the IBM Spectrum Control Switches view.
Any status other than Running must be diagnosed. In order to access the Performance Monitor Logs, complete the following steps:
1. Select Network on the IBM Spectrum Control top menu, then select Switches.
2. In the Switches view, right-click the switch you are interested in, then select Data Collection and then Open Performance Monitor Logs, as shown in Figure 6-23.
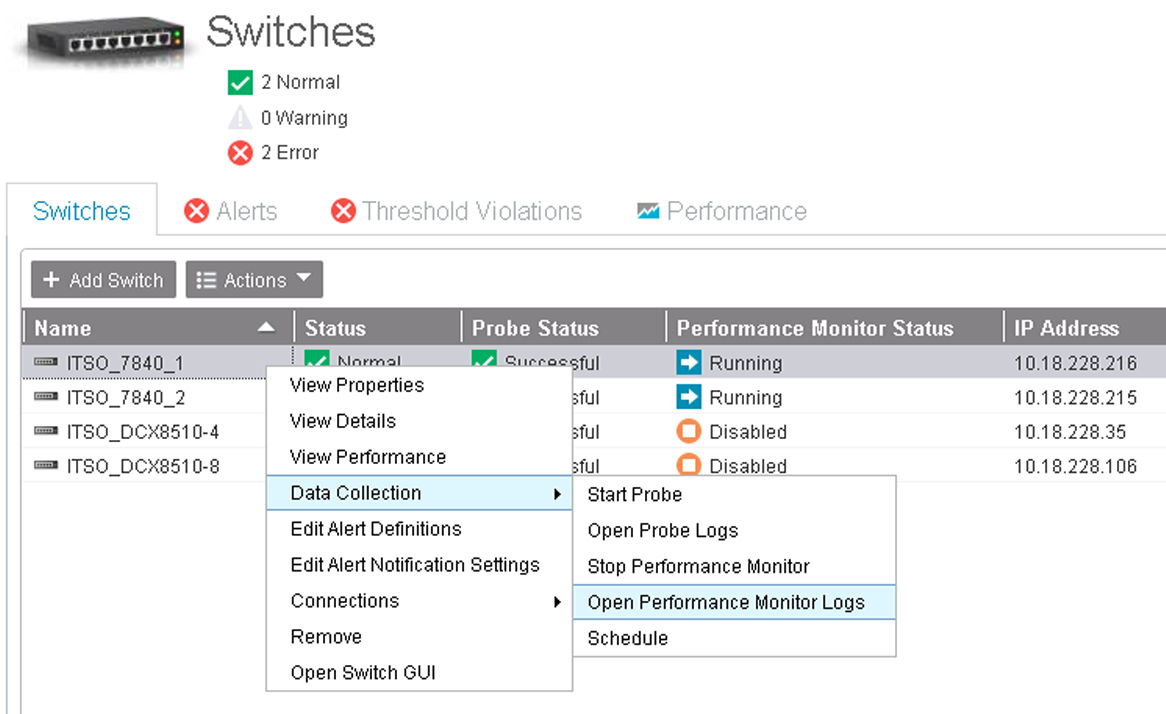
Figure 6-23 Opening performance monitor logs
3. A new window appears with all the performance monitor log entries for the selected switch device, as shown in Figure 6-24.
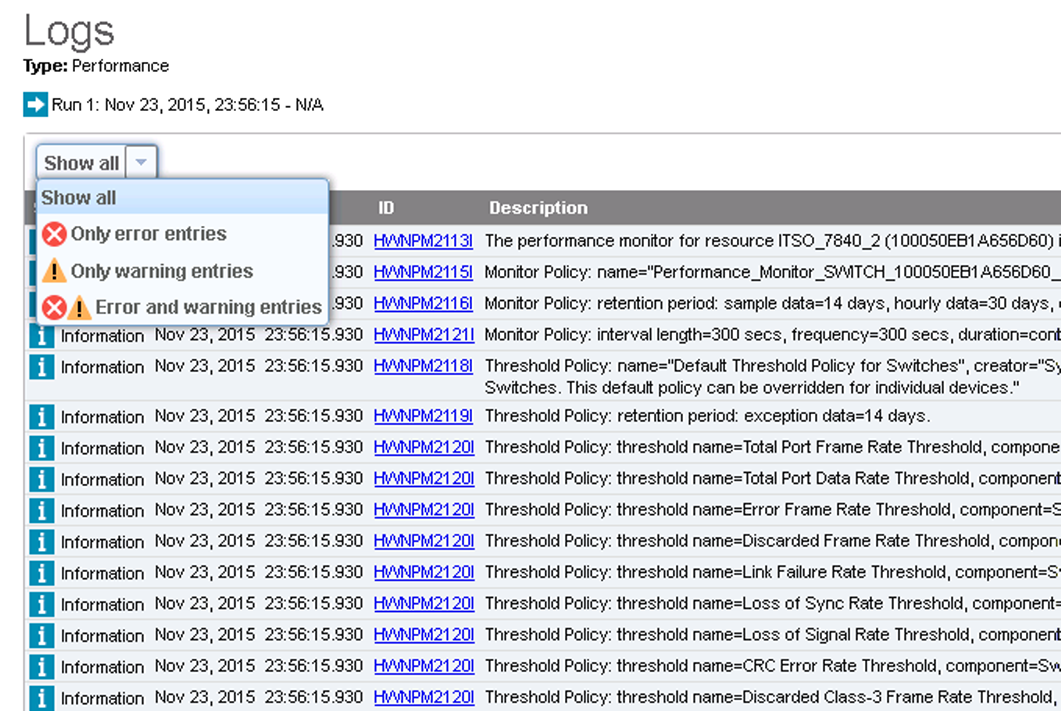
Figure 6-24 Performance monitor log window
The default window displays all of the performance monitor log entries. If you want to display errors, warnings, or both, you can apply the filter by clicking the filtering drop-down menu at the top left corner of the window, as shown in Figure 6-24 on page 162.
For information about errors in the performance monitor log, see the IBM Spectrum Control documentation in the IBM Knowledge Center at the following link:
6.7 Viewing Switches and Fabrics details
After the switch devices are successfully added to the IBM Spectrum Control instance and the probe has completed the corresponding switch and fabric discovery process, you can view the detailed information about the components and resources that are associated with a fabric or a switch.
6.7.1 Viewing fabric details
To access the fabric details, complete the following steps:
1. Select Network in the IBM Spectrum Control top menu, then select Fabrics.
2. In the Fabrics view, right-click the wanted fabric and then select Details, as shown in Figure 6-25.

Figure 6-25 Showing fabric details
3. The fabric details main view will appear, as shown in Figure 6-26.
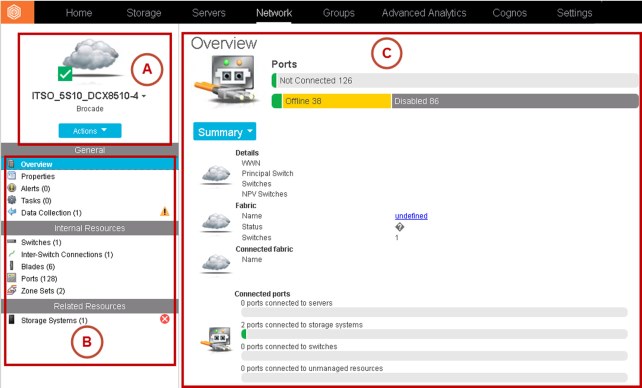
Figure 6-26 Fabric details main view
The upper left corner (region A of the view) shows the fabric’s name. Click Actions to open a list of available actions for the fabric. You can also click the fabric’s name to list of all of the fabrics that are managed by IBM Spectrum Control. If you select one of them, the window switches to the details view for this new fabric.
The left section of the view (region B) allows you to browse between different components and resources that are associated with the fabric. Each time that you click any of these items, the associated information will be presented in region C of the view.
The components and resources are grouped into three main sections:
1. General
The items in this section present key information about the fabric.
– Overview: When selected, this section presents you with multiple views displayed on the region C of the window that provide the user a quick insight of the overall fabric health and behavior. The default view selection is Summary. Figure 6-27 shows the Overview section.

Figure 6-27 Main view of the Overview section
To switch between these views, click the view’s name to select a different one. Figure 6-2 describes each of the available views of the Overview section.
Table 6-2 Available views in Overview section
|
View
|
Description
|
|
Summary
|
Shows the following information about the fabric:
•WWN: The World Wide Name (WWN) of the fabric.
•Principal Switch of Fabric: The name of the principal switch of the fabric at the time when the fabric was last probed.
•Switches: The number of physical and virtual switches in the fabric.
•NPV Switches: The number of Cisco switches in N_Port Virtualization (NPV) mode that are connected to the fabric.
•Ports: The total quantity of ports that are connected to servers, switches, storage systems, and unmanaged resources.
|
|
Most Problematic Switches
|
Use the Most Problematic Switches view for visual summary of the switches with the largest number of errors.
To switch between the error information for the last hour, last day, and last week, click the arrows icons next to the displayed period of time. Use the chart to quickly determine the switches with the largest number of errors and the types of errors that occurred. For more information, hover over areas in the charts.
|
|
Most Problematic Ports
|
Use the Most Problematic Ports view for visual summary of the switch ports with the largest number of errors.
|
|
Most Pervasive Errors
|
Use the Most Pervasive Errors section view for a visual summary of the types of errors that occur most frequently in the fabric. Each bar in the chart displays the total number of a type of error that occurred on all ports in the fabric.
|
|
Most Active Switches
|
Use the charts to view performance information for the most active switches in the fabric:
•Overall Bandwidth Percentage: A historical performance chart that shows the top six switches with the highest overall bandwidth percentage in the fabric. Each switch is represented by a line on the chart.
•Total Data Rate: A historical performance chart that shows the top six switches with the highest data rate in the fabric.
•Total Frame Rate: A historical performance chart that shows the top six switches with the highest frame rate in the fabric.
|
|
Most Active Ports
|
Use the charts to view performance information for the most active ports in the fabric:
•Overall Bandwidth Percentage: A historical performance chart showing the top six ports with the highest overall bandwidth percentage in the fabric. Each port is represented by a line on the chart.
•Total Data Rate: A historical performance chart that shows the top six ports with the highest data rate in the fabric.
•Total Frame Rate: A historical performance chart that shows the top six ports with the highest frame rate in the fabric.
|
|
Note: The charts show data collected hourly for the last 24 hours. If the chats are blank, ensure that the performance data collection for the fabrics is working.
|
To view different charts, click the name of a chart and select the chart that you want to view. Click the arrow icons on charts to switch between the different charts that are available for each chart type.
You can display multiple charts of the same type in different positions on the view. For example, you can display the Total Frame Rate and Total Data Rate charts for the Most Active Ports chart type at the same time in different positions on the view.
The selected charts are automatically displayed in the same positions the next time that you log on to the GUI and view the details of the resource.
– Properties: Displays the attributes of the fabric, including information about its status and connectivity, as shown in Figure 6-28.

Figure 6-28 Main view of the Properties section
– Alerts: Allows you to display and manipulate the alerts definitions for the fabric. Figure 6-29 shows the Alerts section main view.
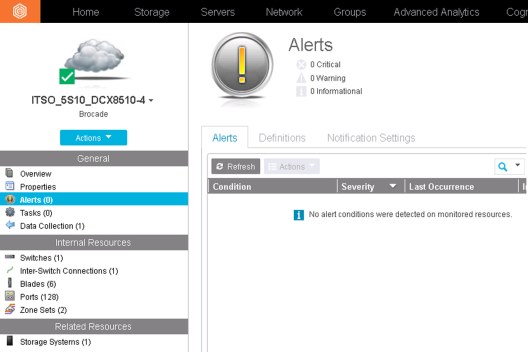
Figure 6-29 Main view of the Alerts section
Table 6-3 describes the three main tabs in this section; Alerts, Definitions, and Notification Settings.
Table 6-3 Alerts section
|
Tab
|
Description
|
|
Alerts
|
Shows the alerts that are generated when certain conditions are detected on a fabric, conditions which are specified on the Definitions tab
|
|
Definitions
|
View and edit the alert definitions for a fabric. An alert definition includes a triggering condition and the notification settings for that condition.
In general, the following types of conditions can trigger alerts:
•Data collection was not successful
•A change occurred in the configuration of a fabric
|
|
Notification Settings
|
View and edit the notification settings when alert conditions are detected on a fabric. These notification settings are applied globally to all the alert definitions in the Definitions tab. You can override the global settings by specifying different settings for each alert definition on the Definitions tab.
|
– Tasks: Enables you to view and manage the tasks that IBM Spectrum Control runs on the fabric, such as new zones creation during the block storage capacity provisioning. Figure 6-30 shows the Tasks main view.

Figure 6-30 Main view of the Tasks section
– Data Collection: Presents information about the different data collection jobs for the fabrics in your environment. You can view the status of the most recent run of a probe, start a probe run, schedule a probe, and view the logs for all the probe runs, as shown in Figure 6-31.

Figure 6-31 Main view of the Data Collection section
•Internal resources
Internal resources are all the components that exist in a fabric. Components that you can view include switches, inter-switch connections, blades, ports, and zone sets:
– Switches: To view information about the switches in the fabric, click Switches. The Switches section is displayed as shown in Figure 6-32. The number in parentheses shows the number of switches in the fabric.
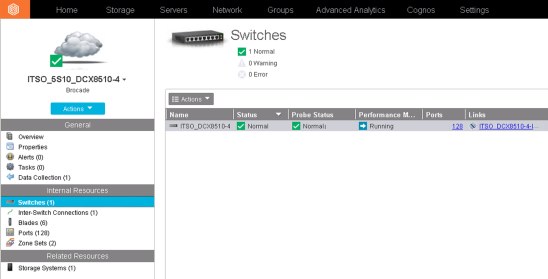
Figure 6-32 Internal resources - Switches section
– Inter-switch Connections: To view information about inter-switch connections, click Inter-Switch Connections. The number in parentheses shows the number of inter-switch connections that are associated with the fabric.
This section includes the following types of connections: Inter-switch link (ISL), ISL trunk, NPV link, and inter-chassis link (ICL) trunk.
The status values help you to decide whether you need to investigate or resolve issues with inter-switch connections. ISL trunks and ICL trunks have a warning status if less than half of the links have a port that has an error status. ISL trunks also have a warning status if half or more than half of the links have ports that have a warning status.
– Blades: Shows information about the switch blades that are associated with the fabric, as shown in Figure 6-33:
• Port Range: The range of ports for the ports that are components of the blade. For example, 0-15, 16-31. This value represents the port index relative to the switch, not the port numbers relative to the blade.
• Ports: The number of switch ports on a blade.
• Slot: The physical slot on a switch to which a blade is attached.
• Status: The status of a blade. Statuses include Normal, Warning, Error, Unreachable, and Unknown. Use the status to determine the condition of a blade, and if any actions must be taken. For example, if a blade has an Error status, take immediate action to correct the problem.

Figure 6-33 Main view of the Blades section
– Ports: Shows information about all of the ports that are related to the fabric, as shown in Figure 6-34.

Figure 6-34 Main view of the Ports section
– Zonesets: Shows information about all the zonesets in the fabric, whether they are active or inactive, as shown in Figure 6-35.
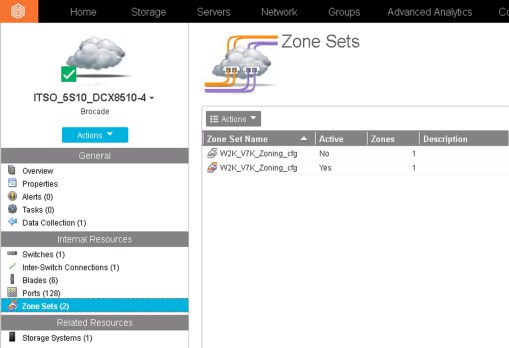
Figure 6-35 Main view of the Zone Sets section
•Related resources
This section displays information about resources that are related with the fabric. These resources include servers, storage systems, hypervisors, and resources that are not monitored but are associated, such as Discovered ports. Discovered ports are ports on resources that are not monitored by IBM Spectrum Control but are visible to a monitored fabric.
6.8 Zoning
In addition to the fabric and switches monitoring capabilities of IBM Spectrum Control, you can enable the automatic zoning feature through the web-based GUI. When automatic zoning is enabled, new zones will be created during the block storage provisioning tasks if new zones are needed to connect the storage system with the server. When you set the zoning policy, you can specify whether zone changes from automatic zoning are made to the active zone set, or to a new inactive active zone set.
6.8.1 Non-standard zones
B-type switches support some nonstandard zones such as quick loop zones, fabric assist zones, and protocol zones. If the switch configurations have these zones already defined, Fabric Manager preserves them and does not modify them in any way. If they are part of a zone set that is active at some time, the devices that are part of such zones that are also online are displayed in the topology Zone View.
You can create, change, and delete nonstandard zones by using the b-type switch management applications, like Web Tools or IBM Network Advisor.
|
Note: In IBM Tivoli Storage Productivity Center releases 5.1 and earlier, the stand-alone GUI allowed the user to manipulate the zoning (create, modify, and remove aliases, zones, and zonesets) through the Fabric Manager. This method provided an alternative to the devices management tools (such as Web Tools or IBM Network Advisor). In IBM Spectrum Control, this functionality is no longer available. IBM Spectrum Control can modify the fabric zoning only by using the automatic zoning feature during the storage provisioning task.
|
6.8.2 Zone control capabilities of IBM Spectrum Control
Table 6-4 shows the zone function capabilities of IBM Spectrum Control when managing b-type switches. Not all activities that are available with the switch management application are available in IBM Spectrum Control.
Table 6-4 IBM Spectrum Control zoning capabilities for b-type switches
|
Capability
|
Support
|
|
Zone control through Storage Resource Agent supported
|
No
|
|
Zone control through out-of-band SNMP agent supported
|
No
|
|
Zone control through CIMOM agent supported
|
Yes
|
|
Domain/port zone members allowed
|
Yes
|
|
Port WWN zone members allowed
|
Yes
|
|
Node WWN zone members allowed
|
Yes
|
|
FCID zone members allowed
|
No
|
|
Zone Aliases supported
|
Yes
|
6.8.3 Setting the zoning policy (automatic zoning feature)
The IBM Spectrum Control automatic zoning feature is disabled by default, meaning that only storage systems with connectivity to the server requiring the capacity are candidates for provisioning.
To enable the automatic zoning feature, you need to define a zoning policy. When automatic zoning is enabled, IBM Spectrum Control can create zones during block storage provisioning to connect a server to a storage system.
When IBM Spectrum Control creates a provisioning task, it identifies the best location for the new storage that satisfies the requirements of the service class. If automatic zoning is enabled, then, during provisioning, existing zones are used if the server already has connectivity to the storage system. Otherwise, the required zone or zones are created between a host initiator ports and the storage controller ports.
To enable the zoning policy, complete the following steps:
1. Select Advanced Analytics on the IBM Spectrum Control top menu, then select Provisioning. The provisioning dialog will appear as shown in Figure 6-36.

Figure 6-36 Setting the zoning policy
Click Set Zoning Policy.
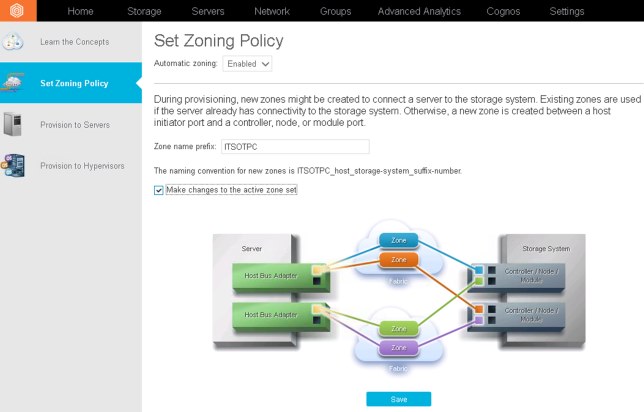
Figure 6-37 Zoning policy configuration
When it is enabled, IBM Spectrum Control can create zones during storage provisioning, if required.
|
Note: The naming convention for the zones to be created will be prefix_host_storage-system_suffix-number.
|
When you enable automatic zoning, you can specify the following options:
– Zone name prefix: If you specify a zone name prefix, all zones that are automatically created are prefixed with your input. This prefix can help you identify which zones were automatically created by IBM Spectrum Control when reviewing your fabric.
– Make changes to the active zone set: Whether changes are made to the active zone set, or to a new inactive active zone set. If this check box is selected, changes are made to the active zone set. If the check box is cleared, changes are made to the inactive zone set. The new inactive set will contain only the new zones.
Figure 6-38 Changes successfully saved
For more information about zoning and storage provisioning tasks, see the IBM Spectrum Control documentation in the IBM Knowledge Center at the following link:
Additionally, you can see the User and Administrator guides, which can be found at the following link:
6.9 Alerting
You can use IBM Spectrum Control to monitor your b-type switches and to automatically notify you whenever a switch resource changes its condition or violates a performance threshold. The conditions that generate alerts are detected during the data collection and event processing. You can customize which alert will trigger a notification, and in some cases like the performance thresholds violations, you will be required to enter values for triggering such alerts.
When an event occurs and triggers an alert, the alert is written to the IBM Spectrum Control log. You can also select one or more other ways to be notified of the event. These alerts notifications include SNMP traps, IBM Tivoli Enterprise Console® events, entries in Windows event log or UNIX syslog, and emails.
6.9.1 Prerequisites for using alerts
To successfully use the IBM Spectrum Control alerting feature, the following conditions must be met:
•Data collection schedules must be configured and scheduled to run regularly. Additionally and to detect performance thresholds violations, the performance monitors must be running to collect performance data from your switches.
•If you want to be notified about an alert in some way other than an entry in the IBM Spectrum Control log and display in the Web GUI, such as using SNMP traps, Tivoli Enterprise Console events, or email notifications, you must configure those alert destinations beforehand.
•If an alert is triggered based on an SNMP trap from the monitored switch, you must properly configure the SNMP server of the monitor resource to enable IBM Spectrum Control to listen to SNMP traps. The default port number is 162, and the default community is public.
6.9.2 Setting up the alert notification settings
To configure the IBM Spectrum Control alert notification settings that will be used by default by the monitored resources, complete the following steps:
1. Select Settings on the IBM Spectrum Control top menu, and then select Alert Notifications. The alert notifications settings window will be displayed, as shown in Figure 6-39.
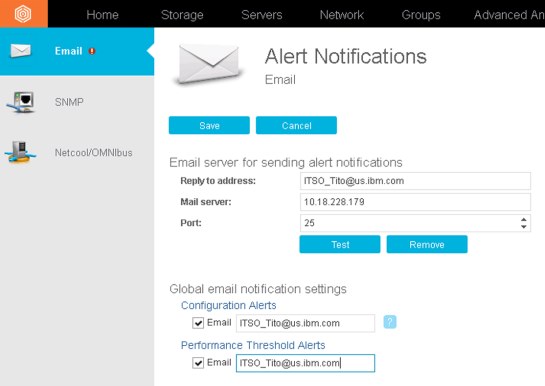
Figure 6-39 Alert notification settings window
2. Enter the email server values to be used for sending alert notifications:
– Reply to address: If a user replies to an email that was triggered by an alert, the reply is sent to this email address. This email address also receives any undeliverable email messages for alerts that are configured with incorrect or invalid email address.
– Mail server: The name of the mail server to use. You can specify a host name, an IPv4 address, or an IPv6 address.
– Port: The port number for the outgoing SMTP (email) server. The default SMTP server listening port is 25.
3. When all of the email server values are entered, test the communication by clicking Test. You will need to provide an email address to send the email test to.
4. Set the global email notification settings. The email addresses that you define to receive alert notifications are applied globally to all alert definitions and all resources (like switches), unless they are specifically overridden. You can later configure a different notification method for a specific resource or set of resources by overriding these global settings when editing the resource alerts definitions. For more information, see “Override the default notification settings” on page 181.
6.9.3 Enabling the default alert definitions
Enabling the default alert definitions for your b-type switches allows you to be automatically notified when certain predefined conditions are detected.
To enable these alerts, complete the following steps:
1. Select Network on the IBM Spectrum Control top menu, and then select Switches.
2. In the Switches view, right-click the switch that you want, and then select Edit Alerts Definitions, as shown in Figure 6-40.

Figure 6-40 Editing alert definitions
As you can see in Figure 6-41, there are three categories of alerts: Switches, Inter-Switch Connections, and Ports. Each one of these categories has a set of predefined alerts that can be enabled for quick and easy use of switch alerting capabilities. You can also customize these alerts definitions for alignment with your alerting needs (see 6.9.4, “Custom alert definitions” on page 179).
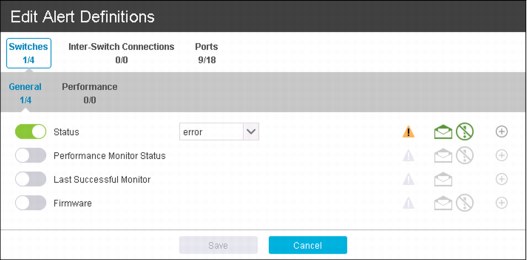
Figure 6-41 Editing alert definitions: General condition alerts
3. Click Cancel to close the dialog. The default alerts for the switch are automatically enabled after you access the Edit Alert Definitions window.
6.9.4 Custom alert definitions
You can customize your alerting environment by enabling all of those additional alerts that are not enabled by the default alert definitions. To enable these alerts, complete the following steps:
1. Open the Edit Alert Definitions window as shown in Figure 6-41.

Figure 6-42 Custom alert definitions
2. Modify (enable or disable) the wanted alert by switching the green switch A (see Figure 6-42) on or off.
3. If the alert was enabled, configure the threshold values by which this alert will be triggered. Click the C button (see Figure 6-42 on page 179) and the alert threshold configuration pane will be presented, as shown in Figure 6-43.
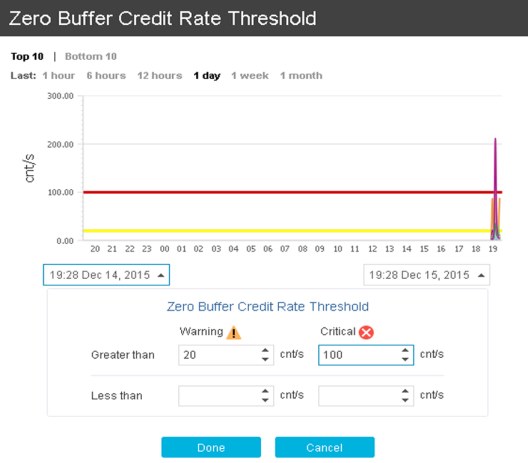
Figure 6-43 Editing the custom alerts thresholds
4. Input the wanted threshold values by which you want IBM Spectrum Control to trigger both the Warning and Critical alerts. If any information is already available for the alert that you are configuring, that information will be charted above your threshold fields. Consider this effect when you define your threshold values.
5. When you are satisfied with your input, click Done to go back to the main Edit Alert definitions page.
6. Repeat steps 2 - 5 for each alert that you want to customize. When you are done, click Save to commit and enable your changes to the alerting definitions.
7. You can also modify the severity of each specific alert, allowing you to align them according to your own organization’s needs. In order to do so, click the Severity icon, as shown in Figure 6-44.
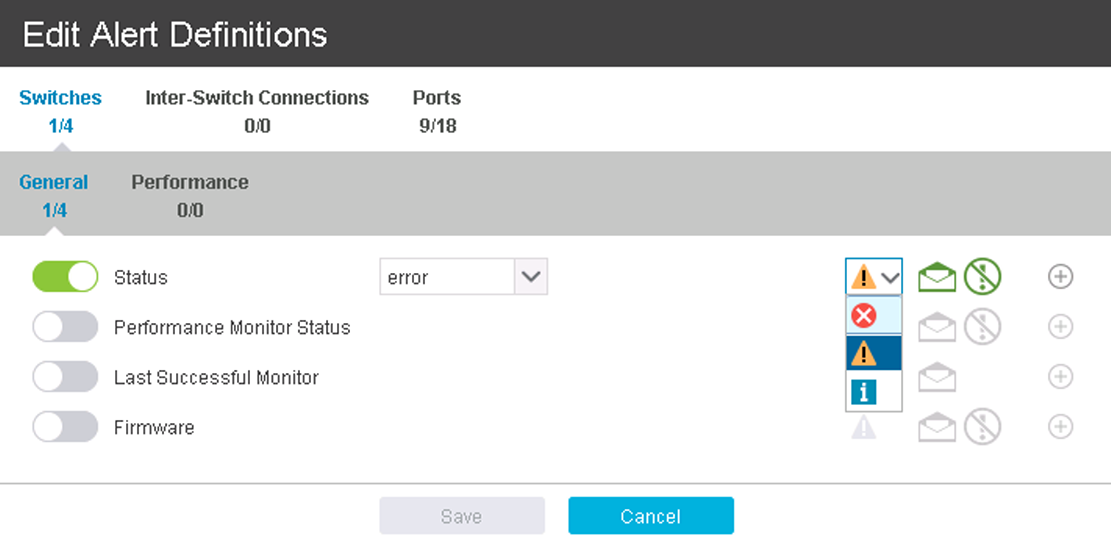
Figure 6-44 Changing the alert severity
Select the alert severity that you want based on the guidelines that are shown in Figure 6-45 and click Save.
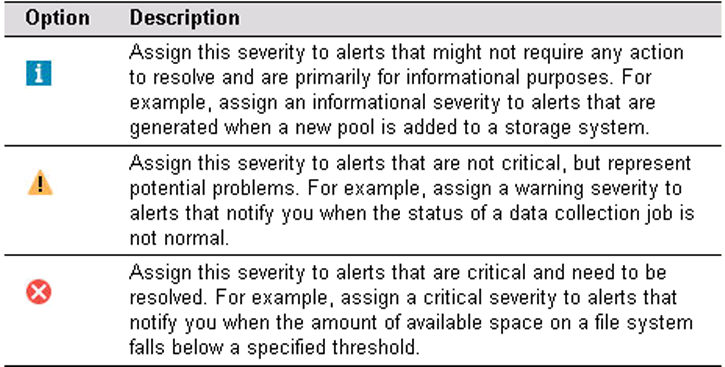
Figure 6-45 Alerts severity guidelines
Override the default notification settings
In some situations, you might want to have specific notification settings for a particular switch alert instead of using the global notification settings (see 6.9.2, “Setting up the alert notification settings” on page 176).
To override the default notification settings, complete the following steps:
1. While editing the alerts definitions, click the B button (see Figure 6-42 on page 179) and the alert notification settings for that particular alert and switch will be presented, as shown in Figure 6-46.

Figure 6-46 Overriding the default notification settings for an alert
2. Select Override notification settings to enable the additional configuration fields.
3. Modify the notification settings as desired. If you are setting an email address, you can also click Customize to customize the email’s subject. If you select the IBM Netcool® option, ensure that the Netcool EIF probe’s IP address is already configured under IBM Spectrum Control settings.
4. When you are satisfied with your input, click Done to go back to the main Edit Alert definitions page.
5. Repeat steps 1 - 4 for each alert you want to customize and, when you are done, click Save to commit and enable your changes to the alerting definitions.
Suppressing alerts
In some scenarios, you might want to have some control over the conditions during which the alert is triggered, beyond the thresholds definitions. In order to do so, complete the following steps:
1. While editing the alerts definitions, click the D button (see Figure 6-42 on page 179) and the alert custom suppression settings for that particular alert and switch will be presented, as shown in Figure 6-47.
.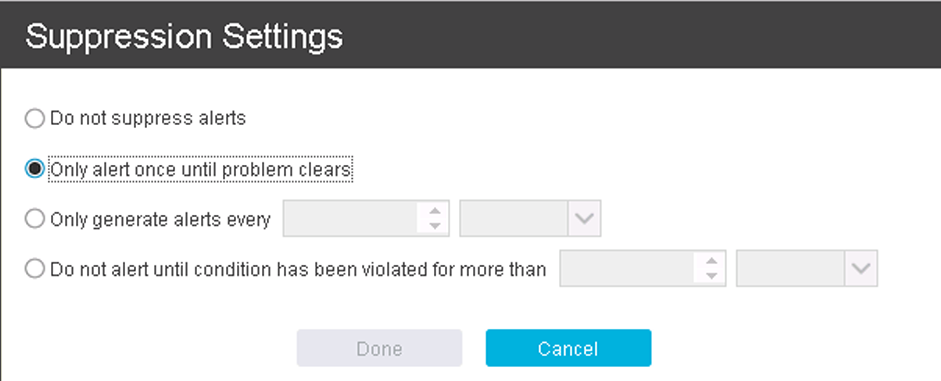
Figure 6-47 Setting alerts suppression conditions
2. Modify the wanted notification settings. The following options are available:
– If you want to receive alert notifications on every detected alert violation, select Do not suppress alerts.
– Only alert once until problem clears will notify you once whenever a new alert violation is detected and will discard future alerts about the same condition.
– If you want to receive an alert notification only once and discard the following violations for a certain period, select Only generate alerts every. A new alert notification will be triggered when the defined time period ends, considering the time of the first alert occurrence as the start time.
– Use the Do not alert until condition has been violated for more than option to define a time period for which you will allow this violation to occur until an alert is sent. For example, you might want to be notified about a specific resource high utilization condition, but only when that condition has exceeded a certain amount of time.
3. When you are satisfied with your input, click Done to go back to the main Edit Alert definitions page.
4. Repeat steps 1 - 3 for each alert that you want to customize. When you are done, click Save to commit and enable your changes to the alerting definitions.
6.9.5 Managing and acknowledging alerts
Some alerts are triggered by conditions that commonly occur and can be ignored. The context of the environment (applications, servers, business, users, and so on) can determine that an alert that might be meaningful for some is not for another. In such cases, you can acknowledge these alerts to indicate that they were reviewed and do not require immediate resolution. By acknowledging alerts, you can more quickly identify other alerts that must be reviewed and resolved.
To manage and acknowledge alerts, complete the following steps:
1. Select Network on the IBM Spectrum Control top menu, and then select Switches.
2. In the Switches view, click the Alerts tab. The Alerts main window is displayed as shown in Figure 6-48.
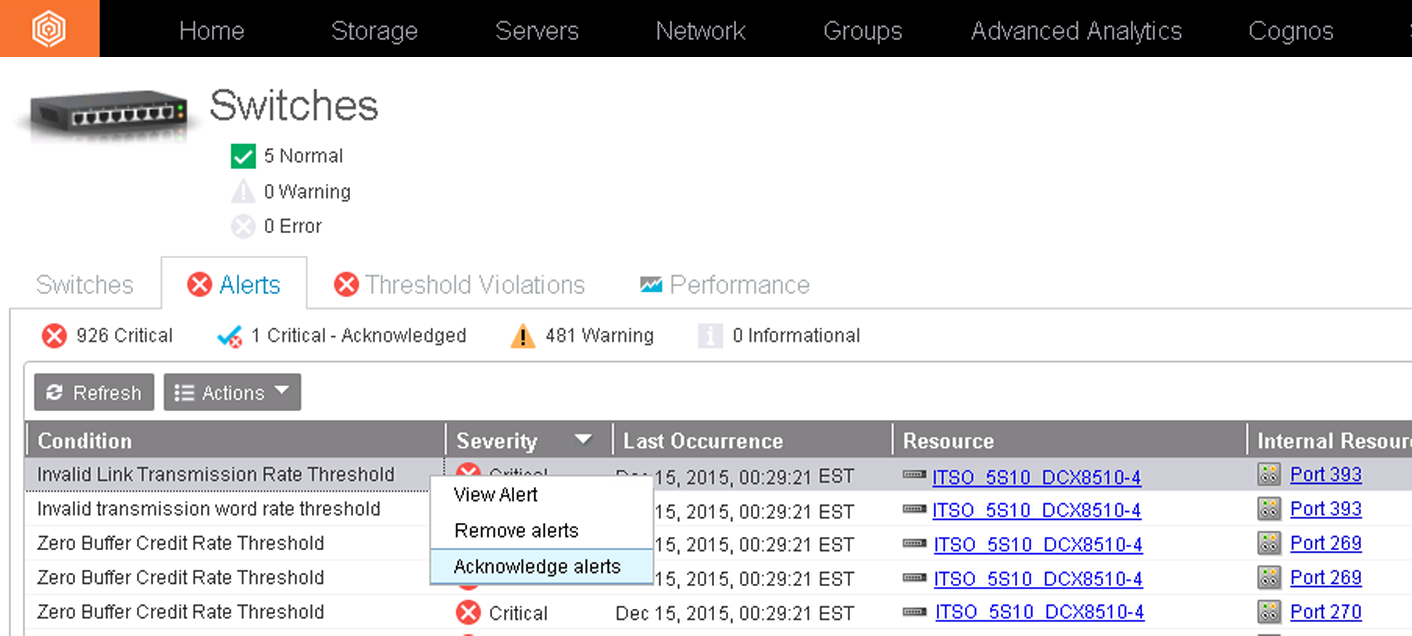
Figure 6-48 Managing alerts
3. To acknowledge an alert, right-click the alert and select Acknowledge alerts. The alert will be removed from the list.
For more information about alerting, see the IBM Spectrum Control documentation in the IBM Knowledge Center at the following link:
Additionally, you can refer to the User and Administrator guides that at the following link:
6.10 Performance monitoring
IBM Spectrum Control can collect information about the performance of your switches. This information includes key performance metrics and notifications of threshold violations that can help you identify and troubleshoot issues in your fabrics.
Before you review the performance of your devices, you must complete the following tasks:
•Add your switches to IBM Spectrum Control to enable the switch monitoring and schedule the data collection task (see 6.4, “Adding switches and fabrics” on page 148)
•Ensure that performance data is being collected (see 6.6, “Enabling the switch performance monitoring” on page 160)
•Optionally, configure the performance alerting by defining the corresponding alerts thresholds (see 6.9, “Alerting” on page 175)
6.10.1 Performance thresholds violations review
Similarly to the way the Alerts are displayed on a centralized view (see Figure 6-48 on page 184), IBM Spectrum Control allows you to review and manage all the performance thresholds violations by using the Thresholds Violations centric view. This view enables you to quickly identify potential issues on your fabric and giving you a start point for your more complex troubleshooting investigations. In order to access this view, complete the following steps:
1. Select Network on the IBM Spectrum Control top menu, and then select Switches.

Figure 6-49 Managing Threshold Violations
6.10.2 Performance review
In order to review and troubleshoot the performance of your switches, complete the following steps to access the IBM Spectrum Control Performance view:
1. Select Network on the IBM Spectrum Control top menu, and then select Switches.
2. In the Switches view, click the Performance tab. The Performance view is displayed as shown in Figure 6-50.

Figure 6-50 Performance view
|
Note: You can also access the performance view by selecting a switch on the main Switches view, right-clicking the switch that you are interested in, and then selecting View Performance. With this method, you only work with the performance of that selected switch.
|
3. By default, the main window displays charts the default switch metrics (Total Data Rate) for all of the switches. From here, you can start your troubleshooting by changing the display parameters according to your needs:
a. Switch chart performance metrics: Select the metrics to be displayed on the chart by clicking the Metrics icon (the plus sign). Figure 6-51 shows the available metrics for selection. When you are done, click OK.

Figure 6-51 Selecting performance chart metrics
b. Resources: By default, the performance view is loaded with all of the resources (switches) preselected, meaning all of them will be charted simultaneously. You can select a single switch under the Resources pane to chart only the performance metrics for that particular switch, as shown in Figure 6-52. To select multiple switches, press and hold the Ctrl key while you are selecting the resources that you want.

Figure 6-52 Single resource performance chart
c. Time range: You can select the time range for the metrics to be charted by clicking either of the two time stamps on the bottom sides of the chart.
d. Data resolution: By default, the charts are generated with a data resolution value of Sample, which means each value that is charted corresponds to a performance data collection sample for that switch device. The granularity of the samples is defined at the time that the Performance Data Collection is configured for each switch device. By default, IBM Spectrum Control collects 1-minute samples. However, this value can be changed, which affects the representation of the samples on the performance charts. Other possible values for Data Resolution are Hourly and Daily, in which cases they represent samples average values for each hour and day.
4. By manipulating the three icons in the upper right corner of the chart, you can do the following tasks:
– Toggle the metrics display between chart (default) and table.
– Export the information to a CSV file.
– Open the Performance view tab on a separate window (detach).
For more information about performance monitoring, see the IBM Spectrum Control documentation in the IBM Knowledge Center at the following link:
Additionally, you can refer to the User and Administrator guides that can be found at the following link:
..................Content has been hidden....................
You can't read the all page of ebook, please click here login for view all page.