
Measurement systems
1.1.1 Transducers
Of most interest are the physical properties and performance characteristics of a transducer. Some examples are given below:
| Property | Method of measurement |
| Strain | Strain gauge, a resistive transducer whose resistance changes with length. |
| Temperature | Resistance thermometer, thermocouple, thermister, thermopile. |
| Humidity | Resistance change of hygroscopic material. |
| Pressure | Movement of the end of a coiled tube under pressure. |
| Voltage | Moving coil in a magnetic field. |
| Radioactivity | Electrical pulses resulting from ionisation of gas at low pressure. |
| Magnetic field | Deflection of a current carrying wire. |
Performance characteristics
A consideration of these characteristics influences the choice of transducer for a particular application. Further characteristics which are often important are the operating life, storage life, power requirements and safety aspects of the device as well as cost and availability of service.
In industrial situations, the property being measured or controlled is called the controlled variable. Process control is the procedure used to measure the controlled variable and control it to within a tolerance level of a set point. The controlled variable is one of several process variables and is measured using a transducer and controlled using an actuator.
1.1.2 Methods of measurement
All measurements involve a comparison between a measured quantity and a reference standard. There are two fundamental methods of measurement:
Deflection method
• Deflection from zero until some balance condition achieved
• Limited in precision and accuracy
• Loading (transducer itself takes some energy from the system being measured)
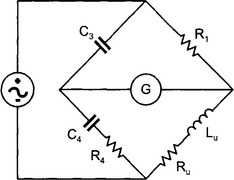
An unknown component is inserted into the bridge and the values of the others are altered to achieve balance condition.
Deflection method:Moving coil voltmeter.
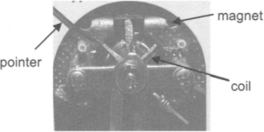
Although such a meter is designed to have a very high internal impedance, it has to draw some current from the circuit being measured in order to cause a deflection of the pointer. This may affect the operation of the circuit itself and lead to inaccurate readings – especially if the output resistance of the voltage source being measured is large.
1.1.3 Sensitivity
An important parameter associated with every transducer is its sensitivity. This is a measure of the magnitude of the output divided by the magnitude of the input.
The output voltage of most transducers is in the millivolt range for interfacing in a laboratory or light industrial applications. For heavy industrial applications, the output is usually given as a current rather than a voltage. Such devices are usually referred to as “transmitters” rather than transducers.
In most applications, the chances are that the signal produced by the transducer contains noise, or unwanted information. The proportion of wanted to unwanted signal is called the signal-to-noise ratio or SNR (usually expressed in decibels)
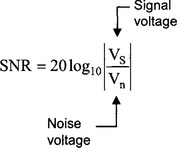
The higher the SNR the better. In electronic apparatus, noise signals often arise due to thermal random motion of electrons and is called white noise. White noise appears at all frequencies.
The noise produced by a transducer limits its ability to detect very small signals. A measure of performance is the detectivity given by:
The least detectable input is often referred to as the noise floor of the instrument. The magnitude of the noise floor may be limited by the transducer itself or the effect of the operating environment.
1.1.4 Zero, linearity and span
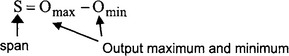
The range of a transducer is specified by the maximum and minimum input and output signals.
The span or full scale deflection (fsd) is the maximum variation in the input or output:
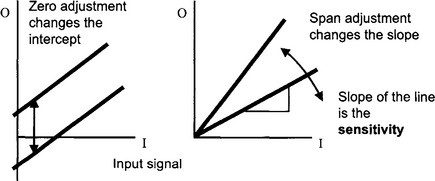
Zero and span calibration controls:
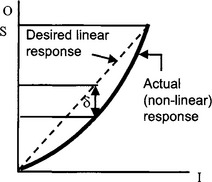
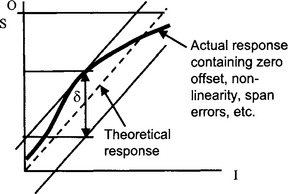
The % of non-linearity describes the deviation of a linear relationship between the input and the output.
Zero offset errors can occur because of calibration errors, changes or ageing of the sensor, a change in environmental conditions, etc. The error is a constant over the range of the instrument.
A change in sensitivity, or a span error, results in the output being different to the correct value by a constant %. That is, the error is proportional to the magnitude of the output signal (change in slope).
1.1.5 Resolution, hysteresis and error
A continuous increase in the input signal sometimes results in a series of discrete steps in the output signal due to the nature of the transducer.
e.g. A wire wound potentiometer being used as a distance transducer. The wiper moves over the windings bringing a step change in resistance (R of one turn) with a change in distance.
The resolution of a transducer is defined as the size of the step divided by the fsd or span and is given in %.
For a particular input signal, the magnitude of the output signal may depend on whether the input is increasing or decreasing – this is called hysteresis.
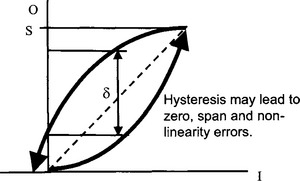
The general response of a transducer is usually given as a percent error.
1.1.6 Fourier analysis
Analog input signals that require sampling by a digital to analog converter system do not usually consist of just a single sinusoidal waveform. Real signals usually have a variety of amplitudes and frequencies that vary with time.
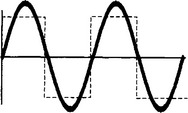
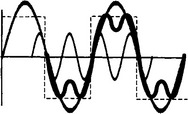
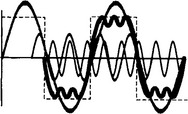
Such signals can be broken down into component frequencies and amplitudes using a method called Fourier analysis. Fourier analysis relies on the fact that any periodic waveform, no matter how complicated, can be constructed by the superposition of sine waves of the appropriate frequency and amplitude.
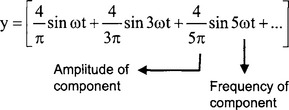
For example, a square wave can be represented using the sum of individual component sine waves:

Fourier analysis, or the breaking up of a signal into its component frequencies, is important when we consider the process of filtering and the conversion of an analog signal into a digital form.
1.1.7 Dynamic response
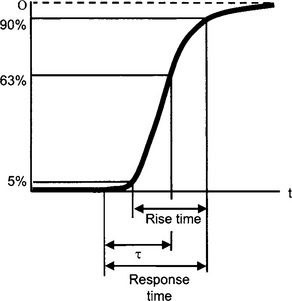
The dynamic response of a transducer is concerned with the ability for the output to respond to changes at the input. The most severe test of dynamic response is to introduce a step signal at the input and measure the time response of the output.
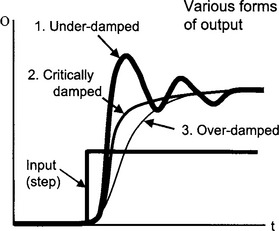
Of particular interest are the following quantities:
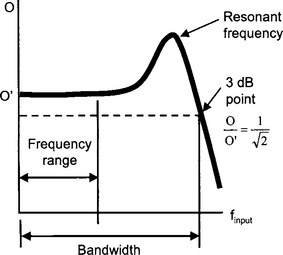
A step signal at the input causes the transducer to respond to an infinite number of component frequencies. When the input varies in a sinusoidal manner, the amplitude of the output signal may vary depending upon the frequency of the input if the frequency of the input is close to the resonant frequency of the system. If the input frequency is higher than the resonant frequency, then the transducer cannot keep up with the rapidly changing input signal and the output response decreases as a result.
1.1.8 PID control
In many systems, a servo feedback loop is used to control a desired quantity. For example, a thermostat can be used in conjunction with an electric heater element to control the temperature in an oven. Such a servo loop consists of a sensor whose output controls the input signal to an actuator.
The difference between the target or set point and the current value of the controlled variable is the error signal Δe. If the error is larger than some preset tolerance or error band, then a correction signal, positive or negative, is sent to the actuator to cause the error to be reduced. In sophisticated systems, the error signal is processed by a PID controller before a correction signal is sent to the actuator. The PID controller determines the magnitude and type of the correction signal to be sent to the actuator to reduce the error signal.
The characteristics of a PID controller are expressed in terms of gains. The correction signal O from the PID controller to the actuator is given by the sum of the error Δe term multiplied by the proportional gain Kp, the integral gain, Ki and the derivative gain Kd.
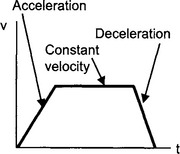
The PID correction acts upon the error signal which is itself a function of time. The PID correction is thus also a function of time. For example, in servo motion control, a PID controller is able to cause the moving body (e.g. a robot arm) to accelerate, maintain a constant velocity, and decelerate to the target position.
1.1.9 Accuracy and repeatability
Accuracy is a quantitative statement about the closeness of a measured value with the true value.
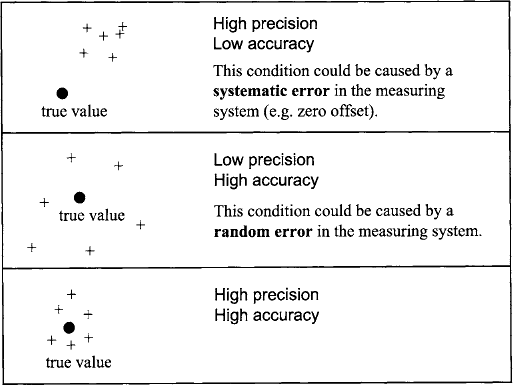
There is a difference between the accuracy and the precision of physical measurements.
High precision need not be accompanied by high accuracy. Precision is measured by the standard deviation of several measurements.
High accuracy may also be accompanied by a wide scatter in the measurement readings leading to low precision.
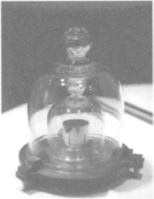
The kilogram is the unit of mass and is equal to the mass of an international standard kilogram held in Paris.
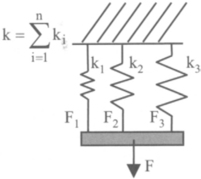
1.1.10 Mechanical models
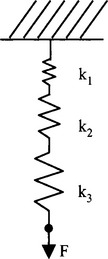
The response of materials and systems can often be modelled by springs and dashpots. This allows both static and dynamic processes to be modelled mathematically with some convenience. Most materials have a mechanical character that falls somewhere in between the two extremes of a solid and a fluid. Springs represent the solid-like characteristics of a system. Dashpots represent the fluid-like aspects of a system.
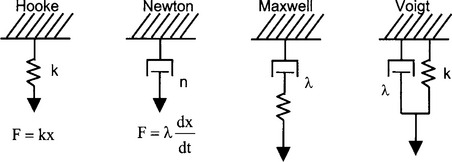
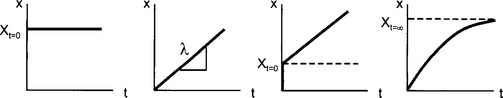
Displacement in response to a step application of constant force.
1.1.11. Review questions
1. A moving coil galvanometer has a series resistance of RM = 120 Ω and a full-scale deflection at 2.5 μA. The display scale is divided into 100 equal divisions. The meter is to be used as a voltmeter to measure the emf from a 3.0 V source which has an output resistance RO of 1.5 kΩ.
(a) Determine the resistance RS required to be connected in series with the galvanometer to make a voltmeter 0–5 V range.
(b) Determine the uncertainty in the measured value for the above source emf due to meter resolution.
(c) Determine the reading on the voltmeter when it is connected across the 3.0 V voltage source.
2. An infrared gas analyser is used to measure the concentration of carbon monoxide (CO) in the exhaust gases of a motor vehicle. Before the measurement is taken, purified air containing no CO is introduced and the “zero” is adjusted for 0 mV on the output display. Then, a calibrated mixture of CO and air at 400 ppm is introduced and the span adjusted to give 400 mV on the output. The exhaust gas is then sampled by the instrument and the reading is 350 mV. It is discovered later that the concentration of the calibrated mixture was in error and should have been 410 ppm. Assuming the response of the instrument is linear, determine a corrected value for the measured concentration.
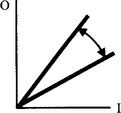
3. The diagram shows the output of a linear transducer as a function of its input.
(a) What formal term is given to the slope of this line?
(b) What control is used to adjust this slope during calibration, the “zero” or the “span”?
4. List three static, three dynamic and three environmental performance characteristics which would influence the choice of a transducer for a particular application.
5. A dashpot and spring in parallel (the Voigt model) can be represented by a resistor (k becomes R) and an inductor (λ becomes the inductance L) in series. If the applied force is replaced by voltage, and the resulting displacement is replaced by the current, show that the magnitude of the applied force and the magnitude of the displacement are related by: