
14
Transact-SQL in Applications and Reporting
I've always been a firm believer in the principle that any learning experience should lead to a tangible and usable end product. I remember taking a Visual Basic 3.0 programming class at a local college. It was a daytime class so most of the students were typical first-year college kids, just trying to pass the class and get their credits. I, on the other hand, was working in the industry as a database programmer with Hewlett Packard and was in need of a particular skill. Students would raise their hands and ask questions like, “Will this be on the test?” When I asked questions about user-input validation and concurrent database access, others would grimace because these topics weren't covered in the textbook.
This chapter is all about turning theory into reality. I'd like to share some experience (and the experience of others) with you about building applications and database solutions on the concepts you've learned in previous chapters. Throughout this book, I've mentioned that Transact-SQL isn't really a programming language, although in many ways it acts like one. Structured Query Language is best suited for returning and manipulating data and database objects. When it comes to processing complex business logic and interacting with users, the SQL language usually doesn't do the job—that's not what it's for. Fortunately, SQL Server integrates extremely well with many programming languages and application development environments. It's probably more accurate to say that a number of application development environments work well with SQL Server and other database products that use the SQL query language.
Application Programming Models
An application programming model is a high-level guide, the foundation upon which all of the components of a solution rest. It's also a set of standards and practices that apply to the finer points of application design. This encompasses the concept of design patterns, which are repeatable practices and methods for building solutions. There really isn't one application programming model that fits all user and business needs. In fact, it's really hard to say that any one approach is typical. Every software developer, over time, adopts their own toolkit of coding habits, naming conventions, and program code and script snippets to reuse in subsequent projects. This is great for small projects architected and built by one developer. However, larger projects need a more disciplined approach requiring standards applied across the project team or organization.
To appreciate this idea of design patterns, you need only to look around and make some observations. Have you ever noticed how so many cars from different manufacturers are so similar? Why do you think this is? Likely, it's because each company has fed off of the other's success. For example, in the 1980s, the Honda Accord became an icon of style and efficiency. In the 1990s, several competing models suddenly became very similar, including the Toyota Camry, the Nissan Maxima, and others. Someone found a design that worked well and the industry followed. Innovation is occasionally the result of starting over and applying a pattern radically different than the status quo, but is more often obtained through a series of incremental improvements. In simple terms, the software industry, although relatively young, has matured quickly over the past few decades. Developing software and database solutions is arduous and expensive. The best approach is to build upon the experiences and success of others with a cautious eye toward improvement.
The business of defining usable software programming and design models is not a lightweight topic by any means. Many large businesses have invested millions in defining their own strategies, and a number of industry-wide standards have evolved. The need for reliable and auditable processes has spawned many related, industry, and project type-specific standards. In manufacturing and production, the ISO-9000:9002 standards have prompted businesses of all kinds to maintain specific standards of quality control. Information Technology–related industries have adopted methodologies for better understanding requirements, deliverables, and project lifecycles. Specific methodologies exist for this purpose. These include the Unified Modeling Language (UML) for object-oriented application design and modular solution architecture, and Object Role Modeling (ORM) for high-level data entity modeling and database design. Software project management approaches vary from high-level, principle-centered strategies such as the Microsoft Solutions Framework (MSF) to more rigid, rules-based standards rooted in the top-down waterfall approach. Fully engaged project management deals with core issues and challenges people across different areas of business. For a methodology to work, it requires participants to share a unified belief system. This treads on culture, communication, and trust. It's hard to get two people outside of the same organization to agree on some specifics, but there are a number of principles and practices most of us who have been down this bumpy road can agree upon.
Selecting a Model
The selection of a programming model should be driven by the user and system requirements. When I am enlisted to design and implement a new system, I often go in with preconceived ideas about the size and scope of the final solution. Although it's important to start somewhere, I've learned to keep my mind open to changing requirements. Projects that start small can soon reveal a much larger scope and growth potential, and problems that seemed expansive might be easily solved with small, simple solutions. Likewise, shrink-wrapped commercial applications often need to be customized to such a degree that it is most cost-effective to build the system from scratch; and large, expensive custom applications can sometimes be replaced with off-the-shelf software. In short, an ounce of careful planning and design can be far more beneficial than a pound of brute-force application development.
Database application programming models roughly fall into the following categories:
- Desktop Database Applications
- Client/Server Database Solutions
- Three-tier Component Solutions
- Web Server Applications
- Multi-tier Web Service Solutions
- Multi-system Integrated Solutions
Additionally, database systems generally fall into these categories:
- On-Line Transaction Processing Databases
- On-Line Analytical Processing Databases
- Hybrid Database Systems
A database solution is going to involve some combination of application model and database system. Before discussing the finer points of each of these models, I'd like to put some questions in your head. In many database applications, the business requirements aren't always cut-and-dried. You can reason that there may be some opportunity to incorporate pieces of these different models and that a system may need to evolve from one type to another. That's the beautiful thing about modern tools. If you design a system correctly, it can grow and evolve. Ask yourself the following questions about your project or application:
How many users need access to data?
How many users do you have now and how many users will you have in a year, or in five years? Are they employees, customers, or vendors? The volume of concurrent users is a significant factor. After you establish the answer to this question, you also need to know something about the needs of these users. For example, 10 users who will consistently enter and modify records can be far more demanding than a thousand users who will occasionally browse data or view reports. It's often difficult to predict the size or profile of your user base years into the future, but this will have a large bearing on your scalability needs—how much the system will need to grow in the future.
Modular, multi-tier applications are more scalable but also more complex and expensive to build.
Where are users located?
Are users situated in the same building or on the local-area network (LAN)? Perhaps they are at multiple sites or they need access to the system when they travel. Geographic boundaries have typically been one of the most significant factors in overall solution design.
What is your current infrastructure investment?
Implementing a new software solution involves more than installing a database and writing software. Any solution requires a significant investment in server and network infrastructure. Many companies have already made a sizable investment and are committed to a specific platform, operating system, and maybe even the database product.
Does your company currently manage database servers, web servers, component hosting services, and a corporate network? Do you have available bandwidth for the increased load? Do you use server clustering or replication? Not only do these services and the related hardware represent a cost, but so do trained and capable personnel. It's important to consider the existing infrastructure and to decide whether you can design a compatible system, or whether it makes sense to take on this additional investment.
What are your security requirements and restrictions?
How sensitive is the data you are managing? How costly would a security breach be to your business? Consider the legal and regulatory risks and restrictions. If you need a high level of security protection, this represents a greater cost in terms of coding standards, auditing, and testing. Encryption components and certificates are reasonably affordable, but encrypted data slows the system and requires more bandwidth.
How current does the data need to be?
It's not particularly difficult for a simple database system to let all users see and manipulate current data, but this becomes an issue when the system approaches its capacity limits. If data won't change that often or if data concurrency isn't a big issue, one database may suffice for both data entry and reporting applications. Otherwise, it may be necessary to use two separate databases: one for entry and another for reporting and analysis.
What data volumes do you anticipate?
Databases grow. That's inevitable. How much storage space will your database require in the next year, or five years? Very large databases have a higher maintenance overhead and need a more capable server. Historical data can be managed by archiving or partitioning portions of the database.
What are the system availability requirements?
Although allowing a database server to run around the clock isn't very expensive, guaranteeing that it will always be running can be very expensive. When does the data need to be available? During business hours? Week days? 24/7? Unless you invest in redundant, fail-over systems, you must plan for some downtime—both scheduled and unscheduled. A data maintenance and recovery plan will help but cannot guarantee 100% uptime unless you have redundancy and measures to mitigate every risk of failure.
What are your delivery time constraints?
Writing software and building a solution takes time, typically months to years. Usually 20%–30% of the total time will be spent gathering requirements and designing the system. Another 20%–30% is required for testing and debugging. After installation, deployment, and training, this leaves only 30%–50% of the time for the actual system development. Many projects fail because of unexpected schedule overruns because these factors aren't considered or estimated realistically. Pre-built, shrink-wrapped systems can usually be delivered faster, but custom-built solutions often offer greater flexibility.
What are your budget constraints?
The more complex the project, the more difficult it may be to estimate the final cost. Custom solutions are often budgeted based on the return on investment (ROI) rather than the initial cost. This is because, quite frankly, it's often difficult to justify the cost without considering the long-term benefit.
Desktop Database Applications
This is the most traditional type of database application. Several file-based database products have been around for many years. When I began working with medical billing software in the late 1980s, our application stored data in flat text files and the programmers wrote code that did a lot of the low-level work performed by database engines today. Most desktop database applications, even as early as the 1980s, used integrated database tools such as dBase, Clipper, Clarion, Paradox, FileMaker, and FoxPro. The most popular desktop database for Windows is Microsoft Access. Most modern database products, like Access, support variations of the SQL language.
Access will support a handful of concurrent network users. Because the database engine doesn't run as a server-hosted service, large data volumes and complex queries can easily create excessive network traffic. Even if the database file is located on a server, data is processed on the user's computer. The advantage of this option is its simplicity and low initial cost. The disadvantage is its lack of scalability and less-efficient query processing.
Microsoft Access includes a forms design environment to create data-centric user interfaces. More sophisticated and lighter-weight applications can also be created using Microsoft Visual Studio or other application development suites.
The Access database engine incorporates an application programming interface (API) called Data Access Objects (DAO). In recent years, Microsoft has all but discouraged the use of the Access JET database engine and DAO for programming. In its place, it has promoted the Microsoft SQL Server 2000 Desktop Engine (MSDE), a lightweight client/server database distributed with Access and Microsoft Office. The MSDE is being replaced by the SQL Server 2005 Express Edition. Even though the use of the traditional Access database is being deemphasized, the fact remains that it can actually be simpler and easier to use for creating small database solutions. Figure 14-1 shows an Access form opened from the Access database window. This form may be used for data entry, viewing, or modifying existing records.
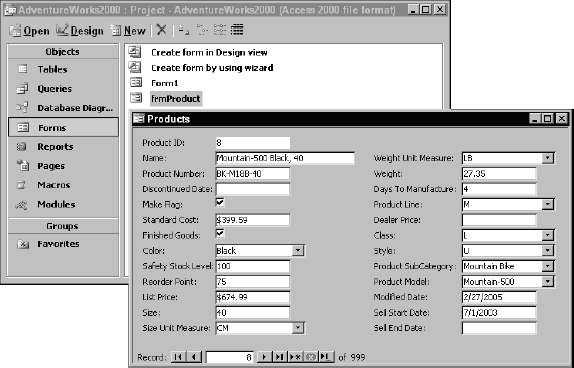
Figure 14-1
Client/Server Database Solutions
The most significant difference between this and the desktop database is that the database engine runs as a service on a file server. Requests sent to the database are processed on the server and only results are returned from queries. All query and database processing occurs on the database server. As previously mentioned, the MSDE database and SQL Server 2005 Express Edition are inexpensive options for getting started and running a small database on a desktop computer. MSDE databases have a hard limit of 10 concurrent connections.
When client/server databases came onto the scene in the mid 1990s, it was a common practice to pass ad-hoc SQL strings from the client application to the server. Although this practice causes a significant performance improvement over the client-side processing of desktop databases, it doesn't take advantage of some of SQL Server's query execution optimizations. By using stored procedures with views and user-defined functions, applications benefit from improved security and compiled execution plan caching.
This model takes advantage of the processing capabilities of two computers: the client and server. That's why it is also known as a two-tier solution. This is typically an effective solution for mid-size applications with users connected to a LAN. The client-side application is installed entirely on each user's desktop computer. Data access code routines connect directly to the back-end database server through an API layer, such as ActiveX Data Objects (ADO) or ADO.NET. The first native API for SQL Server was introduced for SQL Server 6.0. Roughly modeled after the existing DAO object model designed for Access/JET databases, Remote Data Objects (RDO) was built on top of Open Database Connectivity (ODBC), Microsoft's first database connectivity and driver standard. In the late 1990s, Microsoft introduced ADO, an upgraded API engineered to work more efficiently with SQL Server 7.0 and above, using the OLEDB connectivity standard. DAO, RDO, and ADO, along with their corresponding connectivity components, implemented Microsoft's original object-oriented programming and execution standard, known as the Component Object Model (COM). Microsoft's latest program execution model is the .NET Common Language Runtime (CLR). This supports updated objects used to connect through ODBC, OLEDB, and the .NET native SQL Server data provider (for SQL Server 7.0 and up).
Client/server applications exist at the entry-level of distributed solution models and have limited scalability. One common practice today is to design the system with three tiers and then deploy the middle-tier components on either the client or server computers, as illustrated in Figure 14-2. This way, if the solution needs to be scaled into a larger environment, it may simply be a matter of reconfiguring existing components to run on three computers. Although this option comes at an elevated initial cost, it may spare the additional cost of rewriting large portions of the application if the solution needs to be scaled up.
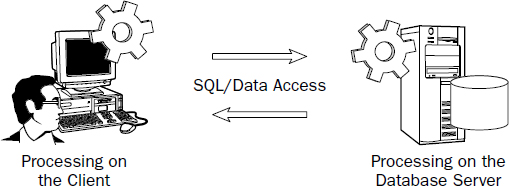
Figure 14-2
The client application contains the user interface. Figure 14-3 shows a Windows form in design view. Using Visual Studio, a variety of application types can be created to be used on the Windows desktop, in a web browser, at the command prompt, or on portable mobile devices.
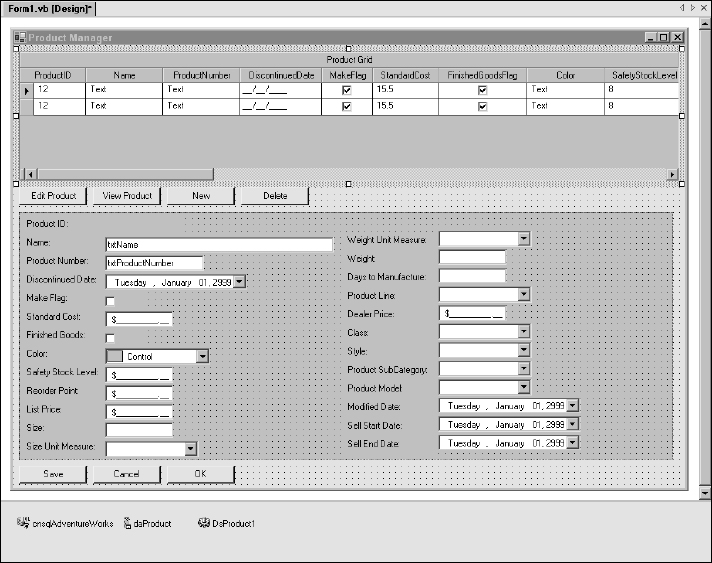
Figure 14-3
Specialized user interface controls give users a rich, interactive experience for entering and modifying record data. In this example, you can see a variety of controls that may be appropriate for different data types and fields. These include the following:
- Drop-down list combo boxes
- Check boxes
- Masked currency text boxes
- A color-picker drop-down list box
- Date-picker drop-down list boxes
Some of these controls have associated event-handling code, which runs when certain activities are performed by the user. The most common example is the click event of a button. Programmers can write program logic using a programming language of their preference, such as C#, Visual C++, or Visual Basic.NET. The following simplified Visual Basic code might run when the Save button is clicked after a user enters or modifies a product record:
Private Sub btnSave_Click(ByVal sender As System.Object, _
                          ByVal e As System.EventArgs) Handles btnSave.Click

    ‘** Determine whether new or existing record
    If bNewRecord Then
        ‘** New record is being added
        ‘** Define and open a connection:
        Dim cn As New SqlClient.SqlConnection(“Data Source= ” _
          &“Corp_DatabaseServer;Initial Catalog=AdventureWorks”)
    cn.Open()
    ‘** define a command object for the Insert SQL:
    Dim cm As New SqlClient.SqlCommand
    cm.Connection = cn
    cm.CommandType = CommandType.Text
    cm.CommandText =“INSERT INTO Product (Name, ProductNumber, ” _
                        &“DiscontinuedDate, MakeFlag, StandardCost) ” _
            &“SELECT ‘” _
            & Me.txtName.Text &“‘, ’” _
            & Me.txtProductNumber.Text &“‘, ’” _
            & Me.dtpkDiscontinuedDate.Value &“‘, ” _
            & Me.chkMakeFlag.Checked.ToString &“, ” _
            & Me.txtcurStandardCost.Value.ToString
        ‘** Execute the SQL:
        cm.ExecuteNonQuery()
        ‘** Close the connection
        cn.Close()
    Else
        ‘** Existing record is being updated
        ‘** Define and open a connection:
        Dim cn As New SqlClient.SqlConnection(“Data Source=” _
              & “Corp_DatabaseServer;Initial Catalog=AdventureWorks”)
        cn.Open()
        ‘** define a command object for the Insert SQL:
        Dim cm As New SqlClient.SqlCommand
        cm.Connection = cn
        cm.CommandType = CommandType.Text
        cm.CommandText =“UPDATE Product SET ” _
            &“Name = ‘” & Me.txtName.Text &“’ ,‘” _
            &“ProductNumber = ‘” & & Me.txtProductNumber.Text & “’, ‘” _
            &“DiscontinuedDate = ‘” & Me.dtpkDiscontinuedDate.Value &“’, ” _
            &“MakeFlag = ” & Me.chkMakeFlag.Checked.ToString &“’, ” _
            &“StandardCost = ” & Me.txtcurStandardCost.Value.ToString _
            &“WHERE ProductID =” & me.lblProductID.Text
        ‘** Execute the SQL:
        cm.ExecuteNonQuery()
        ‘** Close the connection
        cn.Close()
       End If
   End Sub
In this example, the actual Transact-SQL statements are assembled in the client code. This may seem to have the advantage of keeping all of the business logic in one place. However, this approach passes uncached ad-hoc SQL statements to the database server that will likely not perform as well as precompiled stored procedures. Allowing queries to be passed to the server on external connections can also be a security risk. This code is simple and relatively easy to maintain, but it may not be a very scalable solution.
n-tier Component Solutions
As two-tier solutions grew and began to run out of steam, many software designers looked for a way to take their applications to the next level. The great challenge was that Windows was designed to primarily run user-interactive applications on the desktop. Developing server-based components has long been difficult and expensive, using capabilities in the hands of large product vendors, not IT application developers. It took a few years for that to change. Visual Basic version 5.0 and 6.0 used COM and ActiveX technology, enabling software developers to create middle-tier components. Although writing components is pretty easy, configuring them to run on a server was quite a hassle in the beginning.
At first, software systems with this added component layer were known as three-tier solutions because the entire solution runs on three different physical layers: the database on the database server, middle-tier components on an application server, and the client application running on the desktop. Along with the capability to distribute the workload beyond two layers came the ability to extend the solution to four, five, or more separate computers (thus the term n-tier, rather than three-tier). One could argue that regardless of the number of servers or desktop computers, there are still conceptually only three tiers. Figure 14-4 depicts an n-tier component solution.
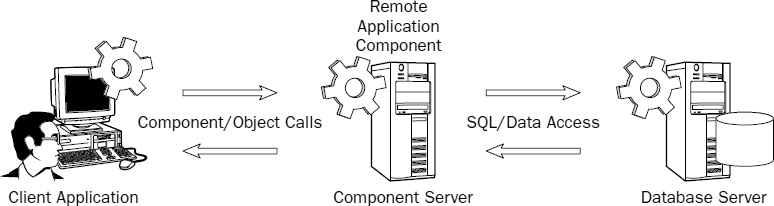
Figure 14-4
Compared with the client-server example you looked at previously, the following demonstrates a more elegant solution. The three following samples are code snippets from a three-tier application. Using Figure 14-4 as a reference, we'll move from right to left. Note that not all fields are used just to keep these examples small and simple. I've made it a point to simplify this code to make it more readable.
Server-Side SQL Objects
In this model, all Transact-SQL is isolated to the database server as stored procedures, user-defined functions, and views. This provides a layer of security, keeps business logic close to the data, and is a very efficient use of database services and network resources.
/**************************************************************

Adds new product record and returns new ProductID
    3-21-06, Paul Turley

Revisions:
     3-23-06   Added error-handling script

**************************************************************/
CREATE PROCEDURE spAddProduct
  @Name           nVarChar(50)
, @ProductNumbernVarChar(25)
, @DiscontinuedDate      DateTime
, @MakeFlag          Bit
, @StandardCost          Money
, @FinishedGoodsFlag     Bit
, @Color          nVarChar(15)
, @SafetyStockLevel     Int
, @ReorderPoint          Int
, @ListPrice          Money
, @Size               nVarChar(50)
AS
 INSERT INTO Product
   ( Name
   , ProductNumber
   , DiscontinuedDate
   , MakeFlag
   , StandardCost
   , FinishedGoodsFlag
   , Color
   , SafetyStockLevel
   , ReorderPoint
   , ListPrice
   , Size )
 SELECT
    @Name
  , @ProductNumber
  , @DiscontinuedDate
  , @MakeFlag
  , @StandardCost
  , @FinishedGoodsFlag
  , @Color
  , @SafetyStockLevel
  , @ReorderPoint
  , @ListPrice
  , @Size
 IF @@ERROR = 0
  RETURN @@IDENTITY
  ELSE
 RETURN −1
Middle-Tier Component
The component code, written in Visual Basic.NET in this example, serves as a broker between the presentation layer and the database objects. In this layer, I focus entirely on business logic and don't concern myself with the details of the user interface or the implementation of data storage. Programming objects provide an abstract representation for data access objects such as connections, queries, parameters, and results. This way, application programmers don't concern themselves with different dialects of SQL or other specific requirements of any single data provider.
‘*************************************************************
     Product class provides object definition to work with
     product records and product-related maintenance.


     Methods:
              AddProduct()
              UpdateProduct()
              DeleteProduct()
              GetProductList()
              GetProductsByType()
              GetProducts()

     3-23-06, Paul Turley
     Revisions:

‘*************************************************************
Public Class Product
    Public Function AddProduct(ByVal Name As String, _
                            ByVal ProductNumber As String, _
                            ByVal DiscontinuedDate As Date, _
                            ByVal MakeFlag As Boolean, _
                            ByVal StandardCost As Decimal, _
                            ByVal FinishedGoodsFlag As Boolean, _
                            ByVal Color As Color, _
                            ByVal SafetyStockLevel As Integer, _
                            ByVal ReorderPoint As Integer, _
                            ByVal ListPrice As Decimal, _
                            ByVal Size As String) As Boolean

        Dim cn As New SqlClient.SqlConnection(sConnectionString)
        Dim cm As New SqlClient.SqlCommand
        Dim Param As SqlClient.SqlParameter
        Dim iProdID As Integer

        cm.Connection = cn
        cm.CommandType = CommandType.StoredProcedure
        cm.CommandText =“spAddProduct”

        ‘ ** Pass the function arguments/field values to proc. parameters:
        Param = New SqlClient.SqlParameter(“Name”, Name)
        Param.DbType = DbType.AnsiString
        cm.Parameters.Add(Param)

        Param = New SqlClient.SqlParameter(“ProductNumber”, ProductNumber)
        Param.DbType = DbType.AnsiString
        cm.Parameters.Add(Param)

        Param = New SqlClient.SqlParameter(“DiscontinuedDate”, DiscontinuedDate)
        Param.DbType = DbType.Date
        cm.Parameters.Add(Param)

        ‘ ** The rest of the parameters are handled here - abbreviated for demo**

        ‘ ** Execute the command/stored proc:
        iProdID = cm.ExecuteScalar
        ‘ ** Return True if successful:
        If iProdID > 0 Then Return True

        cn.Close()
    End Function

    ‘*** Other Functions to Update, Delete, Get products, etc.:
        Function UpdateProduct() As Boolean
         ’***
    End Function

    ‘*** DeleteProduct()
    ‘*** GetProductList()
    ‘*** GetProductsByType()
    ‘*** GetProducts()

End Class
Presentation Layer
Compare the following code sample with that from the client-server sample. Rather than handling all of the data access and business logic in one chunk, I simply create objects based on the class defined in my middle-tier component. Using this object, I call methods (defined in Visual Basic as functions) and pass necessary values. The class method code performs data access and executes stored procedures in the database.
Private Sub btnSave_Click(ByVal sender As System.Object, _
                              ByVal e As System.EventArgs) Handles btnSave.Click
        ‘*** Create new instance of an object based on my custom Product class:
        Dim prod As New Product

        If bNewRecord Then
            ‘** New record is being added
            prod.AddProduct(Me.txtName.Text, Me.txtProductNumber.Text, _
                   Me.dtpkDiscontinuedDate.Value, Me.chkMakeFlag.Checked, …)
        Else
            ‘** Existing record is being updated
            prod.UpdateProduct(Me.lblProductID.Text, Me.txtName.Text, _
                   Me.txtProductNumber.Text, Me.dtpkDiscontinuedDate.Value, …)
        End If
    End Sub
Overall it takes a little more work to design a multi-tier application, but the result is a flexible, scalable solution that is easier to maintain as it grows.
Resource Pooling
Why is a three-tier solution so much more capable than a client/server application? If you have the same number of users running just about the same desktop application connected to the same database, what's the big advantage of having this middle layer? Adding the middle-tier doesn't just raise system capacity by one-third. The middle-tier becomes a broker for pooling and recycling resources. Between the database server and component layer, it enables connection-pooling, a feature that was built into ODBC years ago (but largely unused until component technology matured). The database server-side network library keeps a pool of connections active. Each connection will stay open, unused, for a few minutes at a time. When a client or component makes a new connection request, it simply recycles one of the existing idle connections in the pool. Because most operations only take a few seconds at most, this is an effective way to allow lots of clients to utilize a relatively small number of database connections. The catch is that every client has to use the same connection settings and security credentials.
Between the client and component layer, the application server enables object-pooling. In a similar way to connection-pooling, after a call is made to run the code (known as a method call) in a hosted business object component, a cached copy of the executable code remains in the application server's memory. There it waits for additional requests. Between object-pooling on the application server and connection-pooling on the database server, it's all just a matter of timing. As thousands of users use a few hundred pooled business objects, the business object code uses just a few dozen connections… You do the math.
Component Transaction Management
Large-scale applications not only use multiple components but may also use data stored in multiple databases. The ADO and ADO.NET programming objects contain hooks to SQL Server's Distributed Transaction Coordinator (DTC) service. This lets programmers manage and synchronize transactions between different data sources. The benefit is that even with data in separate databases, on separate servers, and even using different database products, application code can have transactional control over multiple operations. Imagine an application that manages the transfer of funds between two different banking systems. After verifying that the interrelated debits and credits are all successfully processed on each separate system, either all operations are explicitly rolled forward or all operations are rolled back.
With the capability to take advantage of all this computer horsepower, one significant barrier remained. COM technology (extended in the network-capable implementations, DCOM and COM+) was designed to run only on Microsoft Windows and Windows networks. These applications would support any number of users, so long as they were all clients on the same network, running Windows applications and components.
Today, both component development and component hosting are much easier than ever before. Microsoft's .NET Framework, integrated server, and development environments have improved upon all of the original features of COM and COM+. Though it's true that this style of large-scale application development takes a fair amount of application development expertise, now it's fairly easy to deploy and configure an enterprise-class component server.
Web Server Application
Desktop applications give users tactile control of data. Generally, applications respond quickly and users can see an immediate response when they perform an action. We've become accustomed to a variety of sophisticated user interface controls that are relatively universal across different systems. For example, most users know what to do when they are presented with a list box, drop-down combo box, a scrollbar, or grill control. However, one of the significant limitations to building custom Windows desktop applications is they must be preinstalled on each user's Windows computer. To share data, they must be connected through a LAN.
Web server applications can make data accessible to users across the Internet. User interface options include web pages or custom Windows components. Web services make data and application functionality available to custom applications from server to server or desktop to server, across the Internet. Web-based applications have improved significantly over the past few years, and although desktop applications continue to be more responsive and flexible than browser-based solutions, this gap continues to narrow as the Web has become a common medium for business applications. The unique characteristic of a web server application is that it runs on a web server, rather than on the user's desktop computer. All, or at least the vast majority, of the processing takes place on a central server running web server components. The user sees data and changing options as they interact with a user interface that is dynamically regenerated on the web server and sent back down to the user's web browser.
The advantage is that users need only a web browser and a connection to the Internet to use the application. Several challenges continue to be somewhat costly for solution developers. Compared to desktop solutions, performance and response time is slow. Web server applications typically display web pages using HTML, the mark-up language displayed by web browsers like Microsoft Internet Explorer. When a user clicks a button on a web page to retrieve a record, for example, this request is sent across the Internet to the web server, where code interacts with the database and server-side components. Code on the server modifies the HTML tags for the copy of the user's web page in the server's memory and then sends it back across the Internet to the user's browser, displaying a response to the user's request.
Programming web solutions is still a little more cumbersome than traditional applications but this has improved in recent years. Microsoft's web application programming standard matured significantly in 2001 when Active Server Pages (ASP) graduated to ASP.NET. Now using Visual Studio.NET, creating web server-based applications is a matter of dragging and dropping controls on a design surface and writing event code much like we've been doing to create desktop application interfaces using products such as Access and Visual Basic.
Data-bound web server components do much of the work of transforming data into an HTML-based user interface. To create a simple data sheet page to display records in a table format, the developer needs only to set properties for a few components and write a minimal amount of code. More sophisticated web applications may require more advanced-level coding. ASP.NET web components offer developers the flexibility of working at a lower level when they need to have more control or at a higher level to let the components do more of the work, to develop common applications rapidly. Many of the data access components generate volumes of Transact-SQL script for common operations. For example, when using drag-and-drop tools to generate a DataAdaptor object, a wizard dialog prompts the developer for a database table. From this, Transact-SQL script is generated to manage Select, Insert, Update, and Delete operations that are implemented using auto-generated programming code. The DataAdaptor wizard will also generate parameterized stored procedures in the database for managing these operations.
Multi-tier Web Service Solutions
In a web server model, the web server application really becomes the client to the database. Like a desktop application, the client can participate in a number of different application models. Simple web server applications may use a file-based database or a client/server database. A web server application can also execute code and use the features exposed by middle-tier components, making it a true three-tier application, with the client code running on the web server. Additionally, web applications can run script or separate components in the web browser, adding yet another layer to the model. To some degree it doesn't make a lot of sense to run custom components in the browser, because this really defeats the core objectives of a browser-based solution. However, using common client-side components can enhance the user experience and add more compelling content to web pages. It's common for web applications to make use of preinstalled client components such as Macromedia Flash, Windows Media Player, and the Adobe Reader.
Web servers can also act as application servers to host middle-tier components. One of the most exciting recent developments in component technology is the XML Web Service. Like a COM-based component, a web service can expose functionality for network clients. It can be used as a data source broker to route database requests and return results. The most compelling feature that makes this option so unique is that requests and results are sent as text using the Hypertext Transfer Protocol (HTTP). This means that a web service can be hosted by a web server and can communicate with different types of clients using the plumbing of the World Wide Web. Web services are based on industry-wide standards that finally make it a simple matter for applications running on one platform, or type of computer system, to work with those on a different platform.
The magic behind web services is a programming abstraction layer called Simple Object Application Protocol (SOAP). SOAP's job is to provide a standard for translating programming object calls into XML-formatted data on one end of the conversation and then back into objects on the other end. This means that programmers just write program code to work with objects. From a programmer's perspective, working with web services is much like working with earlier types of components.
Multi-system Integrated Solutions
In a perfect world (at least from a software architect and developer's point of view), all of our business systems should be designed from the ground up to integrate with each other, to exchange information efficiently, and to provide a seamless, unified experience for business users. This just doesn't happen in most businesses. Different systems serve different business users and processes. As business grows and processes evolve, users eventually need to access applications and systems designed for different groups in the organization. This leads to requirements for these systems to interoperate. The almost inevitable outcome is the realization that similar data stored in disparate systems is not stored or used in the same way. This presents a situation common in nearly all large businesses today: To support isolated users and processes, data gets transformed and reshaped in very specific ways, eventually creating scores of special-purpose and incompatible data stores and systems designed to meet some unique business need.
This organic growth of data-related systems can be better managed if database system architects can create flexibly designed databases that can serve multiple business applications. Applications may be designed to share functionality and data through standardized data interfaces and components. Application functionality and data can now be shared by different systems using data-exchange standards such as SOAP, RSS, and XML web services. Architecting an enterprise-wide application architecture may seem to be a daunting task, especially when integrating commercial application packages, but there are many options today that can make this much easier than before. If applications can't use shared data from a single database, moving and synchronizing copies of similar data can be achieved using resources such as Data Transformation Services, SQL Server 2005 Integration Services, and Biztalk Server.
Database professionals should keep a tight reign on systems that transform multiple copies of the same data for application and reporting use. Remember that information is the context of data—it's what it means and its significance to the business. When people start pushing copies of this data around, it will be easy to lose that context as this data is transformed back into information. This process should be carefully controlled and managed. The control and limitation of access to information is one thing. Every business has to have its own standards regarding information access (that are hopefully not unnecessarily restrictive). However, controlling the ability to change data and information is an entirely different matter. Ensuring that nothing is lost in the translation as data moves around the business will only serve to empower informed information users. This is often best achieved through IT-managed data marts and data warehouse databases that are accessible to all systems and users, who would otherwise be granted access to isolated data sources.
System Integration and Data Exchange
Large organizations manage lots of data. One common reason that large solutions may consist of different databases and applications is that each serves a specific purpose. Dividing data stores between transactional and decision-support systems is a common practice in large business environments. Different systems, each with its own databases, are designed to perform different business functions. Applications may use different database products.
Unfortunately, for system integrators, most specialized business systems aren't intended to integrate or share data with others. In a perfect world, all software would be designed to work together and share common data sources. The reality is that this ideal continues to be a far-off dream in most businesses. As we continue to reengineer disparate systems, we may inch a little closer to this objective in each iteration. For now, the best most of us can hope for are methods to ease the burden of exchanging data between systems.
In recent years, eXtensible Markup Language (XML) has evolved to become a common medium to help connect different databases and applications. XML is not a standard structure for data but a flexible set of standards to define almost any type of data. Unlike rigid data formatting standards of the past (such as EDS) XML allows data to be defined, stored, and documented in the same structure. This makes the data highly portable and easier to transform into that of another system. A number of supporting standards and products are now available to connect systems and synchronize data through the use of XML. Microsoft BizTalk Server allows multiple systems to easily interconnect and exchange data. Databases and specialized business systems can be integrated without cumbersome, manual intervention.
Project Management Challenges
I recently read that the FBI had commissioned a project to consolidate its many disparate databases and computer systems. After more than a billion dollars in expenses and consulting fees, the project is in shambles. Many business requirements had been revised and the project scope has been adjusted and expanded to accommodate changing needs and business practices. Budget constraints now threaten efforts to complete the work. Fingers are being pointed and bureaucrats are covering their tracks to avoid blame. Under public scrutiny and executive control, dark clouds of failure are looming.
On a slightly smaller scale, this is all too common. One of the greatest threats to the success of an IT project is time. The larger the scope of the project, the more time it takes to complete. This allows more opportunity for business rules to change. Even if a project is completed to the satisfaction of the original requirements, if it takes too long, requirements will have changed and the product may not address the current needs of the business.
On a recent consulting assignment, I experienced numerous challenges due to ever-changing scope and requirements. The client is a large technology company with plenty of project experience. In the grand scheme of the product, my component was consistently put on hold as requirements changed in other areas. Although beyond my control, the lack of finite deliverables can be a bit disconcerting.
The ideal solution for managing larger-scale projects is to break them down into manageable pieces with a manageable-sized project team. According to the Microsoft Solutions Framework, Microsoft's internal project management guidelines, teams should consist of no more than eight individuals. If a project requires more people than this, it should be broken down into smaller components. Teams may be divided by features, discipline, or release versions. The larger the project, often the less decision-making control each team member will have over individual components and requirements. This can be demoralizing and frustrating—all the more reason to establish clear requirements and avoid making changes until completing each stage.
SQL Server Reporting Services
Database reporting solutions are really applications with a user interface, query components, and a data source. Generally speaking, these fit into the client/server application model. Until recently, enterprise-level reporting products were only offered by third-party companies such as Crystal and Business Objects. A number of specialized reporting products, such as Brio and Hyperion, are also available for multi-dimensional, decision-support databases. Microsoft has offered desktop reporting capabilities in Access and Excel, but it wasn't until 2003 that Microsoft released a serious, enterprise-ready reporting extension for SQL Server 2000 called SQL Server Reporting Services. It was originally intended to ship with SQL Server 2005 (which it does) but was completed ahead of the rest of the SQL Server 2005 components. Reporting Services is for serious reporting but it's pretty easy to use.
A brief tour of SQL Server Reporting Services is provided here. You'll see how to use some of the query techniques you've learned to support report features. This will be an opportunity to apply some of the techniques and practices you've learned earlier in this book. I'll use Reporting Services to show you how to create and use parameterized queries.
Reporting Services Architecture
Reporting Services is really quite different from other products for a number of significant reasons. The reporting engine runs as a Windows service on a computer configured as a web server. The core component is an XML web service sitting on top of ASP.NET and the .NET Common Language Runtime (CLR). This is a highly scalable and extensible architecture, meaning that features and additional capabilities can be added and that it can be expanded to more capable hardware and to multiple servers to handle increased workload. Reports can be integrated into a variety of application types and viewers, but it is most commonly used from a web browser. Out of the box, Reporting Services can render reports to different formats including variations of the following:
- HTML
- Adobe PDF
- Excel
- TIFF bitmap
- XML
- CSV text
Reports can be viewed on demand or saved to a file. User can subscribe to reports, resulting in the report being sent by email or to a file share at scheduled intervals.
In addition to these standard features, Reporting Services is programmable. Application developers can add additional capabilities for report rendering, data access, security, and delivery. They can also programmatically manage the report server and render reports, embedding report content into custom applications. In a nutshell, Reporting Services has an enormous feature set and with a little custom programming, can be made to do most anything imaginable.
To acquaint you with the Reporting Services design environment, I will walk you through the steps to create a simple report with basic features.
Because our focus is using SQL queries to drive reports, you will create two queries that utilize a parameter to filter report data. Before getting started, here is a quick disclaimer. The book you are reading is not a book on Reporting Services or Visual Studio, so I will not provide an in-depth explanation of all the features you're about to see. Because Visual Studio and Reporting Services are large, complex products, I can't guarantee that I can cover every detail in this short tutorial to get you completely up-to-speed on designing reports with Reporting Services.
The Wrox book, Professional SQL Server Reporting Services (Wiley Publishing, Inc.), provides an excellent explanation of SQL Server Reporting Services. The first edition is based on SQL Server 2000, and the second edition includes SQL Server 2005. If you would like to have a comprehensive guide to Reporting Services and report design, I recommend that you pick up this book.
The Report Designer
The Report Designer is an ad-on design environment that integrates into the Microsoft Development Environment. This means that it can be used in Visual Studio 2003 and 2005. The Report Designer is opened when you create or open a report project. Aside from some minor cosmetic differences, your experience creating simple reports should be similar whether you use Visual Studio 2003 with SQL Server 2000 Reporting Services or Visual Studio 2005 for SQL Server 2005 Reporting Services.
To begin, open Visual Studio and create a new project. Depending on the installation options, different project types may be available. Select Business Intelligence from the Project Types list. For you to see the mechanics of report design, I don't want to use the report project or report wizards. Select the Report Project icon from the Templates list on the left. I originally created this demonstration using the Report Designer for SQL Server 2000 and then re-created it for SQL Server 2005. I've included screen captures from both. As you work through these screens, note that there are only subtle, cosmetic differences between those in the Visual Studio 2003 Report Designer (used with Reporting Services for SQL Server 2000) and the Visual Studio 2005 Report Designer, for SQL Server 2005. The 2005 New Project dialog is pictured in Figure 14-5.
The Name and Location values can be set as you deem appropriate. A report project places data-source and report definition files into a single folder, and this folder can be stored pretty much anywhere you like. Unless you have another location for your projects, just append a folder name to the default path in the Location box and then enter a project name in the Name box.
Along the left and right edges of the Visual Studio window are a number of dockable utility windows. Each of these windows can be “pinned” in place or moved. The default behavior is for each of these windows to auto show and hide as the mouse is moved over the icon and then off of the window. Although this nifty feature effectively conserves screen real estate, it can be a bit annoying when the window you are working with suddenly goes away. To show the Solution Explorer (if it's not already pinned out), just float the mouse pointer over the Solution Explorer icon. To pin down a window so it doesn't perform this disappearing act, click the little pushpin icon so it becomes oriented vertically rather than horizontally. Depending on whether or not windows are pinned, the window icons will either be along the edge of an auto-hidden window, displayed on either side of the design environment, or along the top of each window if it is shown.
Visual Studio 2005 has added window-docking aids that show up when you drag a dockable window around. This new feature allows you to see exactly where a window will be docked before you let go of it.
The Solution Explorer window is shown in Figure 14-6. Begin by adding a new shared data source. Right-click the Shared Data Sources folder and then choose Add New Data Source from the pop-up window.

Figure 14-5
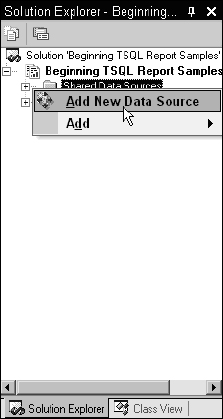
Figure 14-6
The concept of a data source is quite simple. A shared data source is actually a small XML file with an RDS extension, containing the connection information. Enter or select the name of your SQL Server in the first box. If you are using Reporting Services with SQL Server 2000, select the AdventureWorks2000 database, as shown in Figure 14-7. If you are using Reporting Services with SQL Server 2005, select the AdventureWorks database.
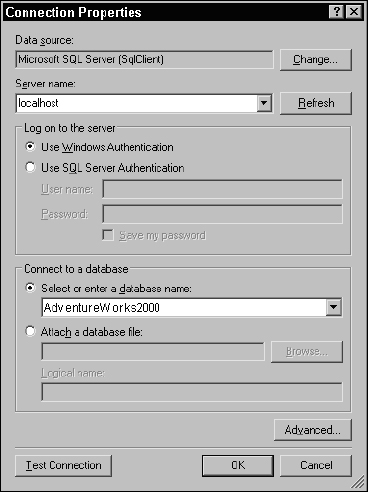
Figure 14-7
That's all there is to it. After entering the server name, verifying your authentication options (you can leave this alone if your server is configured for Windows authentication), and selecting the database name, just click the OK button.
The next step is to add a new report. From the Solution Explorer, right-click the Reports folder. From the pop-up menu, select Add and then Add New Item… , as shown in Figure 14-8.
There are two options for creating new reports, which include using the report wizard or building the report from scratch. You won't learn as much by using the wizard so I'm not going to have you use this method. You may want to go back and use the report wizard on your own. This will automate the process for creating a few styles of canned reports.
In the Add New Item dialog, select the Report icon on the right and give the new report file a name, as shown in Figure 14-9. This report will list products grouped by category and subcategory. Name the report Products by Category. Click the OK button when this is done.
Now step back and take a look at the Report Designer screen. Again, if you are not seeing the same thing as that shown in Figure 14-10, namely the utility windows along the left and right; just float the mouse pointer over the corresponding icons to make these windows appear.
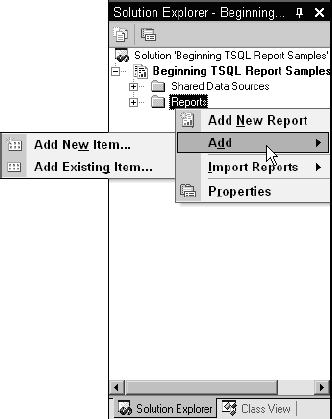
Figure 14-8
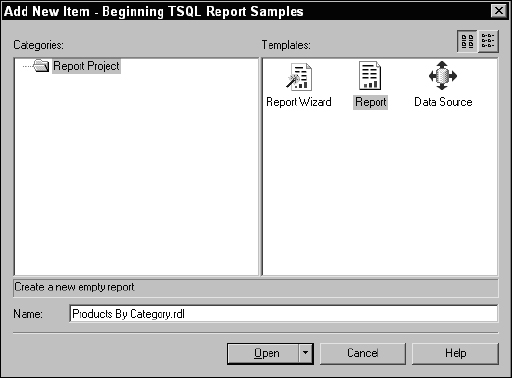
Figure 14-9
The Report Designer has three tabs along the top, which represent three distinct design surfaces. The first tab is the data set designer, used to create and work with queries. In just a bit, you'll see how to use the report Layout and Preview tabs. Again, there are only a few cosmetic differences between the Visual Studio 2003 and 2005 versions.
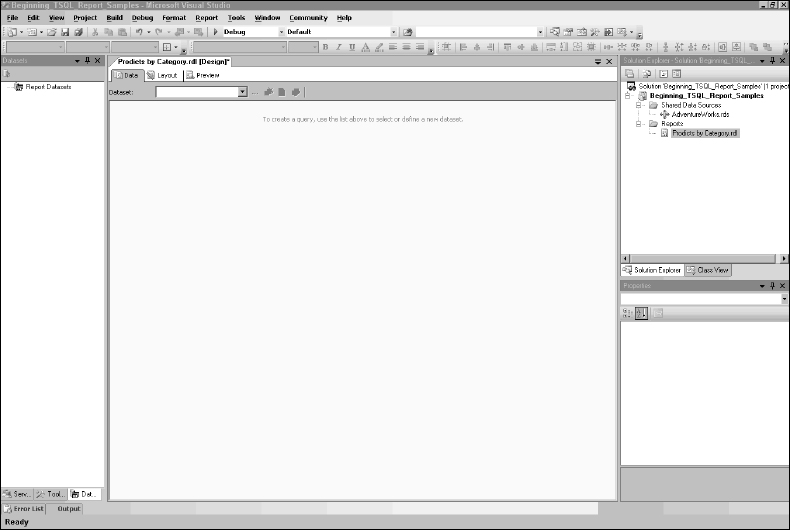
Figure 14-10
Report Queries
In Reporting Services, a query is called a dataset (not to be confused with an ADO.NET dataset, used in .NET programming). To create a new dataset or query, drop down the Dataset list and select <New Dataset… >. This opens a dialog box for setting up the dataset, shown in Figure 14-11.
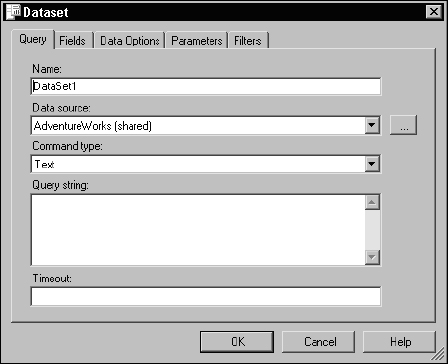
Figure 14-11
Replace the default dataset name with something meaningful. I typically like to use a name that describes the data. This may be the same as, or similar to, the name of the report. Note that the shared data source is selected for you. For the command type, I will typically either choose Text if I plan to create an ad-hoc SQL query or Stored Procedure if I will use an existing SQL Server stored procedure. You can type a SQL expression directly into the Query string box or leave it blank for now. Either way, the query can be designed or modified after closing this dialog. After changing the dataset name to Products_And_Categories and making no other changes, click the OK button.
The default query view is the generic query builder. This is a simple interface with few features. You can simply type a SQL expression into this window. The generic designer doesn't offer much help. You can switch to the graphical query designer view using the third icon from the left. This button is in the “pushed” position while in the generic query view and in the “up” position when using the graphic query designer, as shown in Figure 14-12.
Because you're already familiar with the graphic query designer, I'm going to give you only high-level instructions. Begin creating the query by adding these three tables to the diagram pane: ProductCategory, ProductSubCategory, and Product. If you are using SQL Server 2005, these three tables are all in the Production schema. When you add these three tables, inner joins are added because of the referential constraints defined in the database, as depicted in Figure 14-13.
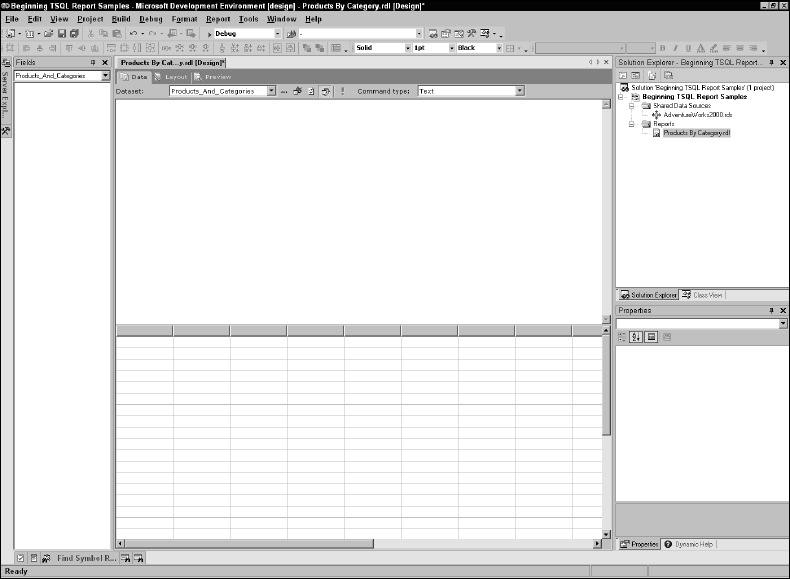
Figure 14-12
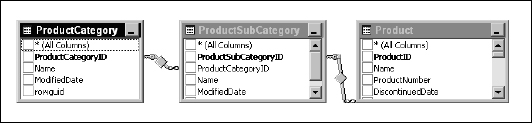
Figure 14-13
Add columns to the SELECT statement by checking them in the diagram pane in the following order:
- ProductCategory.Name
- ProductSubCategory.Name
- Product.Name
- Product.Color
- Product.ListPrice
The query should look like that shown in Figure 14-14 in the graphical query designer.
Creating a Parameterized Query
This query is completely unconstrained and will return all records. Unless you have a controlled set of low-value data, you will typically want to limit the result set. I'd like to build some logic into my query so that if a category value is selected and passed into the query only product records matching the selection will be returned. I also want some way of indicating that I want to ignore the category and return all rows. A few different ways exist to approach this common requirement. I want to filter on the key value for categories, the CategoryID column. Because this is an Int data type, I want to limit all of the values I work with to numeric types. Whenever possible, I try to avoid the use of Null values to perform business logic. I need to have a special value that doesn't occur in the result set to indicate that I want to return all rows. Rather than mixing data types or using a Null value, I'll designate −1 as my magic number for all records.
Using the graphic query design tools, modify the query so the CategoryID column has two conditions: the column value must either match the @CategoryID parameter or the @CategoryID parameter is equal to −1. Now that you have mastered Transact-SQL, you might feel like using this technique is beneath your abilities. However, I want you to see how the query designer behaves (just in case you forget something and need to go back to it some day). Note the placement of these two conditions before you move the cursor to another cell. Figure 14-15 shows the graphical query designer environment completed to this point.
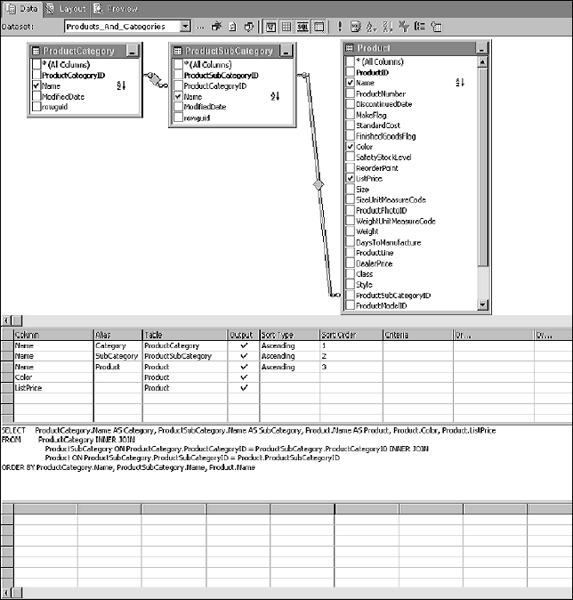
Figure 14-14
Now click another cell in the column designer grid. Observe both the column design grid and the SQL pane, as shown in Figure 14-16.
The designer moved the second parameter reference into the Columns area along with the corresponding equation. This is a very simple example but keep this in mind when you are building more complex parameterized queries. This is a common scenario in the reporting world. Imagine a report query with five or six parameters, each with similar logic. You could have dozens of possible combinations of literal values and “all record” indicators. At some point, I find that the graphical query designer begins to work against me, and will often mess up my logic expressions. In such cases, I typically use the graphical tools to get to this point, switch back to the generic designer, and then write the rest of the WHERE clause by hand. Remember to make explicit use of parentheses to clarify and control the grouping of operations when nesting and combining AND and OR logic.
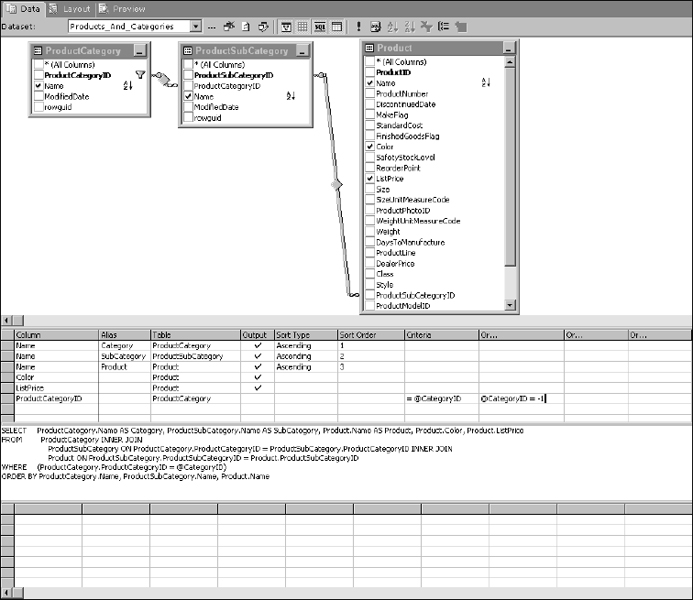
Figure 14-15
The main query is done. To test this query and view results, click the Execute button on the toolbar (the dark red exclamation mark). You will be prompted for the parameter value. Enter a low, positive integer value to see products for a specific category or enter −1 to see all product records, regardless of the category, as shown in Figure 14-17.
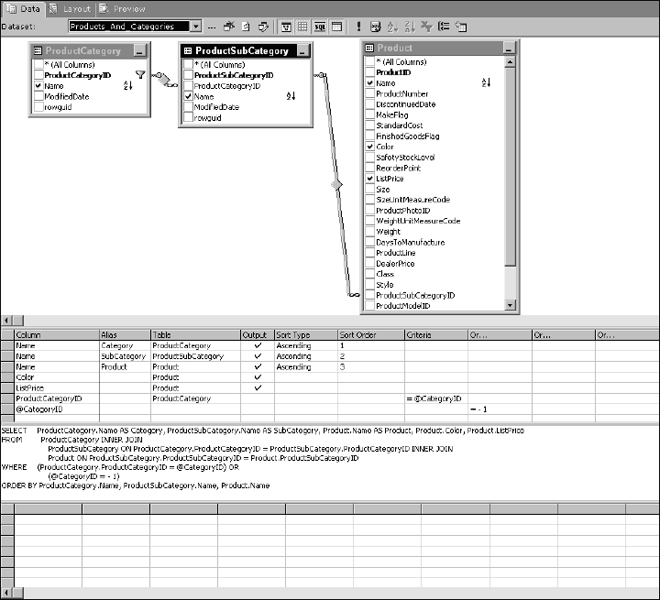
Figure 14-16
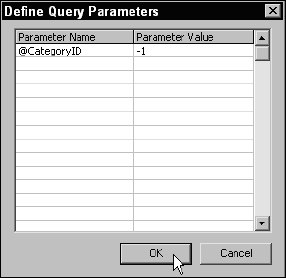
Figure 14-17
Creating a Parameter Lookup List
To test the product query and filter by a category, you used to either have to know the category primary key values or take a wild guess until you found the one you were looking for. Entering −1 for all records isn't particularly intuitive either. To make this a better experience for users, it helps to provide a lookup list of product categories for selection. This list will include an item to select all products as well.
Begin by creating a new dataset. Drop down the dataset list on the data design tab and select <New Dataset… Just like before, the Dataset dialog opens. Just change the name to Category_List, as shown in Figure 14-18, and then click OK.

Figure 14-18
After the Dataset dialog is closed, the designer window is cleared and takes you to the generic query designer. This will be a simple query, so I'll just type the script directly into the SQL pane. Here's my query:
SELECT     − 1 AS ProductCategoryID, ‘(All Categories)’ AS Name
UNION
SELECT     ProductCategoryID, Name
FROM       Production.ProductCategory
ORDER BY Name
If you are using Reporting Services for SQL Server 2005, the query designer displays a special grid for the UNION query, showing the literal values for the first expression and then the table selection for the second SELECT expression, as shown in Figure 14-19.
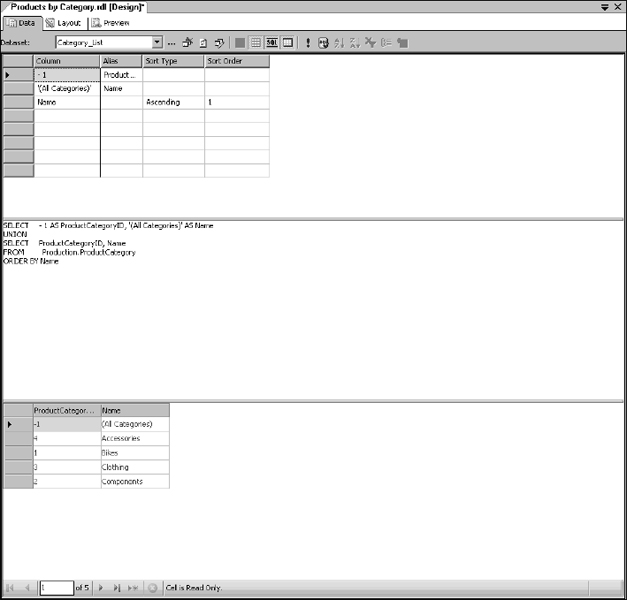
Figure 14-19
The results for the query are displayed in the lower pane of the designer. Note that the first row displays the special value, −1, to indicate that product records are not to be filtered by category.
The tools for SQL Server 2000 don't handle the UNION query quite as gracefully. The first thing the query designer does is show a warning dialog that, if you didn't read carefully, might appear to be an error. This dialog simply explains that the graphical query designer isn't equipped to display the design of a UNION query (see Figure 14-20).
This is fine. Just click the Yes button to make the warning go away and keep your changes. The designer window will show the results but makes no attempt to represent the query in any other form except SQL text.
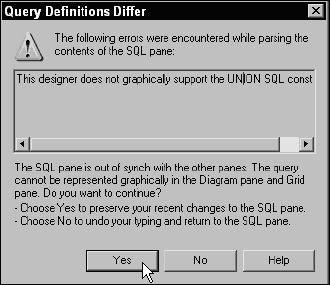
Figure 14-20
Designing the Report Layout
Think of the report layout as a canvas representing the body of the report. There are three dockable utility windows on the left side of the Report Designer in Visual Studio. These include the Toolbox, which contains report items (similar to controls in application development projects), the Dataset window, and the Server Explorer. The Dataset window, pictured in Figured 14-21, differs between Reporting Services for SQL Server 2000 and 2005. As you see in the Visual Studio 2005 designer, multiple datasets are displayed on a tree view. In Visual Studio 2003 (the designer for Reporting Services 2000), this window presents a drop-down list and iconized list of fields for only one dataset at a time.
Switch tabs or hover over the Toolbox icon to show the Toolbox window shown in Figure 14-22.
In design, standard report items are placed on the body and these items may be bound to the fields in a dataset. These are known as scalar report items because an instance represents a single value. Report items include the following:
- Textbox
- Rectangle
- Line
- Image
There is another class of report items called data range items. These items render repeated sections for every row returned from a dataset query. Scalar report items are placed into cells or sections of data range items. These include the following:
- Table
- List
- Matrix
Additionally, subreports and charts are special-purpose and although they are often categorized as data range items, they have unique behaviors.
Reports are rendered from top to bottom, and items placed on the report body will be rendered only once unless they are placed within a data range object. For this reason, if a text box in the body of the report references a dataset field, the expression must use an aggregate function to resolve to a scalar value. To keep things simple, examples will work with just a few report items. Tables are the most common data range item used in basic reporting and text boxes are the item of choice for scalar values.
Start by resizing the report body. Use the mouse pointer to find the right edge of the report body. The pointer will change to an east-west pointer icon (that is the official name). Use this to drag the edge and resize the body to a width of 8 inches. If your machine is configured to a different locale than mine, your scale may be in centimeters. In that case, make the report body 20cm wide.
Next, place a text box in the upper-left corner of the report body by either dragging and dropping the text box from the Toolbox window or by selecting the text box item and then drawing it on the report body. This text box will not be bound to data but will display the name of the report. Type =Globals!ReportName into the text box.
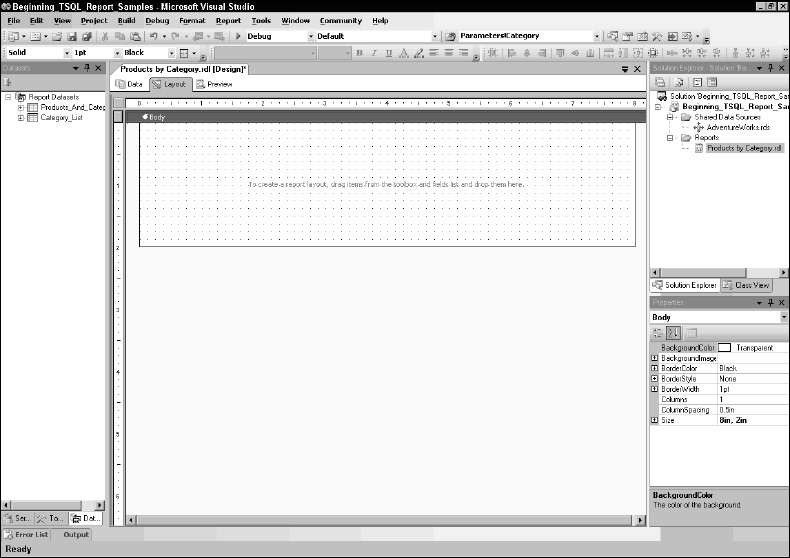
Figure 14-21
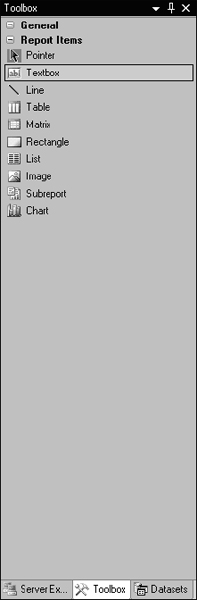
Figure 14-22
For more help with expressions, you can also right-click the item and then select Expression… to open the Expression Builder window. This is one area of the designer that has changed between the 2000 and 2005 versions. The expression builder in the Reporting Services 2005 designer has several enhancements over the 2000 version shown in Figure 14-23. For our purposes, this doesn't matter because we're only adding a very simple expression.
Set the font properties for the text using the properties window or the Report Formatting toolbar.
So far, your report should look like that shown in Figure 14-24.
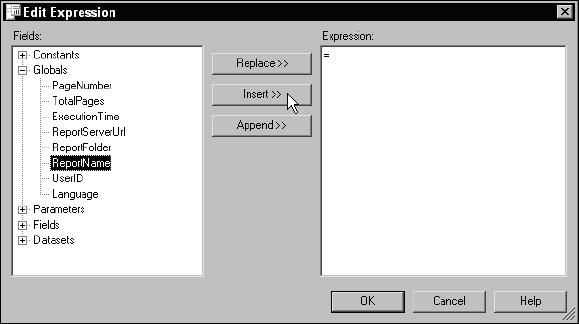
Figure 14-23
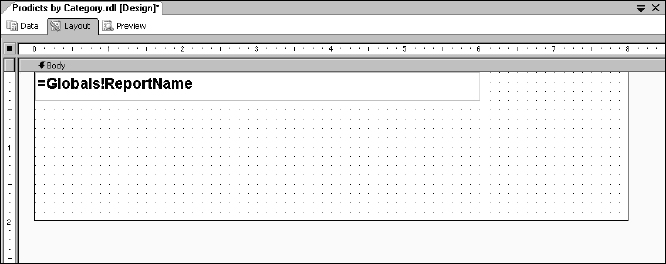
Figure 14-24
This report will display a list of products in rows and columns, grouped by category and subcategory. A columnar report calls for a table data range item. Drag a table from the Toolbox and drop it onto the report body just below the text box. Your report designer should look similar to Figure 14-25.
I need five columns and a table has three by default. The easiest method to add columns is to right-click a column header and then use the menu options to add columns to the right or left of the current column. Before you do that, resize the existing columns to make room. The table designer behaves much like Excel. In the column header, grab the border separating two columns or the right edge of the right-most column in the table. Add two additional columns. It's very common while designing a table to make it too wide. This pushes the report body out to fit. This is no problem. Just resize the columns and then the report body accordingly.
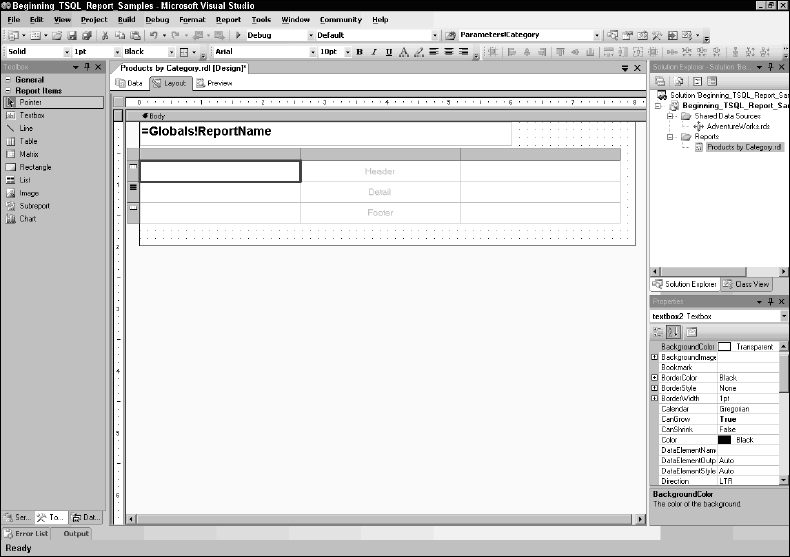
Figure 14-25
Adding Fields
This is the easy part. Show the fields list in the Dataset window and drag and drop fields into cells in the detail section of the table. Figure 14-26 shows the mouse pointer just prior to dropping the first field.
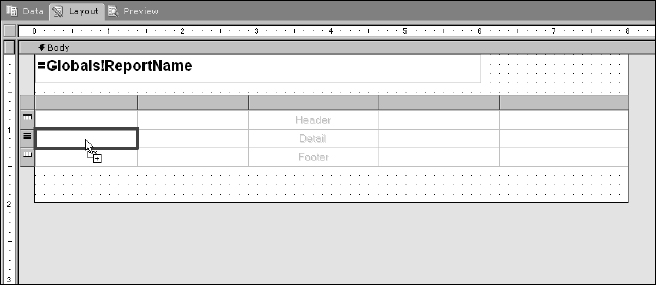
Figure 14-26
When using this technique, the designer not only sets the value of the text boxes in the detail row to the right field expression, but it also sets the text in the header row text boxes. As you see in Figure 14-27, fields with mixed-case names (such as SubCategory) are converted to title case. Every cell in a table contains a text box unless you replace it with a different report item. Different types of values should be formatted appropriately. I would like the currency value for the ListPrice field to be right-aligned and formatted as currency. Select the last column in the table by clicking the column header and then use the Report Formatting toolbar to right-align all of the cells in this column. I've also made the headers bold. The easiest method to set the properties for all cells in a row (in this case, the header text) is to use the row selector. Use this method to select the entire header row and then click the Bold button on the Report Formatting toolbar. To see the row and column selectors, you must first click on any cell in the table.
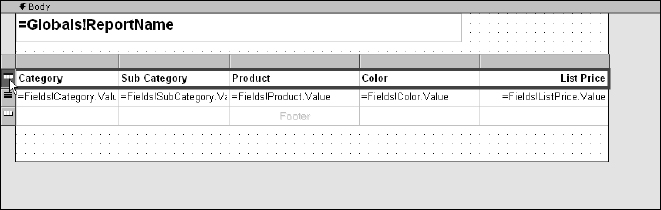
Figure 14-27
Setting Format Properties
To set the format for the ListPrice text box, select the text box and then right-click to open the Textbox Properties dialog. In Figure 14-28, you can see the table with the ListPrice cell selected prior to opening the Properties dialog.
All of an item's properties may be set using the properties utility window as well. In the Textbox Properties dialog, shown in Figure 14-29, indicate that this item is to be formatted as currency by selecting the Currency format from the Standard format list box. Click the OK button to return to the designer.
Configuring Report Parameters
The last step in completing the first iteration of the working report is to configure the CategoryID parameter I defined in the main dataset. By default, the user would have to type the CategoryID value into a text box in the report parameter bar. I'd like to make things a little easier for my user by listing the available product categories by name, along with the option to view products for all categories. You'll recall that I created a dataset for this purpose using a UNION expression.
With the Report Designer in layout view, drop down the Report menu on the Report Designer toolbar and select Report Parameters… , as shown in Figure 14-30. The Report Parameters dialog opens and you will see that the CategoryID query parameter is now listed as a report parameter.
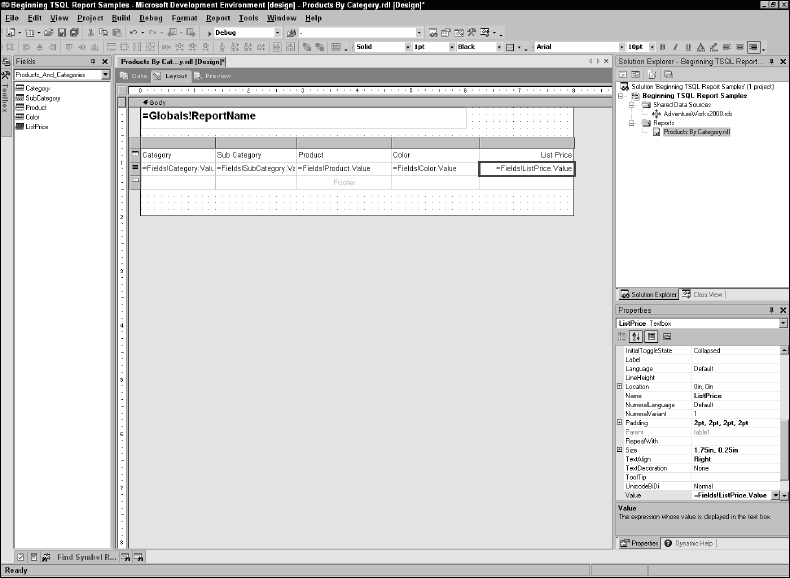
Figure 14-28
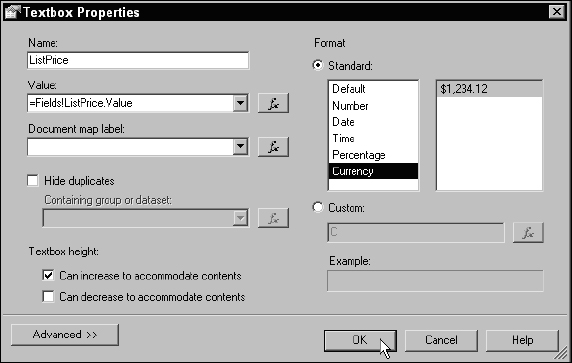
Figure 14-29
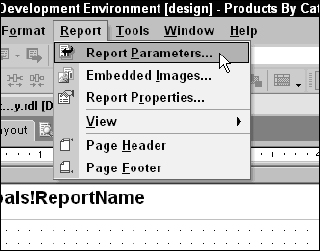
Figure 14-30
You defined a parameter in the query by prefixing the name with the @ symbol. This query parameter is now a report parameter. Just to clarify, a parameter defined in a query is known as a query parameter. Parameters can also be defined within the report, separate from query parameters. All query parameters are part of the report parameters collection.
Not all report parameters are necessarily query parameters. I won't go into this any more in this book, but you can do a lot of very creative things with report parameters that go way beyond the scope of simple, query-based filtering.
In the Report Parameters dialog, change the Prompt for this parameter to a friendly label. This is the text displayed in the parameter bar for the drop-down list containing the parameter values. I want to feed the Available Values list from a query. Choose this option and then select the dataset name, Category_List, from the Dataset drop-down. I defined two columns, the CategoryID and the Name. I want the CategoryID value to feed the actual parameter value so this become the Value Field selection, and I want my user to see only the Name field value in the list, so this becomes my Label Field selection.
Click the OK button when your selections look like that shown in Figure 14-31.
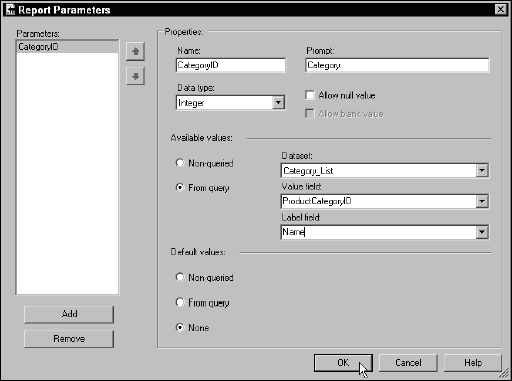
Figure 14-31
The report should be ready for testing. Switch to the Preview tab. Because the parameter wasn't configured with a default value, the report won't render until a parameter value is selected. At the top of the report preview pane the parameter drop-down list is displayed next to the label you defined. Drop down the list and select the first item, labeled (All Categories), as shown in Figure 14-32, and then click the View Report button on the right.
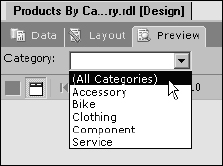
Figure 14-32
As the report begins to render, an animated icon is displayed. After a few seconds, you should see the first page of the report, as shown in Figure 14-33.
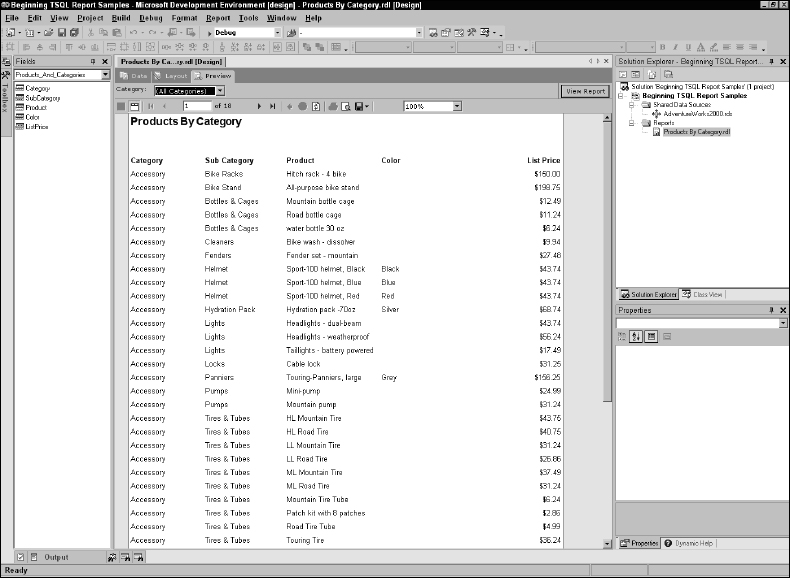
Figure 14-33
Notice the page count displayed just below the parameter list. If you navigate through the pages, you will see products for all of the categories. Now select one category from the list and click the View Report button again. This time, only products for the selected parameter are displayed, and the page count should be considerably less than before. The report should look similar to Figure 14-34.
It's not an elegant report by any means, and you can dress it up a bit by adding a shaded background to the header row. Switch back to the Layout tab, as shown in Figure 14-35, and select the header row as you did when you set the text to bold.
In the Properties window, find the BackgroundColor property and click the down arrow button to open the color selection list. From the list, select the color Silver, as demonstrated in Figure 14-36.
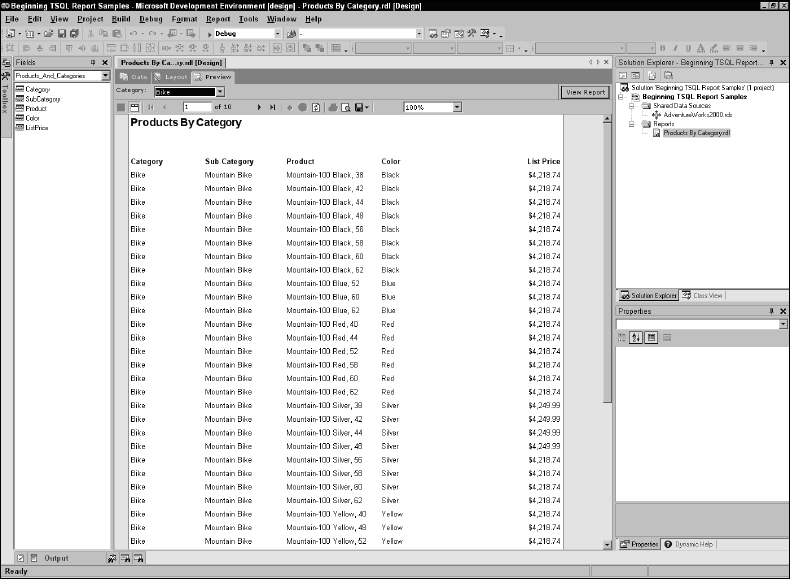
Figure 14-34
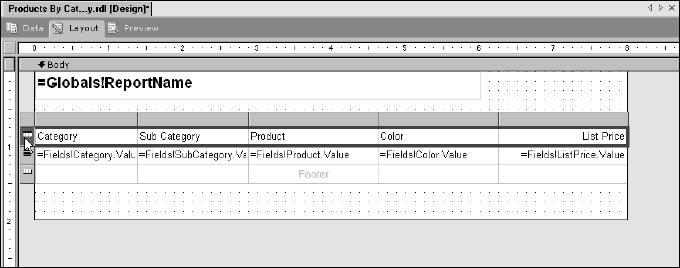
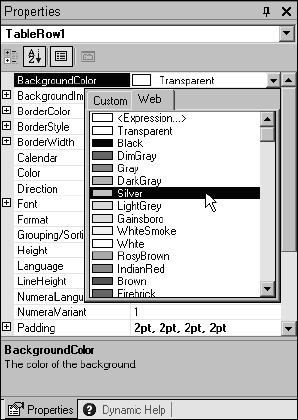
Figure 14-36
Adding Groups
Now you can begin grouping the data in the table. If you've worked with other reporting products, you may be accustomed to the idea of the report having banded sections used to group and sort the data. The same pattern applies here but this is a feature of the table rather than the report. Suppose you want to create two groups for category and for subcategory. Groups are created top-down, in order of their hierarchy. Begin by using the right mouse button to click the detail row selector. The pop-up menu displays several options that apply to the table row. Select Insert Group to open the Grouping and Sorting Properties dialog, as shown in Figure 14-37.
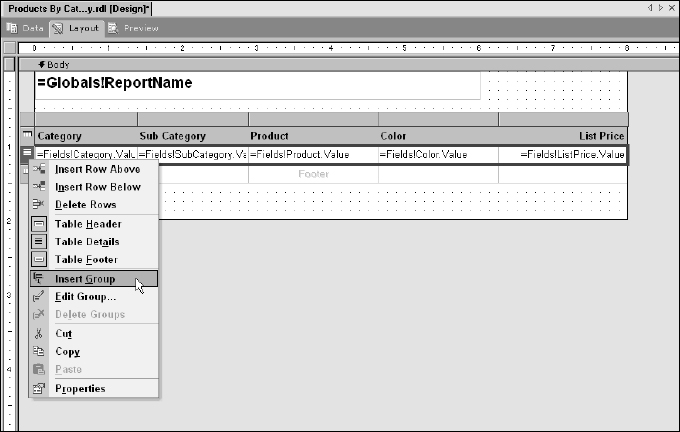
Figure 14-37
Like report items, a group is given a name. Drop-down the list in the first row of the Group on: expression list box, shown in Figure 14-38. You will see a list of field expressions. From this list, select =Fields!Category.Value and then click the OK button.
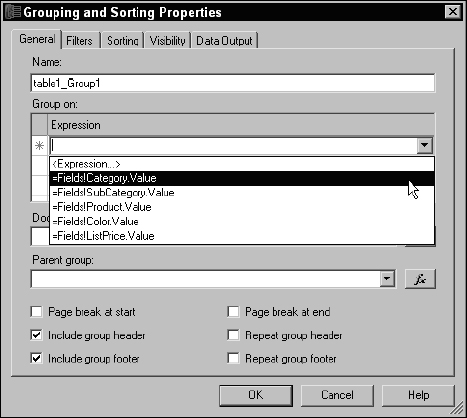
Figure 14-38
As you see, this adds two additional rows to the table that will be repeated for each instance of grouped values. As in Figure 14-39, you'll use the group header and footer rows to show the product category and subcategory headings and subtotals.
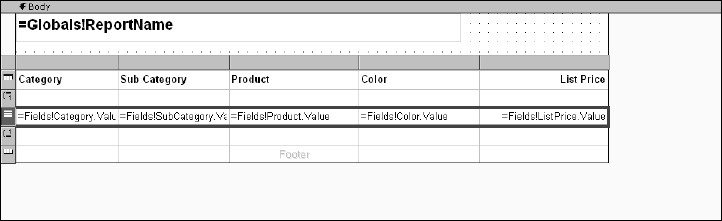
Figure 14-39
With the category group in place, also add another group for the product subcategory. Groups must be added in hierarchal order, from top to bottom. Just like you did before with the category group, right-click the detail row selector and add another group, as shown in Figure 14-40.
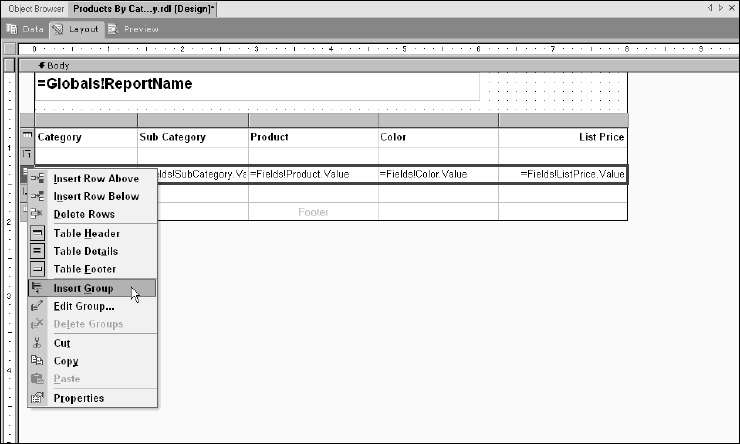
Figure 14-40
Select the SubCategory field expression, as shown in Figure 14-41, and then click the OK button.
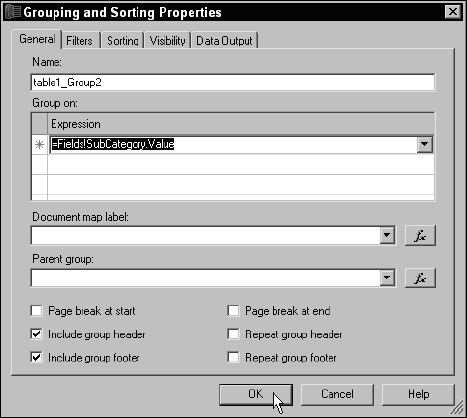
Figure 14-41
As you can see in Figure 14-42, when you click the OK button, a group header and footer appears in the table.
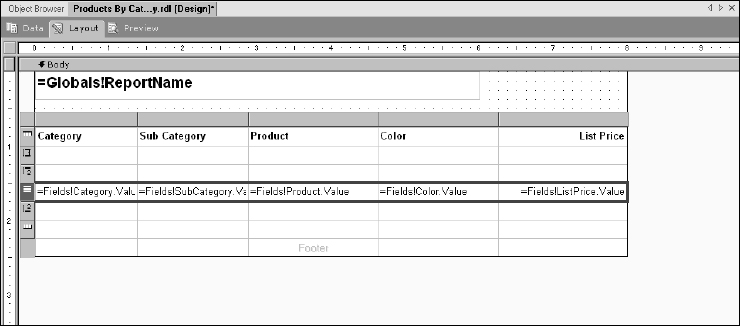
Figure 14-42
You can drag and drop the existing text boxes to different cells within the table. Do this with the Category and SubCategory fields. In the same column, place the Category text box in the group one header row and place the SubCategory text box in the group two header row, within the second column.
Make some additional room for these values. Because the category and subcategory fields don't have to share space on the same row with any other fields, you can set a cell to span adjacent cells to the right. This works much the same way as Excel and HTML tables. Begin with the Category field and drag across the other cells in the row to select them as a group. Right-click the selection and choose Merge Cells from the menu, as shown in Figure 14-43.
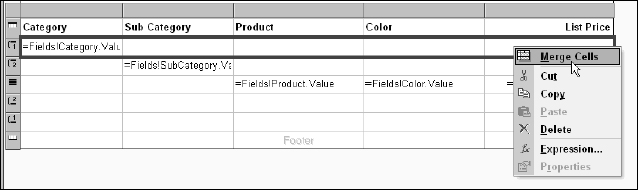
Figure 14-43
Repeat these steps with the SubCategory field, starting with the second cell in the group two header row. Group-select the remainder of the row, right-click and choose Merge Cells from the menu. Change the font size and weight for each of these headings. Go ahead and experiment with these properties to adjust the headings to your own liking. Report design is a little bit of an artistic endeavor. You'll need to try out ideas and test them by switching to the Preview tab.
I won't lead you through the rest of the process step by step. By now you should have a good feel for the basics of report design. In Figure 14-44, you can see the final design. In the group footers for the SubCategory and Category fields, I have added summaries using the Avg aggregate function with the ListPrice field. You'll also notice that I have labeled the SubCategory group footer (Group 2) with the expression:
=Fields!SubCategory.Value & “ average price:”
This is a Visual Basic expression used to prefix the group footer for the SubCategory field value.
The Category group footer is similar:
=Fields!Category.Value & “ average price:”
I've merged the cells on these rows to make room for this text. I did not merge the last column to make room for the ListPrice summary. Both of the group footers contain the same expression in the ListPrice column.
=Avg(Fields!ListPrice.Value)
Now it's finally time for some cosmetic touch-ups: Note the leading space in front of the footer label text. This is accomplished by using the padding properties of these cells. Select one of these cells (before or after it has been merged) and use the properties window to select the Padding properties group. Use the plus sign to expand the group and increase the Left Padding property to about 15 points (15pt.).
Now modify the borders to for the text boxes and table row. Group-select the cells in the table and then use the properties window to view the BorderStyle properties. Expand this group to reveal the Left, Right, Top, and Bottom properties. Set the Bottom border to Solid. You can also experiment with any of these properties to get different results.
To add a page footer section to the report, select this option from the Report menu. I've added a gray line and two text boxes to the page footer. The text boxes will display the date and time the report was executed and the page number (Page X of Y) at the bottom of each page.
My finished report design looks like that shown in Figure 14-44.
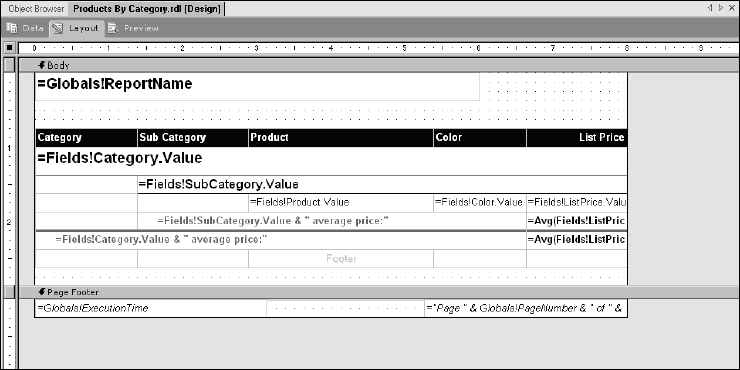
Figure 14-44
The final product, when rendered to the Preview pane, looks like that shown in Figure 14-45.
Deploying the report to the report server is actually very easy. Before this can be done from the Report Designer, Visual Studio needs to know where your report server is located. If you have a standard installation of Reporting Services on your local computer, do the following.
Using the Solution Explorer window on the right side of Visual Studio, right-click the project icon. This opens the project Property Pages dialog. Make sure that the TargetServerURL property is valid. The path shown in Figure 14-46 is correct for a default development workstation configuration.
In the Solution Explorer, right-click the report icon and choose Deploy from the menu. Assuming that there are no errors in the report design, the report will be deployed to your local server ready for use.

Figure 14-45
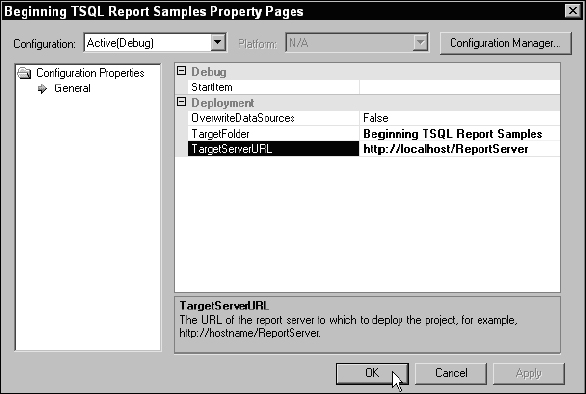
Figure 14-46
Viewing Report with the Report Manager
When Reporting Services is installed a shortcut is created in the SQL Server group for the Report Manager page. This shortcut can be found under Start![]() All Programs
All Programs![]() Microsoft SQL Server
Microsoft SQL Server![]() Reporting Services
Reporting Services![]() Report Manager. This opens a page located at http://localhost/Reports, as shown in Figure 14-47.
Report Manager. This opens a page located at http://localhost/Reports, as shown in Figure 14-47.
Report Data Caching
Possibly one of the most compelling features of Reporting Services is its ability to cache report data so that subsequent requests don't require the database to be re-queried. There are a number of ways that reports can be cached and that parameters can be used in combination to refresh cached data and filter cached results.
Report snapshots are a form of cached reports that are completely static. Snapshots are lightweight and simple. This may be an appropriate option for common reports that are produced at regular intervals and usually don't contain parameterized options. Snapshots can be placed into history so that one snapshot doesn't overwrite a previously cached rendering of the same report. Each snapshot is marked with a date and time stamp, and a specific number are typically held in history before they are overwritten. Snapshots are typically generated on a predefined schedule and users don't need to wait while queries run against live data.
Cached instance reports are more flexible than snapshots but take a little planning and design effort. When a report is configured for instance caching, each unique combination of query parameters causes a separate cached copy of the report data to be stored in the report server database. Further, non-query report parameters may be used to filter the data stored in the cache. A cached instance may be configured to “live” for a specific period of time or to expire on a regular schedule. Because the cache is populated when a report is requested, the first user who views the report must wait for the query to run. Subsequent users or requests run against the cache until it expires.
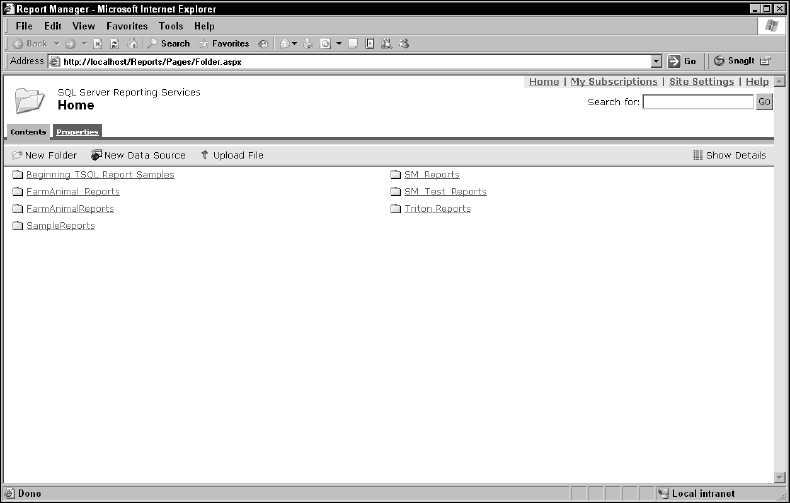
Figure 14-47
Report Application Integration
Reporting Services can be integrated into applications in several ways. These range from a simple hyperlink to fully embedded reports within custom and commercial applications. Using a hyperlink to open a report is uncomplicated. The following URL opens a report in a web browser window:
Parameters can either be left to be filled with default values, be provided by users, or may be provided in the URL request:
This URL opens a browser with the report displayed below a parameter bar, pre-filled with the parameter values supplied in the URL string, as shown in Figure 14-48.

Figure 14-48
This approach is simple and provides a great deal of functionality. However, this may not be an ideal interface for all reporting solutions. A more customized approach uses an ASP.NET Web Form, such as that shown in Figure 14-49. Sophisticated web controls may be used to prompt users for parameter values.
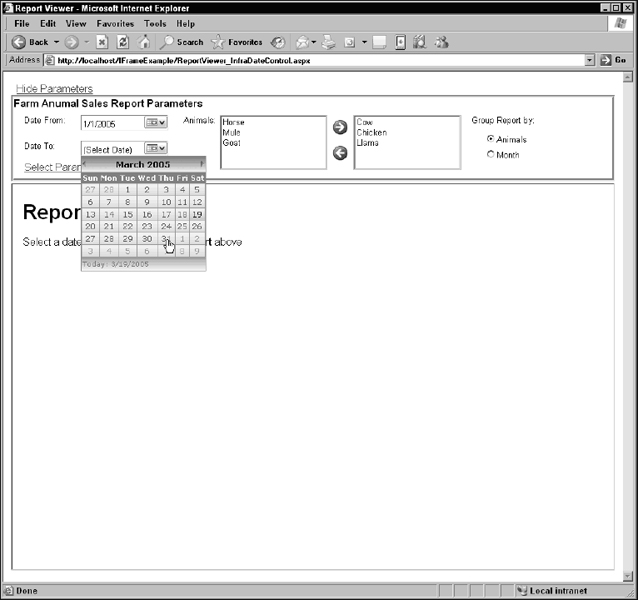
Figure 14-49
Parameter values are gathered from these controls and then concatenated into a URL like the previous example. A hyperlink control uses this URL to target an HTML frame on the Web Form. After using the custom parameter interface to choose a user's selection criteria, the link renders the report to the in-line frame embedded in the web page. As far as the user is concerned, this is simply a feature of a web browser-based custom business application (see Figure 14-50).
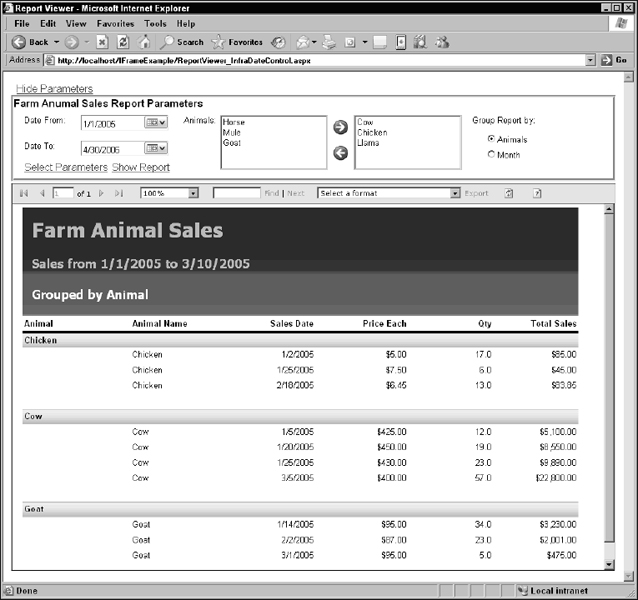
Figure 14-50
Summary
This chapter looked at how Transact-SQL is used in common applications and reporting solutions. A wide range of options are available for architecting and building database application solutions. Programming models vary in purpose and complexity. It's senseless to overengineer a solution with capabilities that won't ever be used—but it's also important to plan for future requirements. Striking the appropriate balance between these two principles is often the greatest challenge in database solution design.
Scalable solutions can accommodate a larger number of users without redesigning the fundamental application architecture. Scalable solutions make appropriate use of program components to separate the user interface from business logic and data access. How you implement Transact-SQL in an application plays an important role in its ability to handle whatever requirements may be discovered or imposed after the fact. Isolating database connections to separate reusable application components can simplify ongoing application design. Keeping SQL queries in database server objects, such as views, stored procedures, and user-defined functions, not only offers improved performance, but is also much more secure.
Finding the optimal balance between an application architecture that just gets the job done quickly and being able to adapt to any needs that could potentially arise is often a challenge. Ultimately, it is the long-term business requirements and objectives that should lead to choosing an application model that meets these needs. Fortunately, building scalable solutions is less costly using more capable programming objects and development tools.
Reporting is an important part of many business applications. SQL Server Reporting Services makes use of ad-hoc Transact-SQL statements, views, and stored procedures. These queries can include parameters to filter results and modify business logic. Reporting Services takes this concept to a level beyond SQL queries by allowing reports to filter cached data results and to provide rich, dynamic reporting capabilities, using report parameters and other advanced Reporting Services features.