Fast Facts
Certified Information Systems Auditor (CISA)
The fast facts listed in this chapter are designed as a refresher for some of the key knowledge areas required to pass the Certified Information Systems Auditor (CISA) certification exam. If you can spend an hour before your exam reading through this information, you will have a solid understanding of the key information required to succeed in each major area of the exam. You should be able to review the information presented here in less than an hour.
This summary cannot serve as a substitute for all the material supplied in this book. However, its key points should refresh your memory on critical topics. In addition to the information in this chapter, remember to review the glossary terms because they are intentionally not covered here.
ISACA (Information Systems Audit and Control Association) uses the job practice areas that are addressed in this book. The fast facts are arranged by these six job practice areas:
![]() IS Audit Process (approximately 10% of exam)
IS Audit Process (approximately 10% of exam)
![]() IT Governance (approximately 15% of exam)
IT Governance (approximately 15% of exam)
![]() Systems and Infrastructure Lifecycle Management (approximately 16% of exam)
Systems and Infrastructure Lifecycle Management (approximately 16% of exam)
![]() IT Service Delivery and Support (approximately 14% of exam)
IT Service Delivery and Support (approximately 14% of exam)
![]() Protection of Information Assets (approximately 31% of exam)
Protection of Information Assets (approximately 31% of exam)
![]() Business Continuity and Disaster Recovery (approximately 14% of exam)
Business Continuity and Disaster Recovery (approximately 14% of exam)
10IS Audit Process
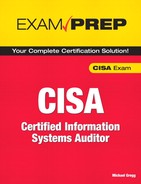
Standards are agreed-upon principles of protocol. ISACA standards are designed and developed by the ISACA standards board, which meets twice a year to develop ISACA standards to help advance the IS auditing profession. The term standard is used here to describe the category of guidance document, as shown in Table 1.
Table 1 Guidance Document Description
The following are some common categories of risks:
![]() Audit risk—The risk that an auditor will accept
Audit risk—The risk that an auditor will accept
![]() Control risk—The risk that might not be detected by a system of internal controls
Control risk—The risk that might not be detected by a system of internal controls
![]() Business risk—The risk that will affect the business’s functional goals
Business risk—The risk that will affect the business’s functional goals
![]() Continuity risk—The risk the business faces that it might not be able to recover from a disaster
Continuity risk—The risk the business faces that it might not be able to recover from a disaster
![]() Detection risk—The risk that an improper test is performed that will not detect a material error
Detection risk—The risk that an improper test is performed that will not detect a material error
![]() Material risk—An unacceptable risk
Material risk—An unacceptable risk
![]() Inherent risk—The risk of a material misstatement in the unaudited information assumed in the absence of internal control procedures
Inherent risk—The risk of a material misstatement in the unaudited information assumed in the absence of internal control procedures
![]() Security risk—The risk that unauthorized access to data will result in the exposure or loss of integrity of the data
Security risk—The risk that unauthorized access to data will result in the exposure or loss of integrity of the data
Risk mitigation addresses how risks will be handled. Risks can be avoided, reduced, accepted, or transferred, as described in more detail here:
![]() Avoid risk—Avoiding risk can seem like a simple alternative. You simply don’t perform the activity that allows the risk to be present. In reality, many activities cannot be avoided. Even when something can be avoided, an opportunity cost might be involved, so avoiding the risk can also avoid the opportunity for profit.
Avoid risk—Avoiding risk can seem like a simple alternative. You simply don’t perform the activity that allows the risk to be present. In reality, many activities cannot be avoided. Even when something can be avoided, an opportunity cost might be involved, so avoiding the risk can also avoid the opportunity for profit.
![]() Reduce risk—Reducing risk is one of the most common methods of dealing with a risk. An example of risk reduction could be installing a firewall or implementing a new internal accounting control.
Reduce risk—Reducing risk is one of the most common methods of dealing with a risk. An example of risk reduction could be installing a firewall or implementing a new internal accounting control.
![]() Accept risk—Risk acceptance means that the organization knows about the risk yet makes a conscious decision to accept the risk. Accepting risk means that the company is retaining the potential costs that are associated with the risk. As an example, a business might be thinking about building an e-commerce website but has determined that there will be an added risk. However, along with the risk is the potential to make greater revenues.
Accept risk—Risk acceptance means that the organization knows about the risk yet makes a conscious decision to accept the risk. Accepting risk means that the company is retaining the potential costs that are associated with the risk. As an example, a business might be thinking about building an e-commerce website but has determined that there will be an added risk. However, along with the risk is the potential to make greater revenues.
![]() Transfer risk—To transfer risk is to place the risk in someone else’s hands. The best example of risk transference is insurance. Although there are benefits to the approach, there are also some drawbacks. Chief among these is that insurance is an ongoing expense. In addition, it is time-consuming and costly to document and settle relatively small losses. Finally, even small payouts by the insurance company can have an adverse effect on future insurance costs.
Transfer risk—To transfer risk is to place the risk in someone else’s hands. The best example of risk transference is insurance. Although there are benefits to the approach, there are also some drawbacks. Chief among these is that insurance is an ongoing expense. In addition, it is time-consuming and costly to document and settle relatively small losses. Finally, even small payouts by the insurance company can have an adverse effect on future insurance costs.
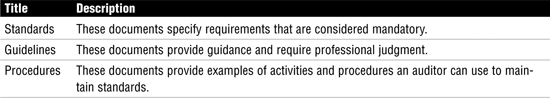
Management can use internal controls to exercise authority and effectively manage the organization. Controls typically start with high-level policy and are applied to all areas of the company. Controls filter down the organizational structure by means of policy and procedure. These procedures can be divided into two categories—general control and information system control; these are compared and contrasted in Table 2.
Table 2 Control Procedures
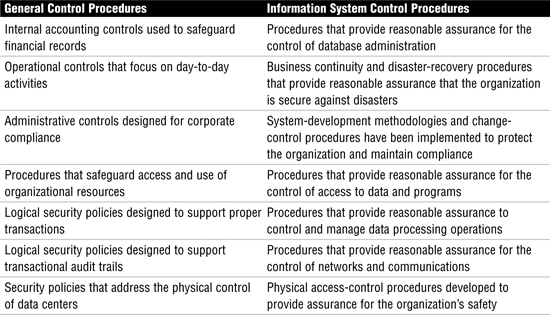
Internal controls can be preventive, detective, or corrective, as described more fully in Table 3.
Table 3 Control Categories
Sampling is the process of selecting items from a population of interest. When sampling is required, the most appropriate method for the auditor is to pull samples in an automated method. The following are the different types of sampling:
![]() Attribute sampling—Attribute sampling is used primarily for compliance testing. It records deviations by measuring the rate of occurrence that a sample has a certain attribute.
Attribute sampling—Attribute sampling is used primarily for compliance testing. It records deviations by measuring the rate of occurrence that a sample has a certain attribute.
![]() Variable sampling—Variable sampling is used primarily for substantive testing. It measures characteristics of the sample population, such as dollar amounts or other units of measurement.
Variable sampling—Variable sampling is used primarily for substantive testing. It measures characteristics of the sample population, such as dollar amounts or other units of measurement.
Attribute sampling is the primary sampling method used for compliance testing.
While strong internal controls, separation of duties, procedures, recordkeeping, and a structure of responsibility can reduce the frequency of fraud, it can still occur. Auditors should not overlook any of the following items, which are fraud indicators:
![]() No clear lines of authority
No clear lines of authority
![]() Lack of documents and records
Lack of documents and records
![]() Lack of independent checks and balances
Lack of independent checks and balances
![]() Inadequate or nonexistent separation of duties
Inadequate or nonexistent separation of duties
![]() Few internal controls
Few internal controls
20IT Governance
The primary role of an auditor in IT governance is to provide guidance and recommendations to senior management. The first step of this process is to review the following:
![]() Learn the organization—Know the company’s goals and objectives. Start by reviewing the mission statement.
Learn the organization—Know the company’s goals and objectives. Start by reviewing the mission statement.
![]() Review the IT strategic plan—Strategic plans provide details for the next three to five years.
Review the IT strategic plan—Strategic plans provide details for the next three to five years.
![]() Analyze organizational charts—Become familiar with the roles and responsibility of individuals within the company.
Analyze organizational charts—Become familiar with the roles and responsibility of individuals within the company.
![]() Study job descriptions—Job descriptions detail the level of responsibility and accountability for employees’ actions.
Study job descriptions—Job descriptions detail the level of responsibility and accountability for employees’ actions.
![]() Evaluate existing policies and procedures—These documents detail the approved activities of employees.
Evaluate existing policies and procedures—These documents detail the approved activities of employees.
The policy process can be driven from the top or from the bottom of the organization:
![]() In top-down policy development, policies are pushed down from the top of the company. The advantage of a top-down policy development approach is that it ensures that policy is aligned with the strategy of the company. What it lacks is speed; this process requires a substantial amount of time to implement.
In top-down policy development, policies are pushed down from the top of the company. The advantage of a top-down policy development approach is that it ensures that policy is aligned with the strategy of the company. What it lacks is speed; this process requires a substantial amount of time to implement.
![]() Bottom-up policy development addresses the concerns of operational employees: It starts with their input and concerns, and builds on known risk. This is faster than a top-down approach, but it does not always map well with high-level strategy.
Bottom-up policy development addresses the concerns of operational employees: It starts with their input and concerns, and builds on known risk. This is faster than a top-down approach, but it does not always map well with high-level strategy.
Direct observation is the best way to identify problems between procedure and activity. As an example, if a policy specifies a lockout policy but direct observation reveals that a no-lockout policy has been implemented, an auditor can then interview the process owner to find out why.
Standards, policies, and procedures all lay out important administrative controls. Table 4 highlights their relationship to the goal of the organization.
Table 4 Documentation/Level of Control
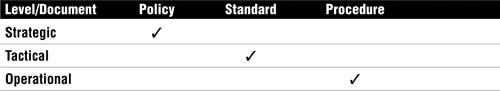
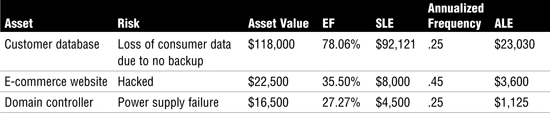
Table 5 shows sample quantitative risk assessment results.
The steps for quantitative risk assessment are as follows:
1. Determine the exposure factor—This is a subjective potential percentage of loss to a specific asset if a specific threat is realized. This is usually in the form of a percentage, similar to how weather reports predict the likelihood of weather conditions.
2. Calculate the single loss expectancy (SLE)—The SLE value is a dollar figure that represents the organization’s loss from a single loss or the loss of this particular information asset. SLE is calculated as follows:
Single Loss Expectancy = Asset Value × Exposure Factor
Items to consider when calculating the SLE include the physical destruction or theft of assets, loss of data, theft of information, and threats that might delay processing.
3. Assign a value for the annualized rate of occurrence (ARO)—The ARO represents the estimated frequency at which a given threat is expected to occur. Simply stated, how many times is this expected to happen in one year?
4. Assign a value for the annualized loss expectancy (ALE)—The ALE is an annual expected financial loss to an organization’s information asset because of a particular threat occurring within that same calendar year. ALE is calculated as follows:
Annualized Loss Expectancy (ALE) =
Single Loss Expectancy (SLE) × Annualized Rate of Occurrence (ARO)
The ALE is typically the value that senior management needs to assess to prioritize resources and determine what threats should receive the most attention.
5. Analyze the risk to the organization—The final step is to evaluate the data and decide to accept, reject, or transfer the risk.
Table 5 Sample Assessment Results
ISO 9001 certification requires an organization to perform a deficiency assessment or gap analysis. This allows the company to identify shortcomings that must be addressed to obtain certification.
Some basic common controls should be used during the hiring process:
![]() Background checks
Background checks
![]() Education checks
Education checks
![]() Reference checks
Reference checks
![]() Confidentiality agreements
Confidentiality agreements
![]() Noncompete agreements
Noncompete agreements
![]() Conflict of interest agreements
Conflict of interest agreements
After they’re hired, employees should be provided with an employee handbook that details employees’ code of conduct, acceptable use of company assets, and employee responsibilities to the company. Per ISACA, the handbook should address the following issues:
![]() Security practices, policies, and procedures
Security practices, policies, and procedures
![]() Employee package of benefits
Employee package of benefits
![]() Paid holiday and vacation policy
Paid holiday and vacation policy
![]() Work schedule and overtime policy
Work schedule and overtime policy
![]() Moonlighting and outside employment
Moonlighting and outside employment
![]() Employee evaluations
Employee evaluations
![]() Disaster response and emergency procedures
Disaster response and emergency procedures
![]() Disciplinary action process for noncompliance
Disciplinary action process for noncompliance
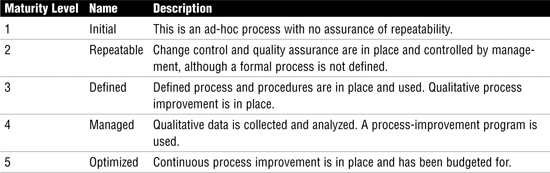
The Capability Maturity Model (CMM) has five maturity levels, shown in Table 6.
Table 6 Capability Maturity Model
Control Objectives for Information and Related Technology (CobiT) was designed for performance management and IT management, and is considered a system of best practices. CobiT was created by ISACA and the IT Governance Institute (ITGI) in 1992. It is designed around 34 key processes, which address the following:
![]() Performance concerns
Performance concerns
![]() IT control profiling
IT control profiling
![]() Awareness
Awareness
![]() Benchmarking
Benchmarking
30Systems and Infrastructure Lifecycle Management
Projects are constrained by their scope, time, and cost. Therefore, one must consider the following:
![]() Scope—How much work is defined? What do the sponsor and the customer expect from this project?
Scope—How much work is defined? What do the sponsor and the customer expect from this project?
![]() Time—How long is this project scheduled to run? Does it have a defined schedule?
Time—How long is this project scheduled to run? Does it have a defined schedule?
![]() Cost—How much money is this project expected to cost? Has the sponsor approved it?
Cost—How much money is this project expected to cost? Has the sponsor approved it?
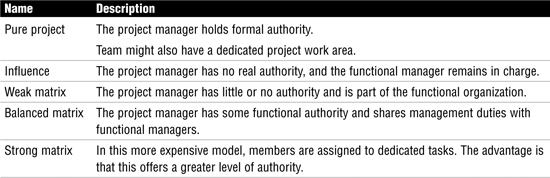
Projects must take on an organizational form. Table 7 shows the primary types of project organizational forms.
Table 7 Project Organizational Types
Critical path methodology (CPM) determines what activities are critical and identifies the dependencies between the various tasks. CPM is accomplished by doing the following:
![]() Compiling a list of each task required to complete the project
Compiling a list of each task required to complete the project
![]() Determining the time that each task will take from start to finish
Determining the time that each task will take from start to finish
![]() Examining the dependencies between each task
Examining the dependencies between each task
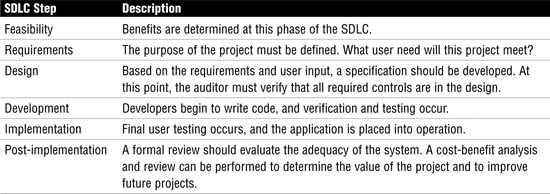
Table 8 describes each phase of the system development lifecycle (SDLC).
Table 8 SDLC Overview
An entity relationship diagram (ERD) helps map the requirements and define the relationship between elements. The basic components of an ERD are an entity and relationship. An entity is very much like a database, in that it is a grouping of like data elements. An entity has specific attributes, which are called the entity’s primary key. Entities are drawn as a rectangular box with an identifying name. Relationships describe how entities are related to each other and are defined as a diamond.
In computer programming, it is important to test software to make sure it meets all requirements. Test classifications are divided into the following categories:
![]() Unit testing—Examines an individual program or module
Unit testing—Examines an individual program or module
![]() Interface testing—Examines hardware or software to evaluate how well data can be passed from one entity to another
Interface testing—Examines hardware or software to evaluate how well data can be passed from one entity to another
![]() System testing—Consists of a series of tests, which can include recovery testing, security testing, stress testing, volume testing, regression testing, and performance testing
System testing—Consists of a series of tests, which can include recovery testing, security testing, stress testing, volume testing, regression testing, and performance testing
![]() Final acceptance testing—Usually performed at the implementation phase, after the project staff has satisfied all other tests and when the application is ready to be deployed
Final acceptance testing—Usually performed at the implementation phase, after the project staff has satisfied all other tests and when the application is ready to be deployed
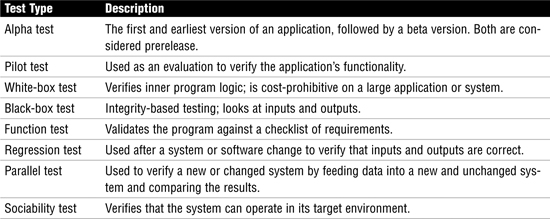
Table 9 lists some other types of tests used for requirement verification.
Table 9 Testing Types
Changeover techniques include the following:
![]() Parallel operation—Both the old and new systems are run at the same time. Results between the two systems can be compared. Fine-tuning can also be performed on the new system as needed. As confidence in the new system improves, the old system can be shut down. The primary disadvantage of this method is that both systems must be maintained for a period of time.
Parallel operation—Both the old and new systems are run at the same time. Results between the two systems can be compared. Fine-tuning can also be performed on the new system as needed. As confidence in the new system improves, the old system can be shut down. The primary disadvantage of this method is that both systems must be maintained for a period of time.
![]() Phased changeover—If the system is large, a phased changeover might be possible. With this method, systems are upgraded one piece at a time.
Phased changeover—If the system is large, a phased changeover might be possible. With this method, systems are upgraded one piece at a time.
![]() Hard changeover—This method establishes a date when users will be forced to change over. The advantage of the hard changeover is that it forces all users to change at once. However, this introduces a level of risk into the environment because things can go wrong.
Hard changeover—This method establishes a date when users will be forced to change over. The advantage of the hard changeover is that it forces all users to change at once. However, this introduces a level of risk into the environment because things can go wrong.
The SDLC is not the only development methodology used today. As an auditor, you must be knowledgeable of other development methods and have a basic understanding of their operation.
![]() Incremental development—This method defines an approach that develops systems in stages so that development is performed one step at a time. A minimal working system can be deployed while subsequent releases build on functionally or scope.
Incremental development—This method defines an approach that develops systems in stages so that development is performed one step at a time. A minimal working system can be deployed while subsequent releases build on functionally or scope.
![]() Waterfall—This well-defined linear model assumes that requirements will remain stable.
Waterfall—This well-defined linear model assumes that requirements will remain stable.
![]() Spiral development—The spiral model was developed based on the experience of the waterfall model. The spiral model is based on the concept that software development is evolutionary. It begins by creating a series of prototypes to develop a solution. As the project continues it spirals out, becoming more detailed. Each step passes through planning, requirements, risks, and development phases.
Spiral development—The spiral model was developed based on the experience of the waterfall model. The spiral model is based on the concept that software development is evolutionary. It begins by creating a series of prototypes to develop a solution. As the project continues it spirals out, becoming more detailed. Each step passes through planning, requirements, risks, and development phases.
![]() Prototyping—The prototyping model reduces the time required to deploy applications. Prototyping uses high-level code to quickly turn design requirements into application screens and reports that the users can review. User feedback is used to fine-tune the application and improve it. Top-down testing works well with prototyping. Although prototyping clarifies user requirements, it can result in overly optimistic project timelines. Also, because change happens quickly, it might not be properly documented, which is a real concern for the auditor.
Prototyping—The prototyping model reduces the time required to deploy applications. Prototyping uses high-level code to quickly turn design requirements into application screens and reports that the users can review. User feedback is used to fine-tune the application and improve it. Top-down testing works well with prototyping. Although prototyping clarifies user requirements, it can result in overly optimistic project timelines. Also, because change happens quickly, it might not be properly documented, which is a real concern for the auditor.
![]() Rapid application development (RAD)—RAD uses an evolving prototype and requires heavy user involvement. Per ISACA, RAD requires well-trained development teams that use integrated power tools for modeling and prototyping. With the RAD model, strict limits are placed on development time. RAD has four unique stages, which include concept, functional design, development, and deployment.
Rapid application development (RAD)—RAD uses an evolving prototype and requires heavy user involvement. Per ISACA, RAD requires well-trained development teams that use integrated power tools for modeling and prototyping. With the RAD model, strict limits are placed on development time. RAD has four unique stages, which include concept, functional design, development, and deployment.
![]() Extreme programming (XP)—The XP development model requires that teams include business managers, programmers, and end users. These teams are responsible for developing useable applications in short periods of time. Issues with XP include that teams are responsible not only for coding, but also for writing the tests used to verify the code. Lack of documentation is another concern. XP does not scale well for large projects.
Extreme programming (XP)—The XP development model requires that teams include business managers, programmers, and end users. These teams are responsible for developing useable applications in short periods of time. Issues with XP include that teams are responsible not only for coding, but also for writing the tests used to verify the code. Lack of documentation is another concern. XP does not scale well for large projects.
![]() Scrum—Scrum is an iterative development method in which repetitions are referred to as sprints and typically last 30 days. Scrum is typically used with object-oriented technology, requires strong leadership, and requires the team to meet each day for a short time. The idea is to move planning and directing tasks from the project manager to the team. The project manager’s main task is to work on removing any obstacles from the team’s path.
Scrum—Scrum is an iterative development method in which repetitions are referred to as sprints and typically last 30 days. Scrum is typically used with object-oriented technology, requires strong leadership, and requires the team to meet each day for a short time. The idea is to move planning and directing tasks from the project manager to the team. The project manager’s main task is to work on removing any obstacles from the team’s path.
Table 10 provides an overview of input/output, processing, and output controls.
Table 10 Business Process Controls
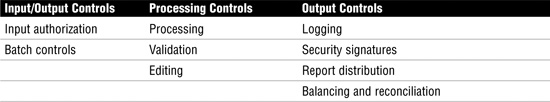
Table 11 lists the control techniques used to protect the integrity of the data.
Table 11 Processing Control Techniques

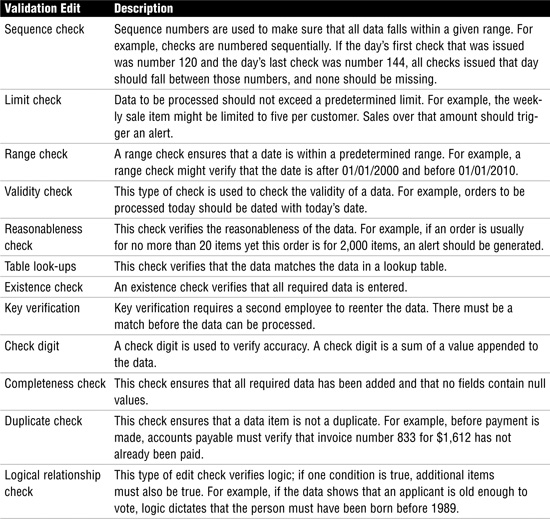
Table 12 describes edit controls.
Table 12 Processing Edit Controls
Per ISACA, output controls should address the following:
![]() Logging and storage of sensitive negotiable and critical forms
Logging and storage of sensitive negotiable and critical forms
![]() Negotiable instruments, forms, and signatures that are computer generated
Negotiable instruments, forms, and signatures that are computer generated
![]() Distribution control
Distribution control
![]() Balancing and reconciliation of control totals
Balancing and reconciliation of control totals
![]() Output errors (logged and reviewed)
Output errors (logged and reviewed)
![]() Retention records that specify how long output data should be stored or maintained
Retention records that specify how long output data should be stored or maintained
When working with applications, auditors should observe and test the items in Table 13.
Table 13 Observation and Test

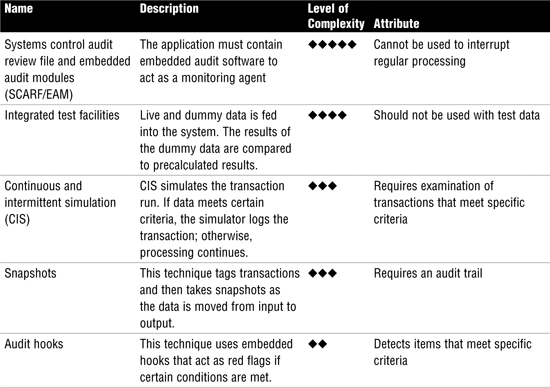
Continuous online auditing also increases security. Overall, five techniques are used, as described in Table 14.
Table 14 Continuous Audit Techniques
40IT Service Delivery and Support
The auditor should know to review the problem log to verify that problems are being resolved. Auditors must also check to see that problems are being handled by the most appropriate department or individual.
Sufficient controls should be in place to prevent nonproduction code from inadvertently being executed in the production environment. Ensuring that these requirements are met is a complicated task that can be made easier by verifying that the program library system has certain capabilities:
![]() Integrity—Each piece of source code should be assigned a unique ID and version number. Security should be maintained through password-controlled directories, encryption, and regular backups. Periodic security audits should be performed.
Integrity—Each piece of source code should be assigned a unique ID and version number. Security should be maintained through password-controlled directories, encryption, and regular backups. Periodic security audits should be performed.
![]() Update—Any changes or modification to source code should be tracked, and an audit trail should be produced.
Update—Any changes or modification to source code should be tracked, and an audit trail should be produced.
![]() Reporting—Controls should be in place to report changes to code or any modification.
Reporting—Controls should be in place to report changes to code or any modification.
![]() Interface—Library management systems need to interface with the OS, access-control system, audit, and access-control mechanisms.
Interface—Library management systems need to interface with the OS, access-control system, audit, and access-control mechanisms.
Source code comparison is one way to verify code. However, it is important to be aware that source code comparison has its limitations. As an example, it cannot detect a change in source code that has been changed and restored between checks. Compiled code must also be examined.
Release management is the discipline within software management of controlling the release of software to end users. Releases can be divided into one of several categories:
![]() Emergency fix—These are updates that need to be done quickly. These are sometimes referred to as a patch. An emergency fix is designed to fix a small number of known problems. This can be dangerous because it might introduce additional errors into the program.
Emergency fix—These are updates that need to be done quickly. These are sometimes referred to as a patch. An emergency fix is designed to fix a small number of known problems. This can be dangerous because it might introduce additional errors into the program.
![]() Minor release—Minor releases contain small enhancements or fixes that supersede an emergency fix. Minor releases improve performance, reliability, or security.
Minor release—Minor releases contain small enhancements or fixes that supersede an emergency fix. Minor releases improve performance, reliability, or security.
![]() Major release—Major releases supersede minor releases and emergency fixes. They are designed to provide a significant improvement to the program. Major releases are usually scheduled to be released at predetermined times, such as quarterly, biannually, or yearly.
Major release—Major releases supersede minor releases and emergency fixes. They are designed to provide a significant improvement to the program. Major releases are usually scheduled to be released at predetermined times, such as quarterly, biannually, or yearly.
CPUs have two primary components, the control unit and the arithmetic logic unit. The arithmetic logic unit is where computations are performed and can be described as the brain of the CPU. The control unit handles the sequence of operations for the CPU and is also responsible for the retrieval of instructions and data. CPUs also have different types of registers to hold data and instructions.
CPUs can be classified in one of several categories, based on its functionality:
![]() Multiprogramming—The CPU can interleave two or more programs for execution at any one time.
Multiprogramming—The CPU can interleave two or more programs for execution at any one time.
![]() Multitasking—The CPU can perform one or more tasks or subtasks at a time.
Multitasking—The CPU can perform one or more tasks or subtasks at a time.
![]() Multiprocessor—The computer has support for more than one CPU. As an example, Windows 95 does not support a multiprocessor, but Windows Longhorn does.
Multiprocessor—The computer has support for more than one CPU. As an example, Windows 95 does not support a multiprocessor, but Windows Longhorn does.
ROM is typically used to load and store firmware. ROM is considered nonvolatile, in that it retains information even if power is removed. Some common types of ROM include the following:
![]() Erasable Programmable Read-Only Memory (EPROM)
Erasable Programmable Read-Only Memory (EPROM)
![]() Electrically Erasable Programmable Read-Only Memory (EEPROM)
Electrically Erasable Programmable Read-Only Memory (EEPROM)
![]() Flash memory
Flash memory
![]() Programmable logic devices (PLD)
Programmable logic devices (PLD)
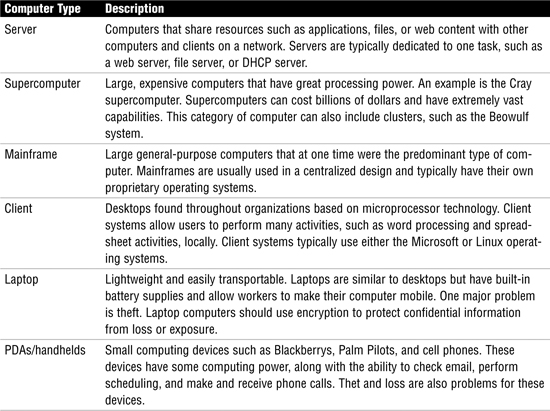
Computers can be categorized by the role they play in the organization, their amount of processing power, and their architecture or design. Table 15 outlines the common computer types.
Table 15 Computer Types
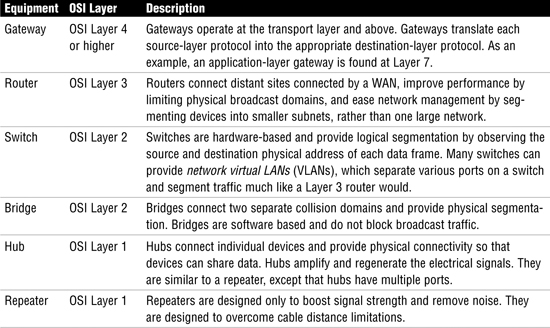
Most networks also consist of some common hardware elements, which are discussed in more depth in Chapter 6 but are summarized here in Table 16.
Table 16 Common Hardware Elements Used for IT Delivery

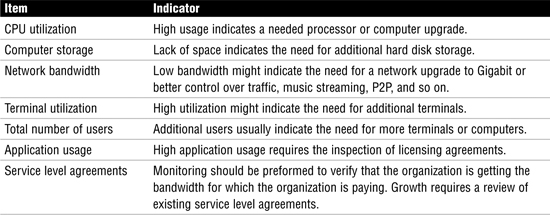
Capacity management requires analyzing current utilization, past performance, and capacity changes. Table 17 lists capacity-management issues.
Table 17 Capacity-Management Issues
Programs can be hard-coded instruction or firmware, or can be executed by a higher-layer process. Regardless of the format, code must be translated into a language that the computer will understand. The three most common methods of conversion are as follows:
![]() Assembler—An assembler is a program that translates assembly language into machine language.
Assembler—An assembler is a program that translates assembly language into machine language.
![]() Compiler—A compiler translates a high-level language into machine language.
Compiler—A compiler translates a high-level language into machine language.
![]() Interpreter—An interpreter does not assemble or compile; it takes an alternate approach and translates the program line by line. Interpreters fetch and execute.
Interpreter—An interpreter does not assemble or compile; it takes an alternate approach and translates the program line by line. Interpreters fetch and execute.
The five generations of computer languages are as follows:
![]() Generation One: Machine language
Generation One: Machine language
![]() Generation Two: Assembly language
Generation Two: Assembly language
![]() Generation Three: High-level language, such as FORTRAN
Generation Three: High-level language, such as FORTRAN
![]() Generation Four: Very high-level language, such as Structured Query Language
Generation Four: Very high-level language, such as Structured Query Language
![]() Generation Five: Natural language, such as Prolog or LISP
Generation Five: Natural language, such as Prolog or LISP
Databases are widely used. If you are not familiar with databases, you might not be familiar with the following terms:
![]() Aggregation—The process of combining several low-sensitivity items to produce a higher-sensitivity data item.
Aggregation—The process of combining several low-sensitivity items to produce a higher-sensitivity data item.
![]() Attribute—A single data item related to a database object.
Attribute—A single data item related to a database object.
![]() Field—The smallest unit of data within a database.
Field—The smallest unit of data within a database.
![]() Foreign key—An attribute in one table whose value matches the primary key in another table.
Foreign key—An attribute in one table whose value matches the primary key in another table.
![]() Granularity—The control one has over the view someone has of the database. Highly granular databases can restrict certain fields or rows from unauthorized individuals.
Granularity—The control one has over the view someone has of the database. Highly granular databases can restrict certain fields or rows from unauthorized individuals.
![]() Relation—Data that is represented by a collection of tables.
Relation—Data that is represented by a collection of tables.
Per ISACA, three primary types of database structures exist:
![]() Hierarchical database-management systems (HDMS)
Hierarchical database-management systems (HDMS)
![]() Network database-management systems (NDMS)
Network database-management systems (NDMS)
![]() Relational database-management systems (RDMS)
Relational database-management systems (RDMS)
During transactions, controls can be put in place. These are sometimes referred to as the acid test, which is defined as follows:
![]() Atomicity—Results of a transaction are either all or nothing.
Atomicity—Results of a transaction are either all or nothing.
![]() Consistency—Transactions are processed only if they meet system-defined integrity constraints.
Consistency—Transactions are processed only if they meet system-defined integrity constraints.
![]() Isolation—The results of a transaction are invisible to all other transactions until the original transaction is complete.
Isolation—The results of a transaction are invisible to all other transactions until the original transaction is complete.
![]() Durability—Once complete, the results of the transaction are permanent.
Durability—Once complete, the results of the transaction are permanent.
The ISO is recognized for its development of the OSI model. The ISO set the worldwide standards for its work in developing a common approach to networking. The seven layers of the OSI model are application, presentation, session, transport, network, data link, and physical.
Networks can use a variety of topologies. The topology is the physical design of the network. Topologies include bus, star, ring, and mesh, as summarized in Table 18.
Table 18 Description and Features of Various Topologies
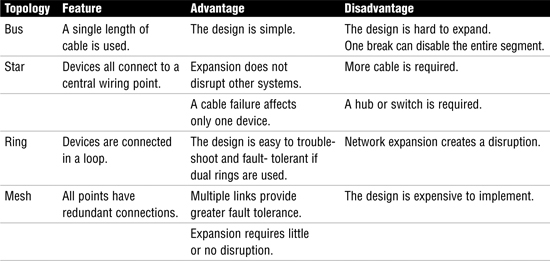
Table 19 provides an overview of the primary types of network equipment.
Table 19 Network Equipment
50Protection of Information Assets
Privacy of personal information is a very important issue. Companies need to address this concern early by developing a company-wide policy based on a privacy impact analysis (PIA). The PIA should evaluate privacy risks and ensure that appropriate privacy controls exist.
The discretionary access control (DAC) model is so titled because access control is left to the owner’s discretion. DAC allows the owner to activate security controls as necessary. An analogy of DAC can be seen in a peer-to-peer network.
A mandatory access control (MAC) model is static and based on a predetermined list of access privileges; therefore, in a MAC-based system, access is determined by the system rather than the user. Organizations that handle highly sensitive data, such as the U.S. Department of Defense, the National Security Administration, the Central Intelligence Agency, and the Federal Bureau of Investigation, typically use the MAC model.
Three authentication methods exist:
![]() Authentication by knowledge—What a user knows
Authentication by knowledge—What a user knows
![]() Authentication by ownership—What a user has
Authentication by ownership—What a user has
![]() Authentication by characteristic—What a person is and does
Authentication by characteristic—What a person is and does
Biometric systems are an example of authentication by characteristic, whether it is by a physiological trait, such as a fingerprint or retina scan, or by behavioral characteristic, such as keystroke or signature pattern. Some common biometric types include the following:
![]() Fingerprint
Fingerprint
![]() Hand geometry
Hand geometry
![]() Palm scan
Palm scan
![]() Voice pattern
Voice pattern
![]() Iris pattern/recognition
Iris pattern/recognition
![]() Signature dynamics
Signature dynamics
![]() Facial recognition
Facial recognition
![]() Keystroke dynamics
Keystroke dynamics
Important concerns for the IS auditor when examining biometric systems include the following:
![]() False reject rate (FRR)—The FRR is the percentage of legitimate users who are denied access. This is also known as Type I errors.
False reject rate (FRR)—The FRR is the percentage of legitimate users who are denied access. This is also known as Type I errors.
![]() False accept rate (FAR)—This measurement is the percentage of users who are allowed access and who are not authorized users. This is also known as Type II errors.
False accept rate (FAR)—This measurement is the percentage of users who are allowed access and who are not authorized users. This is also known as Type II errors.
![]() Equal error rate (EER)—A measurement that indicates the point at which FRR equals FAR. Low numbers indicate that the system has greater accuracy.
Equal error rate (EER)—A measurement that indicates the point at which FRR equals FAR. Low numbers indicate that the system has greater accuracy.
Passive attacks do not inject traffic into the network or attempt other types of active activities. Sniffing, done with a network sniffer or analyzer, is a good example of a passive attack.
Active attacks inject traffic, modify systems, and seek to change settings to gain access or escalate privilege of the network or system. The least technical active attack is social engineering.
What if passive or active attacks don’t work? The attacker might decide to launch a denial-of-service (DoS) attack. Some common DoS attacks include the following:
![]() Ping of death—Uses an oversized IP packet.
Ping of death—Uses an oversized IP packet.
![]() Smurf—Sends a message to the broadcast of a subnet or network so that every node on the network produces one or more response packets.
Smurf—Sends a message to the broadcast of a subnet or network so that every node on the network produces one or more response packets.
![]() Syn flood—Manipulates the standard three-way handshake used by TCP.
Syn flood—Manipulates the standard three-way handshake used by TCP.
![]() Trinoo—Launches UDP flood attacks from various channels on a network.
Trinoo—Launches UDP flood attacks from various channels on a network.
![]() Botnets—Botnets are another tool used for DDoS attacks. A botnet is a collection of computers hijacked during virus and worm attacks that are now under the control of a remote attacker. Botnets can be used to launch a variety of TCP and UDP flood attacks.
Botnets—Botnets are another tool used for DDoS attacks. A botnet is a collection of computers hijacked during virus and worm attacks that are now under the control of a remote attacker. Botnets can be used to launch a variety of TCP and UDP flood attacks.
Firewalls have gone through what are considered generational improvements. The five generations of firewalls include the following:
![]() Packet filtering—These are considered the first generation of firewalls. Packet filtering can be performed by routers and is the lowest form of packet inspection. Packet filters cannot keep track of status and make a pass or drop decision on items such as port, protocol, and IP address.
Packet filtering—These are considered the first generation of firewalls. Packet filtering can be performed by routers and is the lowest form of packet inspection. Packet filters cannot keep track of status and make a pass or drop decision on items such as port, protocol, and IP address.
![]() Stateful inspection—Stateful-inspection firewalls provide the same functionality as packet filters, but they can track the status of the session. Therefore, if a type of reply is presented to the firewall, it can actually look to see if this reply is in response to a valid request.
Stateful inspection—Stateful-inspection firewalls provide the same functionality as packet filters, but they can track the status of the session. Therefore, if a type of reply is presented to the firewall, it can actually look to see if this reply is in response to a valid request.
![]() Proxy—A proxy is referred to as a circuit-level firewall because it resides between a client and the Internet. A proxy stands in place of each party. It increases security by presenting a single IP address to the Internet and prevents direct access to an internal client.
Proxy—A proxy is referred to as a circuit-level firewall because it resides between a client and the Internet. A proxy stands in place of each party. It increases security by presenting a single IP address to the Internet and prevents direct access to an internal client.
![]() Dynamic packet filtering—This generation of firewalls addresses the challenges of dynamic ports. As an example, when an FTP client communicates to an FTP server, a dynamically assigned port is used to transfer files and data. Historically, a firewall administrator might have left a wide range of high-order ports open for this activity. Dynamic packet filtering allows an open port to be generated as needed and then closed when the communication is completed.
Dynamic packet filtering—This generation of firewalls addresses the challenges of dynamic ports. As an example, when an FTP client communicates to an FTP server, a dynamically assigned port is used to transfer files and data. Historically, a firewall administrator might have left a wide range of high-order ports open for this activity. Dynamic packet filtering allows an open port to be generated as needed and then closed when the communication is completed.
![]() Kernel proxy—In this fifth and most advanced type of firewall, a kernel proxy builds a virtual stack to examine each packet at each layer to ensure integrity. Not only is a kernel proxy fast, but it also can perform address translation.
Kernel proxy—In this fifth and most advanced type of firewall, a kernel proxy builds a virtual stack to examine each packet at each layer to ensure integrity. Not only is a kernel proxy fast, but it also can perform address translation.
Intrusion-detection systems (IDS) play a critical role in the protection of the IT infrastructure. Intrusion detection involves monitoring network traffic, detecting attempts to gain unauthorized access to a system or resource, and notifying the appropriate individuals so that counteractions can be taken.
IDS systems can be divided into two broad categories:
![]() Network-based intrusion-detection systems (NIDs)
Network-based intrusion-detection systems (NIDs)
![]() Host-based intrusion-detection systems (HIDs)
Host-based intrusion-detection systems (HIDs)
IDS detection methods include the following:
![]() Statistical—This IDS detection method requires the administrator to use profiles of authorized activities or place them into the IDS so that it understands normal activity. A considerable amount of time is needed to make sure the IDS produce few false negatives. These systems trigger when individuals deviate from specified behavior.
Statistical—This IDS detection method requires the administrator to use profiles of authorized activities or place them into the IDS so that it understands normal activity. A considerable amount of time is needed to make sure the IDS produce few false negatives. These systems trigger when individuals deviate from specified behavior.
![]() Signature—This IDS detection method requires the administrator to load a database of known attacks. As soon as the signatures are loaded into the IDS, it can begin to guard the network. These systems cannot guard against new attacks that have not yet been loaded into the IDS.
Signature—This IDS detection method requires the administrator to load a database of known attacks. As soon as the signatures are loaded into the IDS, it can begin to guard the network. These systems cannot guard against new attacks that have not yet been loaded into the IDS.
![]() Neural—This IDS detection method requires the administrator to place the IDS in learning mode so that it understands normal patterns of activity. It functions much like a statistical IDS. These systems can be fooled because the attack makes very small incremental changes.
Neural—This IDS detection method requires the administrator to place the IDS in learning mode so that it understands normal patterns of activity. It functions much like a statistical IDS. These systems can be fooled because the attack makes very small incremental changes.
Symmetric encryption uses a single shared secret key for encryption and decryption. Symmetric algorithms include the following:
![]() Data Encryption Standard (DES)—The most common symmetric algorithm used.
Data Encryption Standard (DES)—The most common symmetric algorithm used.
![]() Blowfish—A general-purpose symmetric algorithm intended as a replacement for the DES; it has been replaced by AES and Twofish.
Blowfish—A general-purpose symmetric algorithm intended as a replacement for the DES; it has been replaced by AES and Twofish.
![]() Rijndael—A block cipher that the U.S. government adopted as the Advanced Encryption Standard (AES) to replace DES.
Rijndael—A block cipher that the U.S. government adopted as the Advanced Encryption Standard (AES) to replace DES.
![]() RC4—Rivest Cipher 4, a stream-based cipher
RC4—Rivest Cipher 4, a stream-based cipher
![]() RC5—Rivest Cipher 5, a block-based cipher
RC5—Rivest Cipher 5, a block-based cipher
![]() SAFER—Secure and Fast Encryption Routine, a block-based cipher
SAFER—Secure and Fast Encryption Routine, a block-based cipher
Per ISACA requirements, CISA candidates should have a basic understanding of public key infrastructure (PKI). PKI is a framework that consists of hardware, software, and policies that manage, create, store, and distribute keys and digital certificates. The components of the PKI framework include the following:
![]() Certificate authority (CA)—The CA is a person or group that issues certificates to authorized users. The CA creates and signs the certificate, to guarantee the authenticity of the certificate.
Certificate authority (CA)—The CA is a person or group that issues certificates to authorized users. The CA creates and signs the certificate, to guarantee the authenticity of the certificate.
![]() The Certificate Revocation List (CRL)—The CA maintains the CRL list. The list is signed to verify its accuracy and used to report problems with certificates. When requesting a digital certificate, anyone can check the CRL to verify the certificate’s integrity.
The Certificate Revocation List (CRL)—The CA maintains the CRL list. The list is signed to verify its accuracy and used to report problems with certificates. When requesting a digital certificate, anyone can check the CRL to verify the certificate’s integrity.
![]() The Registration authority (RA)—The RA reduces the load on the CA. The RA cannot generate a certificate, but it can accept requests, verify an owner’s identity, and pass along the information to the CA for certificate generation.
The Registration authority (RA)—The RA reduces the load on the CA. The RA cannot generate a certificate, but it can accept requests, verify an owner’s identity, and pass along the information to the CA for certificate generation.
![]() Certificate server—The certificate server maintains the database of stored certificates.
Certificate server—The certificate server maintains the database of stored certificates.
![]() X.509 standard—This is the accepted standard for digital certificates.
X.509 standard—This is the accepted standard for digital certificates.
Physical security controls have three primary goals:
![]() Deter—Security lighting and armed guards are two examples of methods used to deter intruders.
Deter—Security lighting and armed guards are two examples of methods used to deter intruders.
![]() Delay—Fences, gates, locks, access controls, and mantraps are some of the techniques that can be used to delay intruders.
Delay—Fences, gates, locks, access controls, and mantraps are some of the techniques that can be used to delay intruders.
![]() Detect—Closed-circuit TV (CCTV) and alarms are two examples of systems used to detect intruders.
Detect—Closed-circuit TV (CCTV) and alarms are two examples of systems used to detect intruders.
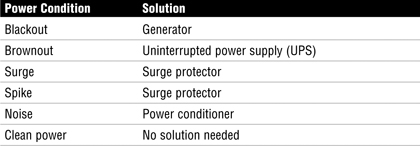
Power systems can suffer from a range of problems. Table 20 shows the most common ones and their solutions.
Table 20 Network Equipment
Halon was originally used in computer rooms for fire suppression. Halon mixes easily with air, doesn’t harm computer equipment, and, when dissipated, leaves no solid or liquid residue. The downside is that Halon is 3 to 10 times more damaging to the ozone layer than CFCs. The Montreal Protocol of 1987 designated Halon as an ozone-depleting substance. The most common replacement is FM-200.
60Business Continuity and Disaster Recovery
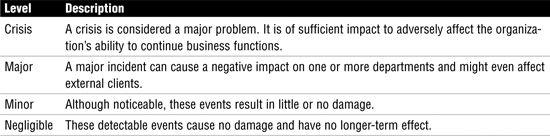
Per ISACA, incidents can be classified as shown in Table 21.
Table 21 Incident Classification
The business continuity plan (BCP) process as defined by ISACA focuses on the following seven steps.
1. Project management and initiation
2. Business impact analysis
3. Recovery strategy
4. Plan design and development
5. Training and awareness
6. Implementation and testing
7. Monitoring and maintenance
Questions auditors must ask when determining what processes are critical can include the following:
![]() Does the process support health and safety?—Items such as the loss of an air traffic control system at a major airport or the loss of power in a hospital operating room could be devastating to those involved and result in the loss of life.
Does the process support health and safety?—Items such as the loss of an air traffic control system at a major airport or the loss of power in a hospital operating room could be devastating to those involved and result in the loss of life.
![]() Does the loss of the process have a negative impact on income?—As an example, a company such as eBay would find the loss of Internet connectivity devastating, whereas a small nonprofit organization might be able to live without connectivity for days.
Does the loss of the process have a negative impact on income?—As an example, a company such as eBay would find the loss of Internet connectivity devastating, whereas a small nonprofit organization might be able to live without connectivity for days.
![]() Does the loss of the process violate legal or statutory requirements?—As an example, a coal-powered electrical power plant might use scrubbers to clean the air before emissions are released. Loss of these scrubbers might violate federal law and result in huge regulatory fines.
Does the loss of the process violate legal or statutory requirements?—As an example, a coal-powered electrical power plant might use scrubbers to clean the air before emissions are released. Loss of these scrubbers might violate federal law and result in huge regulatory fines.
![]() Does the loss of the process affect a large number of users?—Returning to our example electrical power plant, it is easy to see how problems with the steam-generation process would shut down power generation and leave many residential and business customers without power.
Does the loss of the process affect a large number of users?—Returning to our example electrical power plant, it is easy to see how problems with the steam-generation process would shut down power generation and leave many residential and business customers without power.
The general steps of the business impact analysis (BIA) include the following:
1. Determine data-gathering techniques
2. Gather business impact analysis data
3. Identify critical business functions and resources
4. Verify completeness of data
5. Establish recovery time for operations
6. Define recovery alternatives and costs
At the core of the BIA are two critical items:
![]() The recovery point objective (RPO) defines how current the data must be or how much data an organization can afford to lose. The greater the RPO, the more tolerant the process is to interruption.
The recovery point objective (RPO) defines how current the data must be or how much data an organization can afford to lose. The greater the RPO, the more tolerant the process is to interruption.
![]() The recovery time objective (RTO) specifies the maximum elapsed time to recover an application at an alternate site. The greater the RTO, the longer the process can take to be restored.
The recovery time objective (RTO) specifies the maximum elapsed time to recover an application at an alternate site. The greater the RTO, the longer the process can take to be restored.
For both RPO and RTO, the lower the time requirements are, the higher the cost will be to reduce loss or restore the system as quickly as possible.
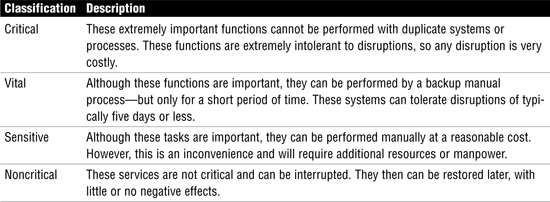
Per ISACA, the scale shown in Table 22 classifies systems according to their importance to the organization.
Table 22 Priority Ranking
ISACA defines three types of BCP tests:
![]() The most basic disaster-recovery test is the paper test. Although it is not considered a replacement for a real test, it is a good start. A paper test is an exercise that can be performed by sending copies of the plan to different department managers and business unit managers for review to make sure nothing is overlooked or to remove something that was added.
The most basic disaster-recovery test is the paper test. Although it is not considered a replacement for a real test, it is a good start. A paper test is an exercise that can be performed by sending copies of the plan to different department managers and business unit managers for review to make sure nothing is overlooked or to remove something that was added.
![]() A preparedness test is a simulation in which team members go through an exercise that reenacts an actual outage or disaster. This type of test is typically used to test a portion of the plan. The preparedness test consumes time and money because it is an actual test that measures the team’s response to situations that might someday occur. This type of testing provides a means of incrementally improving the plan.
A preparedness test is a simulation in which team members go through an exercise that reenacts an actual outage or disaster. This type of test is typically used to test a portion of the plan. The preparedness test consumes time and money because it is an actual test that measures the team’s response to situations that might someday occur. This type of testing provides a means of incrementally improving the plan.
![]() The full operational test is as close to the actual service disruption as you can get. The team should have preformed paper tests and preparedness tests before attempting this level of interruption. This test is the most detailed, time-consuming, and thorough of all discussed. A full interruption test mimics a real disaster, and all steps are performed to startup backup operations. It involves all individuals who would be involved in a real emergency, including internal and external organizations.
The full operational test is as close to the actual service disruption as you can get. The team should have preformed paper tests and preparedness tests before attempting this level of interruption. This test is the most detailed, time-consuming, and thorough of all discussed. A full interruption test mimics a real disaster, and all steps are performed to startup backup operations. It involves all individuals who would be involved in a real emergency, including internal and external organizations.