Chapter 9
Policies, Processes, and Procedures
After completing this chapter, you will be able to:
- – understand the documentation system of an organization;
- – understand the role of a policy in an organization;
- – understand the importance of software process documentation;
- – understand how to document processes and procedures;
- – understand a few popular notations such as ETVX, IDEF, and BPMN;
- – understand the requirements of the ISO 12207 standard and the CMMI® model concerning the documentation of processes and procedures;
- – understand the process notation of the ISO/IEC 29110 management and engineering guides;
- – understand the personal improvement process;
- – understand the relationship between policies, processes, procedures, and the software quality assurance plan.
9.1 Introduction
An article of the online encyclopedia Wikipedia, summarizes critics’ comments about software development as follows: “In traditional engineering, there is a clear consensus about how things should be built, how they should respect engineering standards and what risks must be taken into account. If an engineer does not comply with his code of practices and something breaks down, he can be sued. There is no such consensus yet, in software engineering, where everyone is promoting his own methods and tools, claiming their advantages in productivity, which, in general are not supported by any objective and scientific evidence whatsoever.”
In this chapter, we present approaches that address some of the issues with this criticism. We will use, as in previous chapters, known standards such as the ISO standards and the CMMI® model, and present how to use and adapt these standards to address the problems and needs of the organization. The SWEBOK Guide (see Figure 9.1) includes a knowledge area that describes the importance of processes in software engineering and the existing knowledge that should be used.

Figure 9.1 The SWEBOK® Guide software engineering process knowledge area [SWE 14].
We will not discuss process assessment or measurement here as these topics are discussed in detail in other chapters of this book.
We know that a quality management system includes a number of documents. Figure 9.2 shows an example of a pyramid model to classify the many types of documents found in an organization. Quality objectives and organizational policies are normally at the top of the pyramid. At the second level, we find processes used at all levels of the organization. At the third level, we find more detailed procedures, checklists and templates/examples to help ensure efficient daily operations. Finally, at the base of this documentation pyramid, we find the quality records that are the accumulated evidence, or proof, resulting from the execution of both processes and procedures in accordance with the organization's policies and quality objectives.

Figure 9.2 Example of a quality system documentation model.
In this book, we propose an organizational process approach which entails the daily use of a quality management system consisting of organizational processes that are identified, formalized, interact with each other, and are managed and improved. In this chapter, we describe how to develop, document, and improve policies, processes, and procedures to ensure the effectiveness and efficiency of the organization. Remember that software quality assurance (SQA) plays a key role in defining, and particularly in improving, the organizational processes in many organizations, since SQA has the mission of auditing these processes.
Two key reference documents will be used in this chapter: the ISO 9000 standard and the CMMI-DEV model. The ISO 9001 standard [ISO 15] is useful with respect to how a quality management system is implemented. As illustrated in the following text box, having previously identified its business objectives, the organization must, among other things, develop its quality objectives, policy, and organizational processes.
ISO 12207 [ISO 17] also asks the software organization to develop its policies and processes. The business perspective is comprised in its portfolio management process. Note that this standard also requires that the software development life cycle models used, such as waterfall, iterative, or agile be formalized. We briefly discussed this in previous chapters. We will address this in more detail in the chapter entitled “Risk management” where the criteria for selecting the appropriate life cycle for a project is associated with its criticality and perceived risks.
The CMMI-DEV model [SEI 10a] contains several process areas that include topics about software development and process improvement. In this chapter, the following processes are presented:
- – organizational process definition;
- – organizational process focus;
- – organizational performance management;
- – organizational process performance
- – causal analysis and resolution;
- – organizational training.
Only the first two process areas will be described in this chapter. The reader should refer to the staged representation of the CMMI-DEV for descriptions of the other process areas:
Organizational process definition [SEI 10a]:
- – The purpose of the organizational process definition is to establish and maintain a usable set of organizational process assets, work environment standards, and rules and guidelines for teams.
- – This process area has one specific goal (SG) “Establish Organizational Process Assets” and the following seven specific practices (SP):
- SP 1.1 Establish Standard Processes
- SP 1.2 Establish Life Cycle Model Descriptions
- SP 1.3 Establish Tailoring Criteria and Guidelines
- SP 1.4 Establish the Organization's Measurement Repository
- SP 1.5 Establish the Organization's Process Asset Library
- SP 1.6 Establish Work Environment Standards
- SP 1.7 Establish Rules and Guidelines for Teams
Organizational process focus [SEI 10a]:
- – The purpose of organizational process focus is to plan, implement, and deploy organizational process improvements based on a thorough understanding of current strengths and weaknesses of the organization's processes and process assets.
- – This process area has the following three SG and nine SP:
- SG 1 Determine Process Improvement Opportunities
- SP 1.1 Establish Organizational Process Needs
- SP 1.2 Appraise the Organization's Processes
- SP 1.3 Identify the Organization's Process Improvements
- SG 2 Plan and Implement Process Actions
- SP 2.1 Establish Process Action Plans
- SP 2.2 Implement Process Action Plans
- SG 3 Deploy Organizational Process Assets and Incorporate Experiences
- SP 3.1 Deploy Organizational Process Assets
- SP 3.2 Deploy Standard Processes
- SP 3.3 Monitor the Implementation
- SP 3.4 Incorporate Experiences into Organizational Process Assets
The CMMI model pays particular attention to the artifacts and the means that are deployed to support the process. The following text box describes some of them.
The CMMI model proposes that the process assets are regrouped into an organizational process repository. This repository can be digital, such as an organizational intranet or wiki. In this way, all employees can have access to the latest versions of the process information. In addition to the items listed in the last text box, this intranet may contain examples of already developed/validated documents originating from completed projects. Given that an organization operates in a particular industry and business domain, software projects could share/reuse some artifacts that are similar across projects, such as plans, configuration management, and quality assurance processes. The project manager who is starting a new project would be advised to consult the organizational process repository to identify reusable and customizable artifacts before creating his own. This could not only save effort by reusing items, but also allows him to benefit from the experience of others.
9.1.1 Standards, the Cost of Quality, and Business Models
The cost of quality and business models concepts were presented earlier. The cost of quality, policies, processes, and procedures are classified as preventive cost elements, which are costs incurred by an organization to prevent the occurrence of errors in various development or maintenance processes. Detection costs are the verification and appraisal costs of software products or services during the various life cycle phases of a software development project. Detection costs also represent the additional cost of controlling these internal standards (e.g., the cost of their maintenance and management). Appraisal costs represent the associated audit cost invested to determine compliance as well as the costs associated with the certification/attestation/ compliance to a standard such as ISO 9001 or a process model like the CMMI for development.
Table 9.1 presents the different preventive, detection or appraisal costs. Development costs, training, and implementation of policies, processes, and procedures are considered preventive costs.
Table 9.1 Preventive and Detection (or Appraisal) Costs Related to Policies, Processes, and Procedures
| Major category | Sub-category | Definition | Typical cost element |
| Preventive costs | Establish the foundation of the quality management system. | Efforts to define quality, quality objectives and thresholds, and quality standards. Quality compromise analysis. | Definition of acceptance test success criteria and of quality standards. |
| Interventions oriented toward projects and processes. | Efforts to prevent defects or to improve the quality of the processes. | Training, process improvement, measurement and analysis. | |
| Detection or appraisal costs | Discover the state of the product. | Discover the non-conformity level. | Tests, software quality assurance. Inspections, reviews. |
| Ensure that quality objectives are met. | Quality control mechanism. | Product quality audits, new versions delivery decision criteria. |
Source: Adapted from Krasner (1998) [KRA 98].
Policies, processes, and procedures are commonly used in the following business models: custom systems written on contract and commercial and mass-market firmware. In these business models, policies, processes and procedures are used to control development and minimize errors and risks. With respect to the custom systems written on contract business model, it is the customer who decides whether or not to impose his processes and procedures on the supplier.
In the following sections, we describe the policies, processes, and procedures of the quality system documentation pyramid for the software organization.
9.2 Policies
Essentially, organizational policies aim at showing, publicly and officially, how the software organization intends to meet its business objectives. They are typically developed and approved by upper management and, once deployed, help in guiding projects and product development decisions as well as the behavior of personnel. The term “organizational directive” is also used as a synonym to the term “organizational policy.”
In order for policies to be effective, management should:
- – ensure that the commitment is clearly communicated to all levels of the organization;
- – initiate, manage, and monitor the implementation of policies;
- – require that a strong business case be presented before accepting any deviations to the policy;
- – show their support for the policies by providing adequate resources (e.g., budget, competent personnel and appropriate tools) for their implementation, monitoring, evaluation, and improvement;
- – provide adequate training to support the understanding of the daily execution of the policies.
In the CMMI, one of the generic practices, the GP 2.1, requires that the organization establish and maintain an organizational policy for planning and performing a process. The organization may write a policy that covers all the software process areas or one different directive for each CMMI process area. The following text box describes what is intended and asked for in the CMMI model.
For example, for the “project planning” process area, the CMMI asks that the organization establish an organizational policy for their “project planning” activities, such as: “This Directive establishes organizational expectations concerning the estimates for internal and external commitments and for developing the project management plans” [SEI 10a].
The following text box provides an actual policy example and describes the policy objectives, scope, target processes, and the responsibilities of key stakeholders of an organization of about 35 software engineers. This company uses the concept of process owner.
9.3 Processes
At the second level of the pyramid illustrated in Figure 9.2, we find processes. The processes are the implementation of policies that guide the development of products and services. A process describes what must be done to produce the expected results. We will describe procedures in the next section. Procedures are very detailed and describe how to do a job, step by step.
A defined (i.e., formalized) and documented process provides the organization with [SEI 10a]:
- – a defined framework for planning, monitoring, and managing the work;
- – a guideline to do the job correctly and completely describing a series of sequential steps to do the work;
- – a basis for measuring the work and monitoring progress against targets, and allows for refining the process in future iterations;
- – a basis for refining the process;
- – a planning and quality management tool for the products being developed;
- – procedures to be used to coordinate work in order to produce a common product;
- – a mechanism that allows team members to support each other throughout the project.
When documenting a process, we must think of those who will use it. This statement may seem obvious, but often processes are documented for the wrong audience. What are audiences? They are, for example, developers who have a wealth of knowledge and experience. Another audience can be expert developers that require very little documented processes (see Figure 9.3). Experts are like experienced pilots. Once behind the controls, they commonly only use checklists. They do not have to dig through detailed manuals to find out what to do next.

Figure 9.3 Processes documented for an expert.
Source: Adapted from Olson (2006) [OLS 06].
Other audiences can be junior programmers and new employees of the organization. They require more detailed processes. Documentation may include a tutorial or contain explanatory material. Between these types of audiences are intermediate users that still cannot be referred to as expert process users but do not need as much information as beginners. For this last audience, we could add to Figure 9.3 the more detailed description shown in Table 9.2.
Table 9.2 Description of Process Guidance for Intermediate Software Process Users [OLS 06]
| Process step ID | Role | Process step description |
| 7.1.1 | Project manager | Assign the responsibility for configuration management planning At the appropriate time, typically during the project planning phase, the project manager assigns the configuration management (CM) plan development work. Advice An individual, responsible for CM should have experience in the installation and execution of CM systems. His supervisor should also have been trained in CM. |
| 7.1.2 | Configuration Management manager | Develop the CM plan The configuration management manager develops the CM plan using organizational standards and CM guidelines. The organizational process references and standards must be used. Advice CM Plan and templates, examples and guidelines can be found on the organizational process repository that is accessible on the Intranet of the software division. |
A well-thought out, ready and usable process includes the following elements: a definition of the process, inputs required for its execution, the impacted agents, resources needed (e.g., people, equipment, time, and budget) and its exit criteria. A process defines precisely what to do by listing the tasks, in sufficient detail, to guide its user during its execution. Processes should provide sufficient details for team members and individuals in order for them to develop detailed project plans and then be able to execute the planned process to guide and monitor their work [SEI 09]. The following sections describe process notations used to graphically represent processes.
9.4 Procedures
Procedures support process execution. They define and clarify each step of the process. These procedures can take many forms: they may be descriptions of actions to take, templates of documents and forms that include instructions on how to use them, or even checklists that can be referred to or completed.
When a procedure has been developed, the checklist, as described in the next text box, can be used to verify that it contains all the required elements of a good procedure.
9.5 Organizational Standards
ISO 9001 defines the work environment as a set of conditions under which daily work is performed. Organizational standards and processes define expectations and acceptable performance by providing clear definitions that guide daily activities, the collection and use of data, and coding standards for example. These standards are described so that they can be applied uniformly in all development projects, maintenance and operational activities. These standards also enable a developer or programmer to work the same way from one project to another. In this way, they do not have to learn a new programming guide for a particular project, increasing the productivity of the development team who has to develop the source code, review and test it. Table 9.3 shows some elements of a C++ program guide used at NASA.
Table 9.3 Example of Coding Standard Elements [NAS 04]
| Naming convention | Comments |
| Heading conventions | Language instruction recommended use (functions, variables, constant, pointers, operators, etc.) |
| Readme guidelines | Empty lines, spacing and identification conventions |
| Comments conventions (e.g., comments should be next to the instructions to be commented.) | Table and figure conventions |
| Exception handling conventions | Decision branching conventions |
| Use of uppercase and lowercase convention |
These types of conventions facilitate the understanding of documents and can reduce maintenance time. A new employee will be more quickly productive once he has learned the local conventions, rather than disturb everyone to ask them how work should be done. It is also possible to use tools to automatically check compliance with organizational conventions. In this case, code peer reviews will also be easier as the guidelines are published and should be used by all programmers. Reviewers can focus on detecting more significant problems and defects and will not spend a significant amount of time on coding conventions.
The organizational standards also define, among other things, software approved for project use, developers that are approved to have a copy of certain software, and describe how that software can be obtained. Similarly, the standards can define the hardware characteristics that development projects can use, such as number of platforms, type of computers, and approved peripherals that are fully supported by the acquisition department, operation, and maintenance of the organization.
9.6 Graphical Representation of Processes and Procedures
The best and most effective documentation is a concise graphical representation of a document, a process, or a procedure. It may include, in addition to tasks to be executed, its inputs and outputs, input and output criteria, measures, roles, audit activities, tools, checklists, templates, and examples. There are many techniques available to help document processes and procedures. In this section, we present some of the graphical notations that are commonly used. A few of these are very simple to use and do not require any tool, while others are supported by specialized software. Before diving into the documentation representation on your intranet, the important question is: why should we graphically represent and document processes and procedures?
Here are some of the reasons to document processes and procedures graphically (adapted from [OLS 94], [SEI 10a]):
- – allows for easier process improvement—it is difficult to improve a process when it is in the mind of developers;
- – improves productivity—documented processes, which include the use of best practices, should help to improve overall organizational productivity;
- – facilitates individual knowledge capture—if experienced people leave an organization, a part of their knowledge will have been documented and will remain;
- – reduces defects—documented processes help reduce and prevent errors;
- – saves time and money—users of documented processes can reduce development time and reduce rework;
- – allows for measurement—when a process is documented, it is possible to measure its characteristics, such as the effort made to implement it and the size and number of defects it generates;
- – facilitates training—documents describing the processes and procedures can be used to train new employees; and
- – facilitates audits—preparing an audit will be faster when the organization can prepare the documentation requested by the auditor to demonstrate compliance to a standard for a project.
Here are some basic principles to guide the development of the process and procedure documentation (adapted from [OLS 94], [SEI 10a]):
- – We must keep the organization's business objectives and the elements that make these objectives difficult to attain in mind—in some cases, a process documentation project becomes the ultimate goal. The processes must be used to achieve the business objectives;
- – The repository of assets should contain the description of the development life cycle of the organization;
- – We must use only the relevant information for each type of document (e.g., the information concerning training should only be in the training materials and policies should only contain information that does not change frequently). By locating the relevant information only where it belongs in the documentation reference model, developers will always know where to look for the information;
- – It is necessary to manage changes and improvements—once defined, policies should not change frequently. A process will probably not need to change if only one step in one of its procedures should be amended;
- – Use organizational standards and conventions to document processes and procedures (process descriptions and procedures should be consistent to allow for their efficient use, and processes must answer the following questions: why, what, who, when, where, or be described according to the convention used, such as the Entry-Task-Verification-eXit (ETVX) graphical notation);
- – Use drawings or mathematical formulas and complete the description of processes and procedures using text;
- – When possible, use the templates as vehicles to communicate the information which is reflected in a procedure—we then avoid creating procedures that will have to be maintained;
- – Add a checklist to the document template that will be used by the author to ensure that the document meets the organization's standards and can also be used for quality assurance during internal audits;
- – Use a label to identify each document—developers want to find information quickly;
- – Separate the process into cohesive chunks—it will be easier to understand a process that is broken down into logical parts, or sub-processes, instead of a complex process on several pages.
Processes should also be documented according to the level of expertise of its users. For example, you can use three levels of expertise: expert, intermediate, and beginner (adapted from [OLS 94], [SEI 10a]):
- – for expert—the documentation includes just enough information for use by people who have implemented the process many times and just need a reminder, as these people use the process often;
- – for intermediate—the intermediate level uses the expert level documentation, but the objective of the activity is added as well as some tips or applicable lessons learned;
- – for beginner—the beginner level is aimed at people that are new to the process, that is, they have not yet used the process, and are in need of more detailed guidelines and training. The beginner level uses the documentation of the intermediate level to which is added training material. Beginners should feel free to use the training materials until they are familiar with the process.
9.6.1 Some Pitfalls to Avoid
Even if documentation provides advantages, we must pay attention to some documentation difficulties. Here are some pitfalls to avoid:
- – large and complex documentation—when documentation becomes too big and complex, it becomes difficult to find the relevant information; additionally, the expert user does not want to rummage through a mass of documents to find simple information. Documentation that is too voluminous can quickly become shelf-ware.
- – paper documentation—today's developers require documents that are available electronically to facilitate information retrieval;
- – textual only documentation—we often say that a picture is worth a thousand words. This quote reflects well the situation with process and procedure documentation. In addition, a large number of users prefer graphical representations to textual ones. However, they will prefer a textual description when graphics cannot convey the same detailed information;
- – process documentation developed by an external consultant to the organization—sometimes developers reject the process description made by someone who does not understand their organization. In some cases, a consultant cannot reflect the culture, the terminology, and the existing processes of the organization;
- – documentation that mixes different types of documentation (e.g., policy and processes);
- – complex notation—do not use a modeling notation that is too complex as users risk spending a lot of time trying to understand the notation that describes the process.
9.6.2 Process Mapping
Process mapping has been done for many years. Flow charts were the initial graphical representations and notation used for process documentation. These charts represented the following object types: decisions, input devices, output devices, and data storage media. Descriptive information as well as decisions where represented directly into the lozenges and the connection between objects was made using arrows. The ability to simply and explicitly describe the flow and the decisions made this notation very popular. Examples of graphical objects used by this notation are illustrated in Figure 9.4.

Figure 9.4 Control flow graphical notation objects.
Although we still find diagrams using flow charts, is it less popular today. The next section introduces the ETVX notation.
9.6.3 ETVX Process Notation
The ETVX notation was used in the 1980s by IBM [RAD 85]. Given its simplicity, it has been adopted by many organizations such as NASA and the SEI. Figure 9.5 describes the concept by illustrating how the ETVX notation works.

Figure 9.5 ETVX notation concept [RAD 85].
This notation includes the following components:
- – Inputs
- Assets (e.g., document) received from outside the process are required for its execution. It is often the case that not all inputs are mandatory when executing the process the first time. When other inputs become available, additional iterations may be performed.
- –Tasks
- Actions to be carried out to achieve the goal of the process and create the required outputs.
- – Validation/Verification
- A mechanism to ensure that the process tasks were carried out as required and that the deliverables meet the quality required.
- – Outputs
- Assets produced following the execution of the process and that will be used outside of this process.
Some organizations have added elements, such as those that follow, to the initial ETVX notation to better document processes (see Figure 9.6):
- – Title (Process title)
- – Entry criteria
- Measurable conditions that must be satisfied before the process tasks can be executed.
- – Exit criteria, also called a completion criteria
- Measurable conditions that must be satisfied before you can exit this process.
- – Measures taken during the execution of this process
- The measurements are used to monitor the progress of activities, and can be used by other projects to better estimate the effort required to execute this process. Measures such as effort, for example, can be captured starting at the time the entry criterion is satisfied and stopped when the exit criterion is met. Measurement units should be specified (e.g., person-hour for effort).
- – Tools
- A list of tools/software required to execute the process.
- – Risks
- A section that lists the risks encountered when this process was used in the past.
- – References
- A section that lists reference documents that can be used to explain and support the process, its inputs, and its execution.

Figure 9.6 Illustration of the modified ETVX notation [LAP 97].
It is also possible to specify additional exit criteria as follows:
- – Each artifact generated by the process is consistent with the organizational policies, standards and procedures;
- – Each artifact produced by the process was verified, approved and stored in the organizational process repository.
It is also possible to use textual notation to describe the ETVX notation. Figure 9.7 provides this template. This format, as well as the one presented in the above figure, could be used by more mature developers.

Figure 9.7 Template of a textual process description using the ETVX notation.
Professor Laporte has used the ETVX notation for software process documentation and project management (PM) at Rheinmetal Corporation and Bombardier Transport [LAP 97]. He added title and activities to the notation. A rule was added to ensure that both of these additions include an action verb and a noun (e.g., “estimate the size of the product”). In addition, each activity needed to be assigned a unique number to facilitate its reference in sequence. NASA also uses the ETVX notation to document its processes and procedures. Figure 9.8 shows a NASA process that is described using the ETVX notation.

Figure 9.8 Example of a NASA process graphically represented using the ETVX notation [NAS 04].
NASA has also documented how to complete the ETVX table shown in Figure 9.8. Figure 9.9 presents the result.


Figure 9.9 A NASA template used to explain the ETVX notation [NAS 04].
Figure 9.10 shows an ETVX representation of a configuration management process. It is not mandatory to include both entry and exit criteria.

Figure 9.10 A configuration management process graphically represented using the ETVX notation ETVX [LAP 97].
9.6.4 IDEF Notation
During the 1970s, an integrated computer aided manufacturing program (ICAM) for the US aviation industry sought to increase productivity by the increased use of information technology. The ICAM program developed a series of graphical modeling notations known as ICAM Definitions (IDEF). The IDEF0 notation is derived from an existing graphical modeling notation known as the structured analysis and design technique (SADT). IDEF0 was developed by the original authors of SADT [IEE 98].
Figure 9.12 describes the IDEF0 notation. Arrows entering the left side of the box are inputs. Inputs are transformed by the function performed in the rectangle (which represents an activity to be performed) to produce outputs. The arrows entering the top of the box are controls. Controls specify the conditions required for the function to produce correct results. The arrows, located in the lower part of the rectangle and pointing up, are mechanisms that identify means that support the delivery of the function (e.g., tools). The arrows pointing down enable information sharing between models or between parts of the same model. Rectangles can be interconnected to form a process.

Figure 9.12 Notation IDEF0 [IEE 98].
In the following example, we illustrate the description of a process at three levels: at the process level, at the step level and at the ETVX level.
9.6.5 BPMN Notation
The Business Process Modeling Notation (BPMN) is a standard of the Object Management Group (OMG) [OMG 11]. This notation was originally developed by the Business Process Management Initiative, and in 2009, the second version of BPMN was published. BPMN defines a set of graphical objects used in the description of the process. This notation is based on four families of items:
- – flow objects
- – connection objects
- – activity corridors
- – artifacts
Each family contains objects in object categories. The following sections introduce you to the concepts of objects used in the BPMN notation.
9.6.5.1 Event Objects
Generally, a BPMN graph contains the following three types of objects: (a) events; (b) activities; and (c) connectors.
9.6.5.1.1 Events
An event graphically represents all events that can take place, and that are likely to trigger one or more activities. The BPMN notation authors have designed this object in order to provide an accurate description of the process. Experts will notice that each new version of BPMN enriches the event library of the notation. Generally, there are three types of popular events as illustrated in Table 9.4.
Table 9.4 BPMN Event Types
| Event type | Symbol | Description |
| Start |  |
Event that starts a process |
| Intermediate |  |
Event that occurs during a process |
| End |  |
Event that ends a process |
There are many more events available. Figure 9.17 illustrates the types of events used by this classification.

Figure 9.17 BPMN list of event types [DEC 08].
9.6.5.1.2 Activities
As its name implies, an activity means work concerning an organization's business transactions. BPMN distinguishes between two types of activities:
- – Task: an indivisible action.
- – Sub-process: an action that includes or regroups a number of tasks.
Table 9.5 shows the symbols used to illustrate these two types of activities.
Table 9.5 BPMN Activity Types
| Activity Type | Symbol |
| Task | |
| Sub-process |  |
9.6.5.1.3 Connectors
The last of the three objects is the connector. Also known as the gateway, this type of object illustrates the convergence of decision points as well as the divergence of a process activity. Connectors are represented by an empty diamond in the case of a conventional decision. Otherwise, an additional notation is used to indicate more complex cases, such as the disconnected node/union node as well as the fusion node. The next section describes the connection objects.
9.6.5.2 Connection Objects
These objects serve as connectors between objects presented in the previous section. Table 9.6 shows the difference between the three types of connection objects used by the BPMN notation.
Table 9.6 BPMN Connexion Objects
| Connexion objects | Symbol |
| Sequence flow | |
| Association | |
| Message flow |
The concepts for structuring business process activities are discussed next.
9.6.5.3 Swim Lanes
BPMN notation uses the concept of the swim lanes of activities to organize and structure the processes. Table 9.7 provides an explanation of the two types of swim lanes proposed by the notation.
Table 9.7 The Types of BPMN Swim Lanes
| Type of lane | Description | Graphical representation |
| Swim lane | A lane is used to represent the activities of a specific role |  |
| Pool | A pool is usually used to represent a process in an organization. A lane, on the other hand, represents an activity of a department within that organization. By using pool and lane, you can identify how a process is done and which department performs that activity. |  |
The following section introduces the way in which the BPMN notation allows for additional information to be included in the process model.
9.6.5.4 BPMN Artifact
Artifacts are additional objects that provide more detail to ensure a more complete understanding of a process. Table 9.8 shows the three types of BPMN artifacts, their descriptions and associated symbols.
Table 9.8 BPMN Artifacts
| Artifact | Description | Symbol |
| Annotation | Object used for comments |  |
| Group | Object used to regroup tasks |  |
| Data object | Object used to represent data needed (and produced) during the execution of a task |  |
9.6.5.5 BPMN Modeling Levels
The modeling of typical business processes is achieved using several logical levels, depending on the methodology used and the target clientele. BPMN allows for the production of high-level conceptual diagrams as well as very detailed levels.
Using BPMN notation can be done in three levels [SIL 09]:
- Descriptive level: The goal of this first modeling level is to describe the business process at a general and conceptual level. It is meant to represent the overall flow of the process (sometimes called a meta process).
- Analytical level: Analysis of the descriptive level diagrams does not allow for the evaluation of its quality or performance. This requires the production of more detailed diagrams that describe all the possible branching and interaction scenarios of a process. This is, indeed, the reason for the analytical level. This second level of modeling, mainly used by architects and business analysts, aims to describe the details of a process in an accurate manner.
- Executable level: This level is dedicated specifically to software and system developers. It is used to produce executable process models (i.e., that reflect the business processes). When a process is represented at this level, it can be executed by many popular BPM commercial solutions/tools.
These three levels of modeling are aligned with the concept of model-driven architecture (MDA). MDA software implementation (SI) of a process can be used at the beginning of a project to produce a model independent of the implementation (CIM), which can be transformed into a platform-independent model (PIM model), that in turn can be transformed into a platform specific model (PSM model). Note that this classification is not part of the specification of the BPMN notation. Figure 9.18 shows an example of BPMN representation.

Figure 9.18 Example of a provisioning process represented using BPMN notation.
In conclusion, we have seen that BPMN is a notation that can be used for representing business processes. This description can be done at different levels of detail, based on a rich library of graphical objects.
Davies [DAV 06] conducted a study to determine the current most popular graphical representation models in industry. He surveyed the market to see what tools and notations are actually used by practitioners. He questioned 312 members of the Australian Computer Society (ACS). The survey listed 24 different modeling tools that were pre-selected by studying their popularity in the literature. Respondents were practitioners in the field of IT with only 15% declaring themselves as end-users or management. Davies research reveals that 61% of respondents use a version of Microsoft Visio as a modeling tool with no specific notation in mind.
9.7 Process Notation of ISO/IEC 29110
As mentioned in Chapter 4, ISO/IEC 29110 describes processes, objectives, activities and tasks for Very Small Entities (VSEs) developing software or systems. A VSE is an entity (enterprise, organization, department or project) having up to 25 people. ISO/IEC 29110 is not intended to preclude the use of different life cycles such as: waterfall, iterative, incremental, evolutionary, or agile. The notation used in the diagrams of ISO/IEC 29110 does not imply the use of any specific process life cycle.
The following elements are used to describe the processes, activities, tasks, roles, and products of ISO/IEC 29110 (adapted from [ISO 11e]):
- – Name of a process
- A process identifier, followed by its abbreviation in brackets “()”. For example, for the PM process, the notation is: PM process.
- – Purpose of a process
- General goals and results expected of the effective implementation of the process. The implementation of the process should provide tangible benefits to the stakeholders.
- The purpose is identified by the abbreviation of the process name. For example, for the PM process:
- PM purpose: The purpose of the PM process is to establish and carry out in a systematic way the tasks of the SI project, which complies with the project's objectives in regards to quality, time, and costs.
- – Objectives
- SG to ensure the accomplishment of the purpose of the process. The objectives are identified by the abbreviation of the name of the process, followed by the letter “O” and a consecutive number. For example, PM.O1.
- Each objective is followed by the square box which includes a list of the chosen processes for the Basic profile from ISO/IEC/IEEE 12207 and its outcomes related to the objective. For example, for Project Objective 7 (PM.O7), the management and engineering guide describes the objective and a note is added followed by a square box:
- PM.O7: SQA is performed to provide assurance that work products and processes comply with the Project Plan and Requirements Specification.
- Note: The implementation of the SQA process is through the performance of the verifications, validations, and review tasks completed in the PM and SI processes.
Figure 9.19 illustrates the graphical representation of the PM process of ISO/IEC 29110 as follows [ISO 11e]:
- – the large round-edged rectangles indicate process or activities.
- – the smaller square-edged rectangles indicate the products.
- – the directional or bidirectional thick arrows indicate the major flow of information between processes or activities.
- – the thin directional or bidirectional arrows indicate the input or output products.

Figure 9.19 PM process diagram of ISO/IEC 29110 [ISO 11e].
Source: Standards Council of Canada.
Input work products
- – Input work products are products required to perform the process and its corresponding source, which can be another process or an external entity to the project, such as the customer.
- – Input work products are identified by the abbreviation of the process name and showed as a two column table of product names and sources. As an example, for the PM process, we have the following table:
Name Source Statement of work Customer Software configuration Software Implementation Change request Customer Software Implementation
The statement of work is defined as follows:
| Name | Description | Source |
| Statement of work | Description of work to be done related to Software development. It may include:
|
Customer |
Output work products
- – Work products generated by the process and its corresponding destination, which can be another process or an external entity to the project, such as the customer or organizational management.
- – Output work products are identified by the abbreviation of the process name and showed as a two column table of product names and destinations. As an example, for the PM process we have the following table:
Name Destination Project plan Software Implementation Acceptance record Organizational Management Project repository Software Implementation Meeting record Customer Software configuration Customer
Internal work products
- – Work products generated and consumed by the process and not reviewed or approved by the customer.
- – Input work products are identified by the abbreviation of the process name and showed as a one column table of the work product names.
- – All work product names are printed in cursive and start with capital letters. Some products have one or more statuses attached to the product name surrounded by square brackets “[]” and are separated by a comma “,”.
- – The work product status may change during the process execution.
- – The source of a work product can be another process or an external entity to the project, such as the Customer. As an example, for the PM process we have the following table:
Name Change request Correction register Meeting record Verification results Progress status record Project repository backup
Roles involved
- – names and abbreviations of the functions to be performed by project team members;
- – several roles may be played by a single person and one role may be assumed by several persons;
- – roles are assigned to project participants based on the characteristics of the project;
- – roles are defined in a table as follows.
Role Abbreviation Competency Analyst AN Knowledge and experience eliciting, specifying, and analyzing the requirements.
Knowledge in designing user interfaces and ergonomic criteria.
Knowledge of the revision techniques.
Knowledge of the editing techniques.
Experience with software development and maintenance.
Activity
- – An activity is a set of cohesive tasks.
- – A task is a requirement, recommendation, or permissible action, intended to contribute to the achievement of one or more objectives of a process.
- – A process activity is the first level of process workflow decomposition, the second of which is a task.
- – Activities are identified by the process name abbreviation followed by consecutive numbers and the activity name. As an example, the activities of the PM process of the Basic profile are:
- PM.1 Project planning
- PM.2 Project plan execution
- PM.3 Project assessment and control
- PM.4 Project closure
Activity description
- – Each activity description is identified by the activity name and the list of related objectives surrounded by brackets “()”. For example, PM.1 project planning (PM.O1, PM.O5, PM.O6, PM.O7) means that the activity PM.1 project planning contributes to the achievement of the listed objectives: PM.O1, PM.O5, PM.O6, and PM.O7.
- – The activity description begins with the task summary and is followed by the task descriptions table. As an example, the project planning activity of the PM process is illustrated as follows:
Task description
- – Tasks are described in tables of four columns:
- Role—the abbreviation of roles involved in the task execution, for example, Project Manager (PM), Team Leader (TL), and Customer (CUS),
- Task—description of the task to be performed. Each task is identified by activity ID and consecutive number, for example, PM1.1,
- Input work products—work products needed to execute the task, for example, statement of work,
- Output work products—work products created or modified by the execution of the task.
- – The task description does not impose any technique or method to complete it.
- – The selection of the techniques or methods is left to the VSE or project team.
Table 9.9 describes the two tasks of the planning activity.
Table 9.9 Two Tasks of the Planning Activity [ISO 11e]
| Role | Task list | Input workproducts | Output workproducts |
| PM TL | PM.1.1 Review the Statement of Work | Statement of Work | Statement of Work [reviewed] |
| PM CUS | PM.1.2 Define the Delivery Instructions of each one of the deliverables specified in the Statement of Work with the customer | Statement of Work [reviewed] | Delivery Instructions |
To further help VSEs that develop systems or software, a four-stage roadmap has been published by ISO as illustrated in Figure 9.20. The entry profile is for VSEs working on small projects (e.g., a project of up to six person-months) and for start-ups; the basic profile is for VSEs developing only one project at a time with a single team; the intermediate profile is for VSEs involved in the simultaneous development of more than one project with more than one team; the advanced profile is for VSEs wishing to significantly improve the management of their business and their competitiveness.
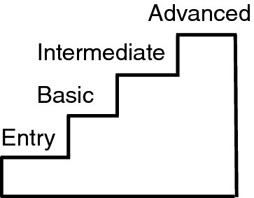
Figure 9.20 Four-stage roadmap of ISO/IEC 29110.
Readers are invited to download ISO/IEC 29110 technical reports, such as the management and engineering guides. ISO/IEC 29110 technical reports are available at no cost from ISO. 1 Many of them have also been translated into Spanish, Portuguese, French, and Japanese. ISO/IEC 29110 has also been adopted by some countries, such as Brazil, Japan, Mexico, Uruguay and Peru, as a national standard.
9.8 Case Study
Process description and process improvement are more than just technical activities. The management of change (i.e., organizational culture change) is, most of the time, the real challenge of a major process improvement initiative. An improvement process conducted over several years in a company in the defense sector has identified the following lessons learned [LAP 98]:
- Lesson 1: Set realistic expectations for senior management
Appropriate expectations must be defined before starting a process improvement program. A risk, especially for a low process maturity level organization, is to communicate to senior management the idea that the process improvement initiative will be simple, quick, and inexpensive. This should be avoided, as it creates an unrealistic expectation. Here is a typical scenario: senior management learns the advantages that a higher process maturity level might offer for the competitiveness of the organization. A project manager, or an external consultant, promotes that these goals are easily achievable. Upper management mandates a team to achieve certification in a very short time frame. Subsequently, senior management discovers with surprise that process improvement goals will require much more time, more resources and significant changes to existing practices than they expected.
- Lesson 2: Secure management commitment
For a low process maturity level organization, most of the findings associated with a process assessment will target PM shortcomings (look back at the CMMI process areas for level 2 displayed in Figure 4.9). It is therefore necessary to promote an attitude where management is willing to invest in the PM process rather than blame its personnel for current shortcomings. This is one other reason why it is necessary to frequently inform management so that they can be understanding and offer their commitment when such findings are made public in the organization.
- Lesson 3: Establish an improvement working group before a formal evaluation
It would be better if a small process improvement group be active a few weeks before a formal process assessment is begun by an external consultant. A process improvement group can take their time to familiarize themselves with the methods and tools associated with process improvement. Ideally, there should be a full-time person in this group, while other members could be involved on a part time basis. In addition to good technical skills, the members of this group must be selected according to their recognized expertise and their known enthusiasm for the improvement of project processes.
- Lesson 4: Start improvement activities shortly after the first assessment
Regarding the development of an action plan, the organization should capitalize on the momentum created by the process assessment. The organization does not have to expect that a fully completed plan of action be finalized before starting process improvement activities. Some improvement activities can begin immediately after the first assessment. Executing small improvements is an important motivational factor for all technical personnel and management.
- Lesson 5: Collect data to document improvements
Before and during the process assessment, it is recommended that quantitative and qualitative data be collected. These data will be used later to measure progress. One can obtain data such as budgets, schedules, quality, and the level of customer satisfaction. Given that management is investing in improvement, it will be important to be able to demonstrate that some gains are made.
- Lesson 6: Train all concerned personnel in regards to the process, methods and tools
Once the processes are defined, it is essential to train personnel. Otherwise, it is likely that the process will end up unused (i.e., on the shelves). It is misleading to think that developers will learn new processes on their own in addition to their current project workload. Training sessions also send a strong message that the organization is moving forward and that its developers should use these processes. During training sessions, it is necessary to communicate to personnel that with their first use of a new process, mistakes and questions are likely to emerge. This message may help reduce the stress level of first time users. A contact person should be assigned to help (e.g., a hotline) and coach personnel when faced with obstacles in the execution of new processes.
- Lesson 7: Managing the human dimension
We often underestimate the importance of the human dimension during a process improvement initiative. Those responsible for technological change are often extremely talented technically, but they are rarely well equipped in terms of change management approaches and techniques. The reason is simple: most of their training was focused on technology and not on the soft skills. However, the major difficulty of an improvement program is often managing the human dimension.
During the preparation of the technical part of an improvement action plan, change management elements must be planned as well. This implies, among other things, knowledge of: (1) the history of the organization with respect to similar efforts, successful or not; (2) the culture of the organization; (3) motivational factors, positive and negative, available to facilitate change; (4) the degree of perceived urgency communicated by management to conduct changes (look back at the case study presented in section 6.10).
- Lesson 8: Process improvement requires additional people skills
As mentioned above, an organization that really wants to make substantial productivity and quality gains must manage cultural change. A culture change requires a special skill set. The profile of the process improvement coordinator and facilitator is a person with skills in sociology and psychology. This often requires both management and personnel to change/adapt their behavior.
With the formalization of its processes, management must change its authoritative management style to a more participatory style. For example, if the organization really wants to improve its processes, a major source of improvement ideas must come from those who work, on a daily basis, with these processes. This implies that management should encourage and listen to new ideas. This also implies that the decision process may have to change from an autocratic style of “Do as you are told” to a participatory style of “Let's talk about this idea.” Similarly, the behavior of some employees who currently behave like “heroes” that can solve any problem should change to act as team members who can generate ideas, listen to the ideas of others and follow the process.
In addition, in the first months after the introduction of a new process, a new practice or a new tool, management and employees must recognize that mistakes and questions will be inevitable. Unless a clear signal is sent by management that this is acceptable and a safety net is set-up to recognize this situation, employees will “cover up” their mistakes. The result is that not only does the organization not learn from these mistakes, but other employees will make the same mistakes again. For example, the main purpose of an inspection process is to detect and correct errors and defects as soon as possible in the life cycle of the project. Management must accept that to increase the error detection rate, the results of individual inspections have to remain known only to the author and the inspection process coordinator; only the average obtained from numerous inspections will be made public. When this rule is accepted by management, employees feel safe to identify errors and report them. Another advantage is that those who participate in an inspection will learn to avoid these mistakes in their own work.
Facilitating behavior change requires skills that are not taught in technical courses. It is highly recommended that those responsible for facilitating change receive appropriate training.
- Lesson 9: Choose pilot projects carefully
It is very important to carefully select pilot projects and pilot participants, as these projects, if completed successfully, will promote the adoption of new practices across the organization. Users of a new process will make mistakes, so it is imperative to train participants and provide them with a safety net. If participants see that their errors are used to learn and make improvements to the process instead of to blame them, the level of anxiety will be reduced and the participants will bring more suggestions.
Managing the human dimension is something that will not only facilitate the adoption of changes, but also create an environment where changes can be introduced at a faster rate.
- Lesson 10: Conduct regular process audits
Process audits should be conducted on a regular basis for two main reasons: first, to ensure that practitioners use the process, and second, to discover errors, omissions or misunderstandings during their execution.
- Lesson 11: Link process improvement activities with the organization's business objectives
It was observed that the improvement of software engineering processes really gains momentum when management realizes that the real benefit of process improvement is the improvement of the quality of products (e.g., it reduces time-to-market and costs). Consequently, it improves the ability of the organization to better compete.
A multi-year process improvement plan is a very important tool to illustrate the links between the objectives of the organization, the requirements of the organization's projects and process improvements. Essentially, this plan shows that process engineering is not a static exercise, but a central infrastructure component for the success of the organization's projects. Finally, a multi-year plan also shows practitioners that a long-term management commitment to process improvement activities is present.
- Lesson 12: Adopt a common vocabulary
To succeed in any project, the use of common terminology is a fundamental requirement. In developing the software processes, it was observed that different participants had different meanings for the same word and the meaning of some words was unknown to some people. For example, prototyping had a meaning in systems engineering that was very different from that of software engineering. A terminology glossary was developed by a member of the process improvement project. The activity required collecting the vocabulary used by the participants and proposing definitions in order to gradually build a common glossary for all processes.
9.9 Personal Improvement Process
Although the SEI maturity models, such as the CMMI models, provide organizations with a proven framework for system and software process improvement, they describe “what” organizations should do and not “how” they should do it. But, software engineers also want to know how to do a process.
Since software development is a very complex process, it cannot be reduced to a cookbook of procedures. Watts S. Humphrey, the advocate of the maturity models, completed research in the early 1990s to show how process improvement principles can be applied to the daily work of software engineers. From this research, he concluded that the process management principles of Deming and Juran are also applicable to the individual processes used by software engineers, given that they apply to other areas of technology.
He used the fundamental principles of processes to show how engineers can define, measure and improve their own personal processes. Since each engineer is different, he must adopt his own practices to produce efficient and effective software. The Personal Software Process (PSP), developed by Humphrey, is a disciplined and structured approach to software development that enables all engineers to significantly increase the quality of their software products while increasing their productivity and respecting deadlines.
The PSP method is based on planning principles and the following quality principles [HUM 00]:
- – Every software engineer is different. To be more effective, they must estimate and plan their work. They also have to develop this information using their personal data.
- – To constantly improve their performance, engineers must use defined and measured processes.
- – To produce quality products, engineers must feel personally responsible for the quality of their products. Premium quality products are not just produced with luck, engineers must strive to do quality work.
- – It is less expensive to find and fix defects earlier than later in the process.
- – It is more effective to prevent defects than to find and correct them.
- – The right way to work is always the fastest and cheapest way to do work.
To properly complete a software engineering job, Humphrey said that engineers must plan their work before committing to or starting a job and they must use a defined process to do so. To understand their personal performance, they have to measure the time spent on each step of the work, count the defects they inject and correct and measure the size of the products they develop. To consistently produce quality products, engineers must plan, measure, and monitor the quality of the products and they must focus on quality early, at the beginning of a task. Finally, they must analyze the results of each task and use these results to improve their own processes [HUM 00].
The PSP method consists of the following five elements (scripts, forms, measurements, standards, and checklists) (adapted from [SEI 09]):
Scripts
Scripts are descriptions that guide the fulfillment of a personal process. They contain references to relevant forms, standards, checklists, sub-scripts, and actions. Scripts can be developed at a high level for a process or at a more detailed level for a particular phase of a process (e.g., a procedure). A script documents:
- – the purpose or objective of a process;
- – one or more entry criteria;
- – general guidelines, considerations of use or constraints;
- – phases or steps to be performed;
- – the measures and process quality criteria;
- – one or more exit criteria.
Forms
Forms provide an appropriate and coherent framework for the collection and retention of data. Forms indicate the necessary data and where to store it. When appropriate, forms define the necessary calculations and data definitions. Paper forms may be used if automated tools for data collection and storing are not readily available.
Measures
Measures are used to quantify the process and product. They allow for a better understanding of how the process works by allowing users to:
- – elaborate data project profiles that can be used for planning and process improvement;
- – analyze a process to determine how to improve it;
- – determine the effectiveness of a change to a process;
- – monitor the performance of their processes and take decisions for the next step;
- – monitor the capacity to meet their commitments and take the necessary corrective measures.
Standards
The PSP method recommends the use of a number of standards such as coding standards, the guidelines for counting lines of codes and a defect classification standard.
Checklists
In the PSP method, checklists are specialized forms (or standards) used to guide the personal reviews of a software product. Each item in a checklist verifies that the product is correct or verifies its compliance with standards or specifications. A checklist includes a list of the most common defects that can be found by reviewing a specific software product. The product is fully reviewed using a single item, taken from top to bottom, from the checklist. When a list item is reviewed and completed, this item is marked as done. When all the items in the checklist have been checked and the list has been signed by the person who performed the review, it can be used as a quality record and proof that a review was done. Table 9.10 shows an example of a checklist. A line at the top of the checklist is available to indicate the title of the document/product verified. A column to the right of the checklist allows the auditor to note when an item is checked. Finally, a line at the bottom of the checklist identifies the person who carried out the review and indicates the date.
Table 9.10 Example of a Partial Review Used by the PSP Method (adapted from [HUM 00])
| Title of the document/product reviewed : | |||
| No. | Name | Description | Verified |
| 10 | Documentation | Comment, messages | 5 |
| 20 | Syntax | Syntax problem | 8 |
| 21 | Typographic error | Spelling, punctuation | 6 |
| 23 | Start-end | Limits are not properly identified | 12 |
| 52 | I/O | File, display, printer, communication | 70 |
| 70 | Data | Structure, content | 70 |
| 80 | Function | Logic | |
| Date: | Verified by: | ||
Figures 9.21, 9.22, and 9.23 present improvements to the process for effort estimation, quality, and productivity. These improvements are achieved when practitioners complete the 10 training sessions of the PSP method. Participants must write 10 programs and collect data during that time. In these three figures, the performance during the development of program 1 is displayed to the left and the performance obtained from the tenth program is presented to the right. The resulting data are the average result of over 298 students that participated in this training over time [HUM 00].

Figure 9.21 Effort estimation improvement (adapted from [HUM 00]).

Figure 9.22 Quality improvement (adapted from [HUM 00]).

Figure 9.23 Productivity improvement (adapted from [HUM 00]).
Figure 9.21 shows improvements in the estimate of effort.
Figure 9.22 shows the quality improvements.
Figure 9.23 shows the productivity improvements.
After each exercise, the student takes the time to reflect on his performance to identify areas for improvement. As shown in these figures, the PSP method greatly improves the ability to estimate, improve quality, and improve productivity. After completing the PSP training, the student was better equipped to document his own estimates and more importantly, to defend them to his management team or to a future client.
9.10 Policies, Processes, and Procedures in the SQA Plan
The IEEE 730 standard begins with a statement that SQA procedures, practices, and policies should be developed and should conform to this standard.
This requires management to ensure that an organizational policy is established that defines and governs SQA roles and responsibilities in their organization. This is because the purpose of the IEEE 730 standard is to define the scope of SQA as:
- – assessing the software development process;
- – evaluating the conformance to software processes;
- – evaluating the effectiveness of the software processes.
These processes include those that identify and establish the software requirements, develop the software product, and maintain the software product.
The newly created SQA function will then define, in collaboration with software developers and managers, the processes as well as the SQA function's role, concepts, methods, procedures, and practices to be applied in the organization. One of the first actions will be to define the organizational quality policy statement to be included in the future organizational quality management system. This organizational quality policy statement that defines the SQA process as an organization level process independent of SQA processes established for specific projects, will need to be supported by documented processes and procedures. In doing this, SQA must lead the identification of the standards, models, and procedures established by the project or organization. It is at that time that tasks are assigned to those responsible for SQA activities and for implementing the organizational quality policy statement.
Once these are defined and set up, adherence of products, processes, and activities to the applicable standards, procedures, and requirements are verified by project teams as well as independently by SQA.
SQA must also ensure that life cycle processes, models, and procedures for use by the organization have been defined, maintained, and improved. They must have helped in developing appropriate policies and procedures for the management and deployment of life cycle models and processes. These must have been made available, explained and provided to the personnel. Of particular interest to them is a need to ensure that processes and procedures exist related to reporting policy, process, and procedure non-conformances. Once this is available, SQA is responsible for monitoring the implementation of processes and procedures related to corrective and preventive action that can be used for the organizational repository and documentation.
The SQA function should regularly review the organizational quality policy and identify gaps and inconsistencies between the policy and proposed SQA roles and responsibilities.
Questions that project managers should ask themselves concerning policy, processes, and procedures are:
- – what organizational reference documents (such as standard operating procedures, coding standards, and document templates) are applicable to this project?
- – has adherence of products, processes, and activities to the applicable standards, procedures, and requirements been verified?
9.11 Success Factors
The following text box lists some factors that affect the development, implementation, and improvement of an organization's processes.
9.12 Further Reading
- POTTER N. and SAKRY M. Making Process Improvement Work. Addison-Wesley Professional, 2002.
- GARCIA S. and TURNER R. CMMI Survival Guide, Addison-Wesley Professional, 2007.
- LAPORTE C. Y., BERRHOUMA N., DOUCET M., and PALZA-VARGAS E. Measuring the cost of software quality of a large software project at Bombardier Transportation, Software Quality Professional Journal, ASQ, vol. 14, issue 3, June 2012, pp. 14–31.
9.13 Exercises
-
Develop a checklist to determine whether a draft policy really is a policy. Provide five criteria.
-
Develop a list of criteria to guide a project manager to adapt the organization's process to the requirements of his project.
-
Develop a “scoring” grid to determine whether a process is consistent with a model (e.g., the CMMI-DEV).
-
Develop a list of criteria to help you determine whether a standard or model is compatible with the organization's culture and its way of working.
-
You have chosen the ETVX notation to document processes and business procedures. Your boss asks you to explain why. Give five reasons.
-
You have chosen the CMMI-DEV as a repository for documenting business processes. Your boss asks you to explain why. Provide five reasons.
-
You have decided not to use the CMMI-DEV as a repository for documenting business processes. Your boss asks you to explain why. Provide five reasons.
-
You have chosen the ISO 29110 standard for the development of software for your organization. Your boss asks you to explain why. Provide five reasons.
-
You decided not to use the ISO 29110 standard for the development of software for your organization. Your boss asks you to explain why. Provide five reasons.