
Chapter 1
Introduction
The main objective of this book is to develop machine learning (ML) tools that help minimize the (costly) human supervision required for the analysis of large volumes of data. To address such an objective, the research work developed in this book focused on two major fields in ML: unsupervised and semi-supervised learning. Both ML areas have been widely used in a large number of applications such as the clustering and semi-automatic annotation of large datasets of documents and the dimensionality reduction of microarray matrices for the analysis and interpretation of genomic data. In these examples, owing to the complexity and/or size of the large amounts of data to be processed, a fully supervised analysis without the help of semi- or unsupervised ML tools would become prohibitive.
Thus, the first aim of this book focused on the development of new algorithms in the field of semi-supervised ML. Semi-supervised learning provides an alternative to fully supervised classification. In supervised classification, a so-called training phase is performed using only labeled data. Typically, the labels for the training observations are manually compiled by human annotators. Then, a supervised algorithm is capable of inferring prediction rules or models from the available training data and consequently delivering the most probable label for a new observation, not necessarily observed in the training data. However, a major limitation of supervised algorithms is related to the availability of large corpora labeled in order to achieve accurate predictions. As it is generally accepted in the ML literature, the performance of supervised classifiers can drastically drop down if only training sets of small dimensions are available.
In [CAS 95] it was shown that some advantage could be, however, gained if a large amount of unlabeled data is available. In particular, this is possible to the degree to which class labels fulfill certain assumptions that allow us to identify the class structure from both labeled and unlabeled data. The framework of classification algorithms designed to use both labeled and unlabeled data to generate their prediction models is known as semi-supervised classification.
Nowadays, the semi-supervised learning field is rapidly evolving, as evidenced by the large amount of semi-supervised approaches available in the machine learning literature, including generative models, co-training, self-training, and graph-based models etc. Frequently, the learning strategy followed by many semi-supervised algorithms can be summarized as follows: (1) select a supervised algorithm with a certain learning rule for labeled data and (2) modify the learning rule by including unlabeled data so that a common objective is attained. A drawback of such a strategy is the algorithms’ stability/robustness with respect to the existence of labeling errors. Given the human effort involved in the manual labeling task, training sets are not exempted from potential labeling errors. These may occur depending on the degree of expertise of the human annotators. Even for expert labelers, the confidence in annotating patterns with a certain degree of ambiguity may drop drastically. Hence, a subjective bias in annotating this kind of pattern is unavoidable. Depending on the nature of the classification task and corpora, subjective biases may become a commonly faced problem, as happens in the recognition of emotional states.
Given the aforementioned statement, in this book two different approaches to semi-supervised classification are described which rely on unsupervised clustering as a prior step to classification. By clearly separating the clustering and classification objectives, the proposed algorithms may gain some robustness under labeling errors with respect to other existing semi-supervised algorithms. The first algorithm has been developed for utterance corpora. It exploits the semantic feature variability by means of prior feature clustering, which is combined with a “fully unsupervised” algorithm for pattern disambiguation. The second approach performs the clustering in the pattern space to extract the underlying class structure and uses the labeled sets to automatically annotate the clusters.
The second aim of this book is to identify the underlying classes in a dataset in a fully unsupervised way, i.e. under the absence of labels. The field of unsupervised learning has witnessed an accelerated growth since the mid-1940s (see Chapter 2 for detail information), resulting in a large pool of clustering algorithms in the ML literature. However, the first question that arose with the use of a clustering algorithm is the optimum number of clusters to be selected. Most clustering algorithms are parametric approaches, which may explicitly require the number of clusters k as an input parameter, or implicitly, other types of parameters that also require appropriate estimation. A number of cluster validation techniques have been also proposed for an attempt to estimate the optimum k, but most of them are reported to provide individual performances ad-hoc which depend on the clustering algorithm and distance functions selected. A number of authors in the unsupervised literature have claimed that finding the optimum k still remains an open research topic.
In this respect, this book also provides some attempts to solve the problem of the number of clusters. The first developed algorithm is a non-parametric clustering tool, which automatically identifies the number of clusters during the clustering process itself. The second approach is a cluster validation strategy that attempts to overcome the individual performances of other existing cluster validation techniques through an adequate combination of them.
1.1. Organization of the book
The book is divided into three main parts:
– The first part (Chapters 1 and 2) states the main objectives and motivation of the contributed tools, and describes the state of the art of unsupervised and semi-supervised methods.
– The second part (Chapters 3 and 4) describes the main contributions of the book in the field of unsupervised learning. Semi-supervised tools take advantage of both labeled and unlabeled data. In Chapter 3, a semi-supervised scheme for the categorization of utterances by using a unique labeled example per category is described. Unlabeled data is then used to identify clusters of synonym words from the vocabulary. This way, the initial small vocabulary available to the classifier is expanded to the clusters of words. Furthermore, the main contribution of the book, which provides important improvements in categorization accuracy, consists of a new unsupervised scheme for the reallocation of ambiguous utterances based on the identification of the most informative words.
Chapter 4 describes a semi-supervised classification approach based also on prior clustering, but this time applied to patterns (e.g. utterances) instead of words. Then, a minimum number of labels were used to automatically annotate the patterns inside the obtained clusters. An optimum cluster labeling is achieved by defining a cost matrix in terms of overlapping labels inside the clusters and applying the Hungarian algorithm to derive the optimum assignment of labels to clusters. This way, the initial small training set is automatically extended to the whole clustered data. This semi-supervised approach has been evaluated and compared to a fully supervised approach in which the initial labeled seeds were directly used to train a supervised classifier.
– The third part of the book (Chapters 5 and 6) describes the contributions in unsupervised learning, particularly focused on the automatic detection of the number of clusters. Chapter 5 focuses on an existing algorithm, the pole-based overlapping clustering (PoBOC), which is, to the author’s knowledge, the only fully non-parametric existing algorithm that is able to detect the number of clusters. Moreover, a hierarchical alternative, namely, hierarchical pole-based clustering (HPoBC), is proposed to overcome a major limitation of PoBOC related to the extraction of clusters based on a concept of globally defined neighborhood. The new alternative applies PoBOC recursively to find clusters based on local neighborhoods. Both approaches have been compared with other traditional algorithms introduced in Chapter 2.
In Chapter 6, the detection of the optimum number of clusters (k) is addressed through cluster validation strategies. In particular, a combination approach is described which attempts to find the optimum k from the combination of validation curves obtained through traditional methods.
1.2. Utterance corpus
The first datasets are two corpora of utterance transcripts collected from spoken language dialogue systems (SLDSs). SLDS emerged in the mid-1990s as a new, important form of human—machine communication. In essence, the typical architecture of an SLDS can be observed in Figure 1.1.
Figure 1.1. Overview of an SLDS
First, input acoustic vectors generated from the speech signal are processed by an Automatic Speech Recogniser (ASR), resulting in a raw text transcription 1 of the input utterance. Subsequently, the transcribed text is interpreted in a semantic analysis block which extracts the utterance meaning in form of an appropriate semantic structure. This semantic representation is processed by the dialog manager which also communicates directly with an external application, namely a database interface. The dialog manager keeps control of the overall interaction progress towards the task completion. During this process, the user may be queried for confirmations, disambiguations, necessary additional information, etc. Finally, the interaction result is presented to the user in form of speech (text-to-speech synthesis or prerecorded prompts).
The utterance corpora used in this book have been obtained from a particular type of SLDS known as automated throubleshooting agents. These are SLDS specially designed to perform customer care issues over the telephone, in a similar way as human agents do. One essential component of this type of SLDSs is the semantic analysis block. Typically, the semantic analysis in throubleshooting agents is carried out at the utterance level. The users are presented an open prompt, such as “please briefly described the reason for your call.” Then, the semantic analysis block maps the unconstrained, natural language user response into one of the possible problems from a predefined list. This is done by means of statistical classifiers. This particular kind of semantic analysis is generally known as Statistical Spoken Language Understanding (SSLU).
The machine learning tools developed in this book are focused on semi-supervised utterance classification for SSLU and the unsupervised discovery of potential symptoms. Both utterance corpora presented in the following are referred to different application domains of commercial troubleshooting agents and have been made available by SpeechCycle Labs [ACO 07].
The first corpus is related to the “Internet” domain. Some examples of transcribed utterances and their corresponding (manual) annotations “symptom categories” are shown in Table 1.1
It should be noted that an utterance is defined as “a complete unit of speech in spoken language.” Although transcribed utterances may have a similar form as text sentences, utterances share the characteristics of natural language, in contrast to sentences in written language. Thus, it is not rare to observe ill-formed or gramatically incomplete utterance transcriptions (in particular when they reflect the users’ responses to the system’s prompts).
Table 1.1. Some examples of utterances and their corresponding manual labels (annotations) in the utterance corpora
| Utterance transcript | Annotation |
|---|---|
| Remotes not working | Cable |
| Internet was supposed to be scheduled at my home today | Appointment |
| Billing Information | Billing |
| I’am having Internet problems | Internet |
| I need to get the hi-def cable box installed | Cable |
| I need to talk to a representative | Operator |
The Internet utterance corpus is composed of a total of 34,848 utterances with k = 28 symptom categories. From these, 3,313 utterances (9.96%) have been used as test utterances, and 31,535 utterances (90.4% of the corpus) as the developing set.
The second utterance corpus is refered to video troubleshooting. Both test and training datasets are composed of 10,000 utterance transcripts and their corresponding symptom annotations. In total, k = 79 symptoms can be distinguished.
1.3. Datasets from the UCI repository
The UCI machine learning repository is one of the most popular collections of real word and simulated datasets to be used for machine learning experiments. In this book, the following datasets have been selected, with different characteristics (number of features and classes). The projections of the datasets into the three principal components can be observed in Figures 1.2 and 1.3.
1.3.1. Wine dataset (wine)
The wine set consists of 178 instances with 13 attributes, representing three different types of wines.
Figure 1.2. Projection of the datasets on the three principal components: (a) breast dataset, (b) diabetes dataset, (c) wine dataset, and (d) Iris dataset
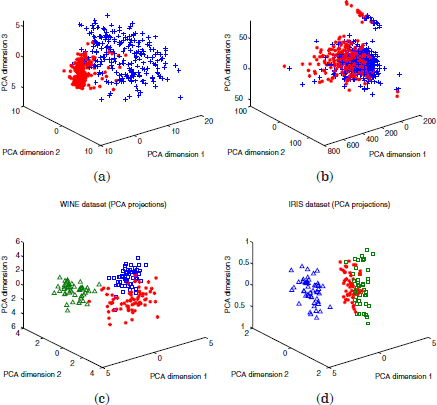
1.3.2. Wisconsin breast cancer dataset (breast)
This dataset contains 569 instances in 10 dimensions, denoting 10 different features extracted from digitized images of breast masses. The two existing classes are referred to the possible breast cancer diagnosis (malignant, and benign).
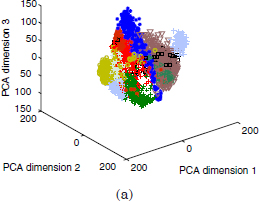
1.3.3. Handwritten digits dataset (Pendig)
The third real dataset is for pen-based recognition of handwritten digits. In this work, the test partition has been used, composed of 3,498 samples with 16 attributes. Ten classes can be distinguished for the digits 0–9.
Figure 1.3. Pendig dataset (projection on the three principal components)
1.3.4. Pima Indians diabetes (diabetes)
This dataset comprises 768 instances with eight numeric attributes. Two classes denote the possible diagnostics (the patients show or do not show signs of diabetes).
Figure 1.5. Spatial data bases. (a) Dataset with 100 points in 5 spatial clusters (100p5c), (b) mixture of 6 Gaussians, 1500 points (6Gauss), (c) mixture of three Gaussians (3Gauss), (d) 560 points, 8 clusters (560p8c) and (e) 1000 points, 9 clusters (1000p9c)
1.3.5. Iris dataset (Iris)
The Iris set is one of the most popular datasets from the UCI repository. It comprises 150 instances iris of three different classes of iris flowers (Setosa, Versicolor, and virginica). Two of these classes are linearly separable, the third one is not whereas linearly separable from the second one.
1.4. Microarray dataset
The NCI60 dataset [ROS 00] of the University of Standford has been also used. This dataset is publicly available at [NCI 06]. It consists of gene expression data for 60 cell lines derived from different organs and tissues. The data is a 1,375×60 matrix where each row represents a gene, and each column a cell line, related to a human tumor. Nine known tumor types and one unknown can be distinguished. The cancer types include: leukemia, colon, breast, prostate, lung, ovarian, renal, central nervous system, and melanoma.
1.5. Simulated datasets
Finally, simulated datasets in two dimensions have also been used to illustrate the behavior of the proposed algorithms and their outcomes.
1.5.1. Mixtures of Gaussians
The first datasets are two mixtures of five and seven Gaussians in two dimensions, where a certain amount of overlapping patterns can be observed.
1.5.2. Spatial datasets with non-homogeneous inter-cluster distance
These datasets comprise a number of patterns in two dimensions which build a hierarchy of groups, or groups non-homogeneouly distributed in the data space. Essentially, these datasets have been conceived for the demonstration of the HPoBC algorithm in Chapter 5.
To synthesize the data, a java applet has been implemented. The application is available online.
1. Most probable sequence of words detected.