
Chapter 2
Grabbing Data from External Sources
In This Chapter
![]() Exporting data from other programs
Exporting data from other programs
![]() Importing data into Excel
Importing data into Excel
![]() Running a web query
Running a web query
![]() Importing a database table
Importing a database table
![]() Querying an external database
Querying an external database
In many cases, the data that you want to analyze with Excel resides in an external database or in a database application, such as a corporate accounting system. Thus, often your very first step and very first true challenge are to get that data into an Excel workbook and in the form of an Excel table.
You can use two basic approaches to grab the external data that you want to analyze. You can export data from another program and then import that data into Excel, or you can query a database directly from Excel. I describe both approaches in this chapter.
Getting Data the Export-Import Way
You can usually easily export data from popular database programs and accounting systems. Excel is the dominant data analysis tool available to business. Because of this, most database programs and most management information systems export data in a format that makes it simple to import the data into Excel later.
Exporting: The first step
Your first step when grabbing data from one of these external sources, assuming that you want to later import the data, is to first use the other application program — such as an accounting program — to export the to-be-analyzed data to a file.
You have two basic approaches available for exporting data from another application: direct exporting and exporting to a text file.
Direct exporting
Direct exporting is available in many accounting programs because accountants love to use Excel to analyze data. For example, the most popular small business accounting program in the world is QuickBooks from Intuit. When you produce an accounting report in QuickBooks, the report document window includes a button labeled Excel or Export. Click this button, and QuickBooks displays the Send Report to Excel dialog box, as shown in Figure 2-1.
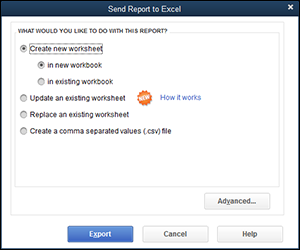
Figure 2-1: Begin exporting here.
The Send Report to Excel dialog box provides radio buttons with which you indicate whether you want to send the report to a comma-separated-values file, to a new Excel spreadsheet, or to an existing Excel spreadsheet.
To send (export) the report to an existing Excel spreadsheet, you need to identify that workbook by entering the workbook pathname and filename into the text box provided. Or, click the Browse button and use the Open Microsoft Excel File dialog box that appears (not shown) to identify the folder and workbook file.
 The Export Report dialog box also includes an Advanced button. Click this button, and QuickBooks displays the Advanced dialog box (see Figure 2-2) that you can use to control how the exported report looks. For example, you get to pick which fonts, colors, spacing, and row height that you want. You also get to turn on and turn off Excel features in the newly created workbook, including AutoFit, Gridlines, and so on.
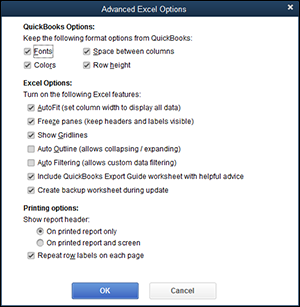
Figure 2-2: Exporting programs, including QuickBooks, often provide options to control how exported data looks.
In Figure 2-3, you can see how the QuickBooks report looks after it has been directly exported to Excel.
 Okay, obviously, you might not want to export from QuickBooks. You might have other applications that you want to export data from. You can export data directly from a database program like Microsoft Access, for example. But the key thing that you need to know — and the reason that I discuss in detail how QuickBooks works — is that applications that store and collect data often provide a convenient way for you to export information to Excel. Predictably, some application programs work differently, but usually, the process is little more than clicking a button labeled Excel (as is the case in QuickBooks) or choosing a command labeled something like Export or Export to Excel.
Therefore, when exporting data from some other program, your first step is to do a little bit of digging and research to see whether there’s a way to easily and automatically export data to Excel. This fact-finding shouldn't take much time if you use the online Help system.
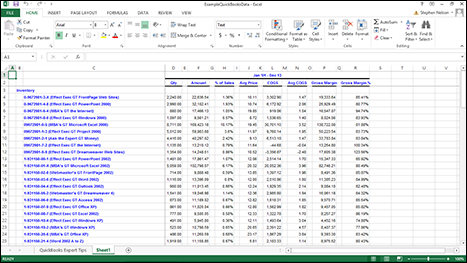
Figure 2-3: A QuickBooks report that has been directly exported to Excel.
Versions of Microsoft Access up through and including Access 2003 include an Export command on the File menu, and Access 2007 and later versions include an Export command on its Microsoft Office menu. Choose the Export command to export an Access table, report, or query to Excel. Just choose the appropriate command and then use the dialog box that Access displays to specify where the exported information should be placed.
Exporting to a text file
When you need to export data first to a text file because the other application won't automatically export your data to an Excel workbook, you need to go to a little more effort. Fortunately, the process is still pretty darn straightforward.
When you work with applications that won’t automatically create an Excel workbook, you just create a text version of a report that shows the data that you want to analyze. For example, to analyze sales of items that your firm makes, you first create a report that shows this.
The trick is that you send the report to a text file rather than sending this report to a printer. This way, the report gets stored on disk as text rather than printed. Later, Excel can easily import these text files.
See how this works in more concrete terms by following how the process works in QuickBooks. Suppose, for the sake of illustration, that you really did want to print a list of items that you sell. The first step is to produce a report that shows this list. In QuickBooks, you produce this report by choosing the appropriate command from the Reports menu. Figure 2-4 shows such a report.
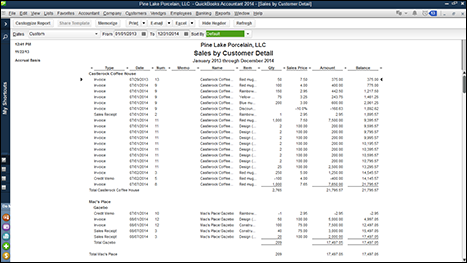
Figure 2-4: Begin to export a text file from a QuickBooks report.
The next step is to print this report to a text file. In QuickBooks, you click the Print button or choose File⇒Print Report. Using either approach, QuickBooks displays the Print Reports dialog box, as shown in Figure 2-5.
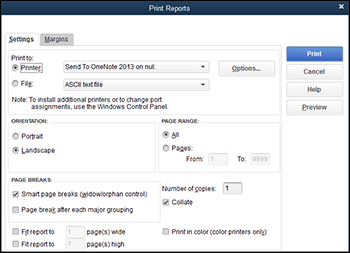
Figure 2-5: Print a QuickBooks report here.
Pay attention to the Print To radio buttons shown near the top of the Settings tab. QuickBooks, like many other programs, gives you the option of printing your report either to a printer or to a file.
If you want to later import the information on the report, you should print the report to a file. In the case of QuickBooks, this means that you select the File radio button. (Refer to Figure 2-5.)
The other thing that you need to do — if you’re given a choice — is to use a delimiter. In Figure 2-5, the File drop-down list shows ASCII text file as the type of file that QuickBooks will print. Often, though, applications — including QuickBooks — let you print delimited text files.
Delimited text files use standard characters, called delimiters, to separate fields of information in the report. You can still import a straight ASCII text file, but importing a delimited text file is easier. Therefore, if your other program gives you the option of creating delimited text files, do so. In QuickBooks, you can create both comma-delimited files and tab-delimited files.
In QuickBooks, you indicate that you want a delimited text file by choosing Comma Delimited File or Tab Delimited File from the File drop-down list of the Print Reports dialog box.
To print the report as a file, you simply click the Print button of the Print Reports dialog box. Typically, the application (QuickBooks, in this example) prompts you for a pathname, like in the Create Disk File dialog box shown in Figure 2-6. The pathname includes both the drive and folder location of the text file as well as the name of the file. You provide this information, and then the application produces the text file … or hopefully, the delimited text file. And that's that.
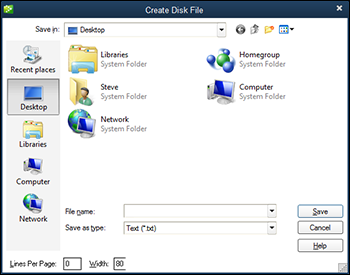
Figure 2-6: The Create Disk File dialog box.
Importing: The second step (if necessary)
When you don’t or can’t export directly to Excel, you need to take the second step of importing the ASCII text file that you created with the other program. (To read more about exporting to a text file, see the preceding section.)
To import the ASCII text file, first open the text file itself from within Excel. When you open the text file, Excel starts the Text Import Wizard. This wizard walks you through the steps to describe how information in a text file should be formatted and rearranged as it’s placed in an Excel workbook.
One minor wrinkle in this importing business is that the process works differently depending on whether you’re importing straight (ASCII) text or delimited text.
Importing straight text
Here are the steps that you take to import a straight text file:
- Open the text file by choosing Open from the File menu or by choosing the Data tab’s Get External Data from Text command.
Excel displays the Open dialog box, shown in Figure 2-7, if you choose the Open command. Excel displays a nearly identical Import Text File dialog box if you choose the Data tab’s Get External Data from Text command.
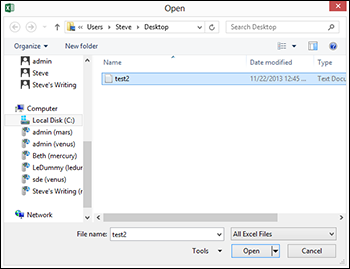
Figure 2-7: Open the text file that you want to import.
- Choose Text Files from the drop-down list that appears to the right of the File text box.
- Use the Look In drop-down list to identify the folder in which you placed the exported text file.
You should see the text file listed in the Open dialog box.
- To open the text file, double-click its icon.
Excel starts the Text Import Wizard, as shown in Figure 2-8.
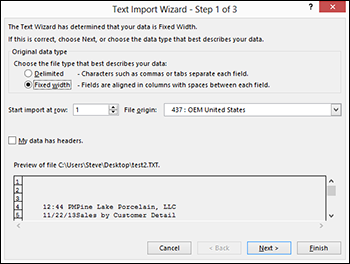
Figure 2-8: Step 1 of the Text Import Wizard.
- Select the Fixed Width radio button.
This tells Excel that the fields in the text file are arranged in evenly spaced columns.
- In the Start Import at Row text box, identify the row in the ASCII text file that should be the first row of the spreadsheet.
In general, ASCII text files use the first several rows of the file to show report header information. For this reason, you typically won't want to start importing at row 1; you’ll want to start importing at row 10 or 20 or 5.
Don't get too tense about this business of telling the Text Import Wizard which row is the first one that should be imported. If you import too many rows, you can easily delete the extraneous rows later in Excel.
You can preview the to-be-imported report shown on the bottom section of the Text Import Wizard dialog box.
- Click Next.
Excel displays the second step dialog box of the Text Import Wizard, as shown in Figure 2-9. You use this second Text Import Wizard dialog box to break the rows of the text files into columns.
You might not need to do much work identifying where rows should be broken into columns. Excel, after looking carefully at the data in the to-be-imported text file, suggests where columns should be broken and draws vertical lines at the breaks.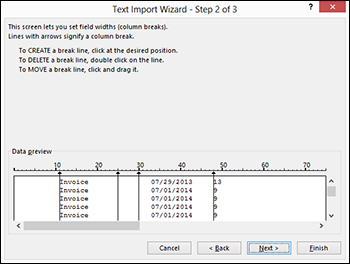
Figure 2-9: Step 2 of the Text Import Wizard.
- In the Data Preview section of the second wizard dialog box, review the text breaks and amend them as needed.
- If they’re incorrect, drag the break lines to a new location.
- To remove a break, double-click the break line.
- To create or add a new break, click at the point where you want the break to occur.
- Click Next.
Excel displays the third step dialog box of the Text Import Wizard, as shown in Figure 2-10.
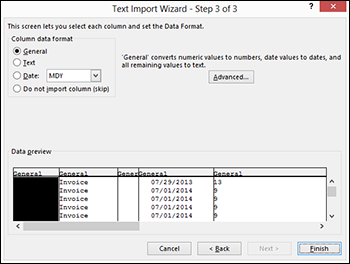
Figure 2-10: Step 3 of the Text Import Wizard.
- (Optional) Choose the data format for the columns in your new workbook.
You can pick default formatting from the third Text Import Wizard dialog box for the columns of the new workbook.
- To choose the default format for a column, click that column in the Data Preview box and then select one of the four Column Data Format radio buttons.
- If you choose the Date format radio button as the default for a column, use the Date drop-down list to choose a Date format.
- (Optional) Identify any columns that Excel should not import.
If you don't want to import a column, select a column in the Data Preview box and then select the Do Not Import Column (Skip) radio button.
- (Optional) Nit-pick how the data appears in the text file.
You can click the Advanced button (on the third Text Import Wizard dialog box) to display the Advanced Text Import Settings dialog box, as shown in Figure 2-11. The Advanced Text Import Settings dialog box provides text boxes that you can use to specify in more detail or with more precision how the data in the text file is arranged.
- Choose what symbol is used to separate whole numbers from decimal values by using the Decimal Separator drop-down list.
- Choose what symbol is used to separate thousands by using the Thousands Separator drop-down list.
Click OK after you make choices here; you return to the third wizard dialog box.
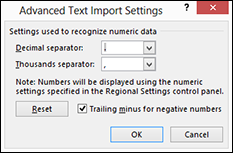
Figure 2-11: The Advanced Text Import Settings dialog box.
- Click Finish.
Excel imports the text file according to your specifications and places it into a new Excel workbook, as shown in Figure 2-12. The data probably won't be perfectly laid out. Still, when you have very large data sets, you'll find importing a tremendous timesaver. In general, you won't find it terribly difficult to clean up the new workbook. You only need to delete a few rows or perhaps columns or maybe do a bit of additional formatting or row and column resizing.
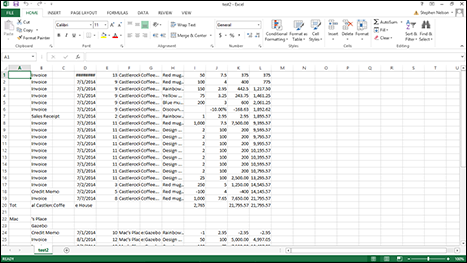
Figure 2-12: The imported text file in an Excel workbook.
Importing delimited text files
Here are the steps that you take to import a delimited text file:
- Choose the File menu’s Open command or click the Data tab’s Get External Data from Text button.
Excel displays the Open dialog box (refer to Figure 2-7) or the Import Text File dialog box (which is nearly identical to Figure 2-7).
- Choose Text Files from the drop-down list.
The drop-down list box you use to choose the type of file you want appears to the right of the File Name text box.
- Use the Look In drop-down list to identify the folder in which you placed the exported text file.
You should see the text file listed in the Open dialog box.
- To open the text file, double-click its icon.
Excel may be able to guess how the delimited data file organizes its data and just open the file in the Excel workbook window. Or Excel may start the Text Import Wizard, as shown in Figure 2-13.
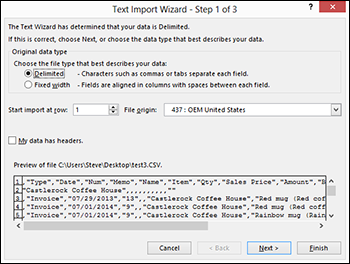
Figure 2-13: The first Text Import Wizard dialog box.
- Select the Delimited radio button.
This tells Excel that the fields in the text file are separated by (one or more) delimiters.
- In the Start Import at Row text box, identify the point in the delimited text file that should be the first row of the spreadsheet.
In general, ASCII text files use the first several rows of the file to show report header information. For this reason, you typically want to start importing at row 10 or 20 or 5.
Don't get too tense about this business of telling the Text Import Wizard which row is the first one that should be imported. You can easily delete the extraneous rows later in Excel.
You can preview the to-be-imported report shown on the bottom section of the Text Import Wizard dialog box.
- Click Next.
Excel displays the second dialog box of the Text Import Wizard, as shown in Figure 2-14. You use this second Text Import Wizard dialog box to identify the character or characters used as the delimiter to break the text into columns. For example, if the file that's being imported is a tab-delimited file, select the Tab check box in the Delimiters area.
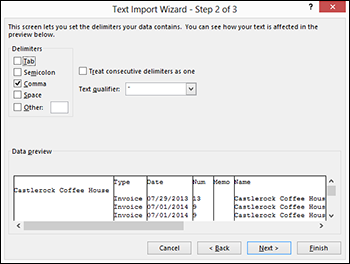
Figure 2-14: The second Text Import Wizard dialog box.
- Click Next.
The third Text Import Wizard dialog box appears, as shown in Figure 2-15.
- (Optional) Choose the data format for the columns in your new workbook:
- To choose the default format for a column, click that column in the Data Preview box and then select one of the Column Data Format radio buttons.
- To use the Date format as the default for a column, select the Date radio button and use the Date drop-down list to choose a Date format.
The Data Preview box on the second Text Import Wizard dialog box shows how the file will look after it’s imported based on the delimiters that you identified. Experiment a bit to make sure that you import the data in a clean format.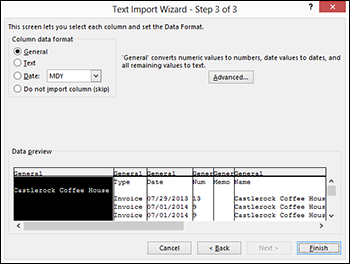
Figure 2-15: The third Text Import Wizard dialog box.
- (Optional) Identify any columns that Excel should skip importing.
If you don't want to import a column, select the column and then select the Do Not Import Column (Skip) radio button.
- (Optional) Nit-pick how the data appears in the text file.
Click the Advanced command button of the third Text Import Wizard dialog box to display the Advanced Text Import Settings dialog box. (Refer to Figure 2-11.) Here, you can specify in more detail how the data in the text file is arranged.
Click OK to return to the third Text Import Wizard dialog box.
- Click Finish.
Excel imports the delimited text file according to your specifications. As with a straight text file, the data probably won't be perfectly laid out. But you won't find it difficult to clean up the new workbook. A few deletions, a little resizing, and pretty soon the workbook will look the way you want.
Querying External Databases and Web Page Tables
Another approach to collecting data that you want to analyze is to extract data from a web page or from an external database. Excel provides three very neat ways to grab this sort of external data:
- You can perform a web query, which means that you can grab data from a table stored in a web page.
- You can import tables stored in common databases, such as Microsoft Access.
- You can use Microsoft Query to first query a database and then place the query results into an Excel workbook.
All three approaches for grabbing external data are described in the paragraphs that follow.
The difference between importing information that you want to analyze by using the Open command or Get External Data from Text command (read the preceding sections of the chapter) and importing information by using the Get External Data from Web or Get External Data from Access commands (read the following paragraphs) is somewhat subtle. In general, however, these latter two commands enable you to grab data directly from some external source without first massaging the data so that it’s more recognizable.
Running a web query
One of the neatest ways to grab external data is through a web query. As you know if you’ve wasted any time surfing the web, Internet websites provide huge volumes of interesting data. Often, you’d like to grab this data and analyze it in some way. And fortunately, Excel provides an easy way to move such data from a web page into Excel.
With the Excel Web Query tool, as long as the data that you want to grab or analyze is stored in something that looks like a table — that is, in something that uses rows and columns to organize the information — you can grab the information and place it into an Excel workbook.
To perform a web query, follow these steps:
- Choose the File menu’s New command to open a blank workbook.
You need to place query results into a blank worksheet. Therefore, your first step might need to be to open a workbook with a blank worksheet.
If you need to insert a blank worksheet into an existing workbook, click the Insert Worksheet button. This button appears on the bottom edge of the worksheet next to the sheet tabs: Sheet1, Sheet2, Sheet3, and so on. - Tell Excel that you want to run a web query by choosing the Data tab’s Get External Data from Web command.
Excel displays the New Web Query dialog box, as shown in Figure 2-16.
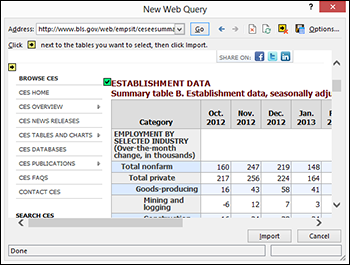
Figure 2-16: The New Web Query dialog box.
- Open the web page containing the table that you want to extract data from by entering its URL into the Address field.
In Figure 2-16, I show a page from the United States Bureau of Labor Statistics. The Bureau of Labor Statistics website provides tons of tabular information, so if you want to play along, go ahead and visit the website at www.bls.gov and poke around until you find a page that shows a table.
- Identify the table by clicking the small yellow arrow button next to the table.
Excel places this small yellow right-arrow button next to any tables that it sees in the open web page. All you need to do is to click one of the buttons to grab the data that the arrow points to.
Excel replaces the yellow arrow button with a green check button.
- Verify that the green check button marks the table that you want to import and then import the table data by clicking the Import button.
Excel displays the Import Data dialog box, as shown in Figure 2-17.
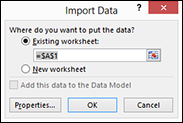
Figure 2-17: The Import Data dialog box.
- In the Import Data dialog box, tell Excel where to place the imported web data.
Select the Existing Worksheet radio button to place the table data into the existing, open, empty worksheet. Alternatively, select the New Worksheet radio button to have Excel place the table data into a newly inserted blank sheet.
- Click OK.
Excel places the table data into the specified location. But I should tell you that sometimes grabbing the table data might take a few moments. Excel goes to some work to grab and arrange the table information. Figure 2-18 shows worksheet data retrieved from a web page table.
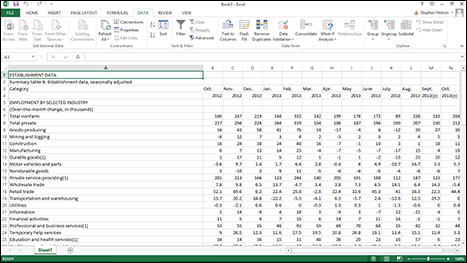
Figure 2-18: Imported worksheet data from a Web page table. You rock, man.
Web query operations don't always work smoothly. In this case, you might want to revisit the web page that displays the table and verify that you clicked the correct select button. The select button, again, is the small yellow button with the arrow that points to the table data.
Importing a database table
Another powerful method for retrieving data from an external data source, such as a database, is to retrieve the information directly from one of a database’s tables. In relational databases, as in Excel, information gets stored in tables.
 To import data from a database table, follow these steps:
- Choose the Data tab’s Get External Data from Access command.
Excel displays the Select Data Source dialog box, as shown in Figure 2-19.
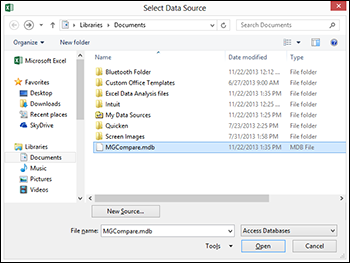
Figure 2-19: The Select Data Source dialog box.
- Identify the folder that stores the database from which you will grab information.
Select the drive and folder where the database is stored using the list boxes provided by the Select Data Source dialog box.
- After you see the database listed in the Select Data Source dialog box, click it and then click Open.
If Excel displays the Select Table dialog box, continue to Step 4.
If Excel doesn’t display the Select Table dialog box but instead displays the Import Data dialog box (see Figure 2-20), skip ahead to Step 5.
- If Excel displays the Select Data Source dialog box, select the table that you want to retrieve information from by clicking it; then click OK.
Excel displays the Import Data dialog box, as shown in Figure 2-20.
- Select either the Existing Worksheet radio button or the New Worksheet radio button to tell Excel where to place the information retrieved from the table.
If you want to place the data in an existing worksheet, use the Existing Worksheet text box to specify the top-left cell that should be filled with data. In other words, specify the first cell into which data should be placed.
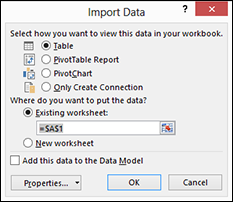
Figure 2-20: The Import Data dialog box.
- Click OK.
Excel retrieves information from the table and places it at the specified worksheet location. Figure 2-21 shows an Excel worksheet with data retrieved from a database table in the manner just described.
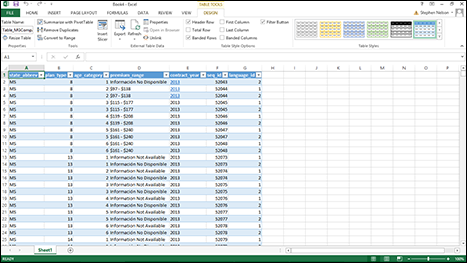
Figure 2-21: An Excel worksheet with imported data.
Querying an external database
Excel provides one other powerful method for retrieving information from external databases. You aren't limited to simply grabbing all the information from a specified table. You can, alternatively, query a database. By querying a database, you retrieve only information from a table that matches your criteria. You can also use a query to combine information from two or more tables. Therefore, use a query to massage and filter the data before it's actually placed in your Excel workbook.
Querying is often the best approach when you want to combine data before importing it and when you need to filter the data before importing it. For example, if you were querying a very large database or very large table — one with hundreds of thousands of records — you would need to run a query in order to reduce the amount of information actually imported into Excel.
Hey, you know what? You can follow along with this discussion even if you don’t have something like an Microsoft Access database handy. Just do an Internet search for a publicly available database like the one you might want to query. For this discussion, for example, I didn’t actually use a real Microsoft Access database. I just grabbed one from U.S. Government’s official www.medicare.gov website.
To run a database query and import query results, follow these steps:
- From the Data tab, choose From Other Sources⇒From Microsoft Query.
Excel displays the Choose Data Source dialog box, as shown in Figure 2-22.
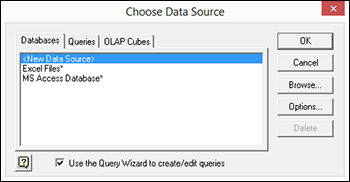
Figure 2-22: The Choose Data Source dialog box.
- Using the Databases tab, identify the type of database that you want to query.
For example, to query a Microsoft Access database, click the MS Access Database entry and then OK.
You can query the results of a query by clicking the Queries tab and then selecting one of the items listed there.You can also query an OLAP cube and grab information from that. If you want to query a query or an OLAP cube, consult with the database administrator. The database administrator can tell you what query or OLAP cube you want to grab data from.
- Select the database.
Excel displays the Select Database dialog box, as shown in Figure 2-23. Use this dialog box to identify both the location and the name of the database that you want to query.
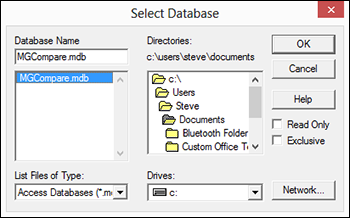
Figure 2-23: The Select Database dialog box.
- Select the database that you want to query from the directories list and then click OK.
Excel displays the Query Wizard - Choose Columns dialog box, as shown in Figure 2-24.
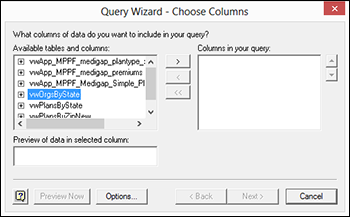
Figure 2-24: The Query Wizard - Choose Columns dialog box.
You use the Query Wizard - Choose Columns dialog box to pick which tables and which table fields you want to appear in your query results. In the Available Tables and Columns box, Excel lists tables and fields. Initially, this list shows only tables, but you can see the fields within a table by clicking the + symbol next to the table.
- When you see a field that you want as a column in your Excel list, click its field and then click the right-facing arrow button that points to the Columns in Your Query list box.
To add all the fields in a table to your list, click the table name and then click the right-facing arrow button that points to the Columns in Your Query list box.
To remove a field, select the field in the Columns in Your Query list box and then click the left-facing arrow button that points to the Available Tables and Columns list box.
This all sounds very complicated, but it really isn’t. Essentially, all you do is to identify the columns of information that you want in your Excel list. Figure 2-25 shows how the Query Wizard - Choose Columns dialog box looks if you want to build a data list that includes information such as the type of plan, the state, and the contract year. (The actual database field names are cryptic, of course.)
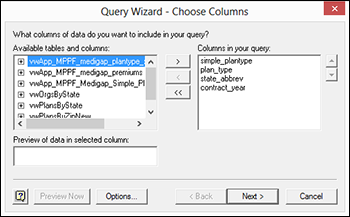
Figure 2-25: The Query Wizard - Choose Columns dialog box query information is defined.
- After you identify which columns you want in your query, click the Next button to filter the query data as needed.
Excel displays the Query Wizard - Filter Data dialog box, as shown in Figure 2-26.
You can filter the data returned as part of your query by using the Only Include Rows Where text boxes. For example, to include only rows in which the state abbreviation field shows CA, click the state_abbrev field in the Column to Filter list box. Then select the Equals filtering operation from the first drop-down list and enter or select the value CA into the second drop-down list; see how this looks in Figure 2-26.
The Query Wizard - Filter Data dialog box performs the same sorts of filtering that you can perform with the AutoFilter command and the Advanced Filter command. Because I discuss these tools in Chapter 1, I won't repeat that discussion here. However, note that you can perform quite sophisticated filtering as part of your query.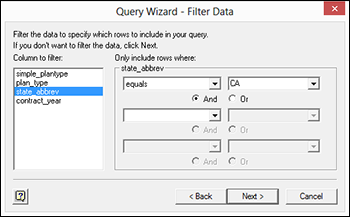
Figure 2-26: The Query Wizard - Filter Data dialog box.
- (Optional) Filter your data based on multiple filters by selecting the And or Or radio buttons.
- And: Using And filters means that for a row to be included, it must meet each of the filter requirements.
- Or: Using Or filters means that if a row meets any filtered condition, the row is included.
- Click Next.
Excel displays the Query Wizard - Sort Order dialog box, as shown in Figure 2-27.
- Choose a sort order for the query result data from the Query Wizard - Sort Order dialog box.
Select the field or column that you want to use for sorting from the Sort By drop-down list. By selecting either the Ascending or Descending radio button, choose whether the field should be arranged in an ascending or descending order, respectively.
You can also use additional sort keys by selecting fields in the first and second Then By drop-down lists.
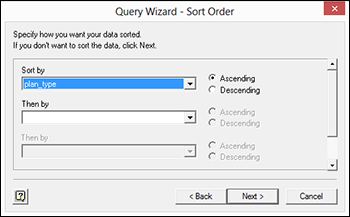
Figure 2-27: The Query Wizard - Sort Order dialog box.
You sort query results the same way that you sort rows in an Excel table. If you have more questions about how to sort rows, refer to Chapter 1. Sorting works the same whether you’re talking about query results or rows in a list. - Click Next.
Excel displays the Query Wizard - Finish dialog box, as shown in Figure 2-28.
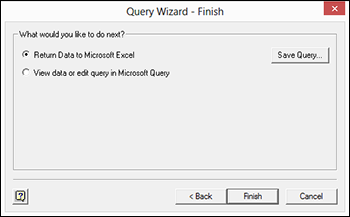
Figure 2-28: The Query Wizard - Finish dialog box.
- In the Query Wizard - Finish dialog box, specify where Excel should place the query results.
This dialog box provides radio buttons, from which you choose where you want to place your query result data: in Excel, in a Microsoft Query window that you can then review, or in an OLAP cube. Typically (and this is what I assume here in this book), you simply want to return the data to Microsoft Excel and place the data in a workbook. To make this choice, select the Return Data to Microsoft Office Excel radio button.
- Click the Finish button.
After you click the Finish button to complete the Query Wizard, Excel displays the Import Data dialog box; refer to Figure 2-20.
- In the Import Data dialog box, choose the worksheet location for the query result data.
Use this dialog box to specify where query result data should be placed.
- To place the query result data in an existing worksheet, select the Existing Worksheet radio button. Then identify the cell in the top-left corner of the worksheet range and enter this in the Existing Worksheet text box.
- Alternatively, to place the data into a new worksheet, select the New Worksheet radio button.
- Click OK.
Excel places the data at the location that you chose.
It's Sometimes a Raw Deal
By using the instructions that I describe in this chapter to retrieve data from some external source, you can probably get the data rather quickly into an Excel workbook. But it’s possible that you've also found that the data is pretty raw. And so you are saying to yourself (or at least if I were in your shoes, I would be saying this), “Wow, this stuff is pretty raw.”
But don't worry: You are where you need to be. It’s okay for your information to be raw at this point. In Chapter 3, I discuss how you clean up the workbook by eliminating rows and columns and information that’s not part of your data. I also cover how you scrub and rearrange the actual data in your workbook so that it appears in a format and structure that’s useful to you in your upcoming analysis.
The bottom line is this: Don't worry that your data seems pretty raw right now. Getting your data into a workbook accomplishes an important step. All you need to do now is spend a little time on your housekeeping. Read through the next chapter for the lowdown on how to do that.
By the way, if the process of importing data from some external source has resulted in very clean and pristine data — and this might be the case if you've grabbed data from a well-designed database or with help from the corporate database administrator — that's great. You can jump right into the data analysis techniques that I start describing in Chapter 4.