
CHAPTER 1
Introduction to Short-Selling
Reduced to its mechanics, short-selling is simply the act of identifying a change of trend in a stock from up to down and then seeking to profit from that change of trend as one rides the stock to the downside. To do this, the investor or trader sells the stock in question while not actually owning it, e.g., being “short” the stock, and pockets the proceeds of the sale with the idea of buying the stock back later at a lower price as the downtrend takes hold and extends to the downside. To go short, the seller must first borrow the stock from her broker and may have to pay a very small fee to do so. If and when the stock drops in price, the seller then repurchases the shares, “covering” her short position for less than she sold them, returning the borrowed securities and pocketing the difference. This is, of course, not a risk-free proposition, as the short-seller may also end up owing the difference if the stock rises in price and the cost of buying back those shares exceeds the proceeds they pocketed at the time of the initial short-sale. Because stocks can theoretically rise to infinity, while their decline is finite given that a stock price cannot go below zero, or 100 percent of its current value, then the potential losses a short-seller faces are unlimited. Of course, this assumes that a short-seller is operating without a stop-loss that provides a clear point at which the short-sale would be covered and the trade closed out at a loss, hopefully a small one.
To some, short-selling represents the “dark side” of the market, and history has often characterized the art of selling short as an evil enterprise, embodying a conspiratorial or pessimistic frame of mind that fixates on the negative. Consider that during the Great Crash of 1929, Jesse Livermore made $100 million in 1929 dollars, an astronomical sum at that time, by short-selling stocks during this severe market downturn. When this was later disclosed to the public, Livermore was the subject of extreme public outrage, even to the point where his short-selling activities were blamed as part of the cause of the great crash. In reality, Livermore merely observed and acted upon the market facts as they became apparent. The true cause of the Crash of 1929 was the fact that everyone had piled into the market and there was nobody left to buy stocks at that point. As well, paltry 10 percent margin requirements allowed investors to buy $100 worth of stock with only $10 in their pocket, creating a massive asset bubble and the optimal conditions for a rapid and destructive popping of that bubble.
Thus stocks find their value given the circumstances, and short-sellers can act as a catalyst to help stocks reach their true value faster than they might without any short-sellers. Supply–demand mechanics have shown time and time again that even when short-sellers pile onto stocks as they did the dot.coms, such as Amazon.com (AMZN) in the early 2000s, their short-selling has no long-term effect on depressing price if the perceived value of the stock continues to be higher than where the stock is currently trading.
Nevertheless, during the earlier existence of the United States, short-selling was in fact banned because of the inherent instability of the then very young country's fragile markets, mostly thanks to speculation surrounding the outcome of the War of 1812. It was not until 1850 that the short-selling ban was repealed. More recently, in 2008, government officials banned the short-selling of certain financial stocks that had come under pressure as a result of severe, even deadly, liquidity issues related to having swarms of bad mortgages held on their books. Excesses in the mortgage industry, fostered by government subsidies and policies that forced and/or allowed banks to lower their lending standards in order make home loans to low-income consumer borrowers who had no means of paying back the loans, created a housing bubble as demand for homes was artificially spiked, sending real estate prices soaring. These low-quality mortgages were in turn repackaged into bundles known as mortgage-backed securities (MBS), and the structure of these MBSs magically enabled them to be rated Triple-A by the credit-rating agencies such as Standard & Poor's and Moody's. With Triple-A ratings, such mortgage-backed securities were eagerly purchased by investors, ending up en masse on the books of a large number of financial institutions as well as in the portfolios of many institutional and retail investors. When the real estate bubble finally popped in 2008, these loans went bad, sending the institutions that had many of these mortgages on their books into insolvency.
In keeping with the fact that history often rhymes with the present, government officials attempted to deflect part of the blame for the financial crisis of 2008 onto short-sellers who were accused of the predatory practice of “naked” short-selling as they swarmed vulnerable financial stocks on the short side and helped to drive their prices lower. Forget the fact that short-sellers were doing little more than what smart speculators do in the first place, which is to identify a potential or emerging trend and to then capitalize on it by investing in the direction of that trend. The excesses of the mortgage and housing industries by 2008 deserved to be exposed for the frauds that they were, and short-sellers were simply part of that process of exposure and “cleansing.” As well, investors who were foolish enough to buy the stocks of financial companies on the way down did not heed what the trend was telling them. Obviously, anyone who understood what was going on knew that the only logical endpoint for the excesses of the housing and mortgage industry and the resulting insolvencies that it produced once the bubble popped was bankruptcy. And that is precisely what happened to venerable financial institutions like Lehman Brothers, Merrill Lynch, and Bear Stearns, which went belly-up or were absorbed by other financial companies.
Aggressive short-selling was alleged by regulators to have played a role in the demise of both Lehman Brothers and Bear Stearns, but the fact is that the insolvency of the financial system in 2008 was real, and true insolvency leads to bankruptcy, whether the stock is a favorite target of short-sellers or not. Without the Fed stepping in to flood the system with unprecedented amounts of liquidity using unprecedented systemic schemes collectively known as quantitative easing, or QE for short, more such financial institutions would have suffered the same fate as Lehman Brothers and Bear Stearns. Ultimately, the Financial Accounting Standards Board (FASB) would also step in to aid the Fed's QE propping by changing Rule 157, otherwise known as the “mark-to-market rule,” which required financial institutions to value their assets at fair market value. By allowing banks and other financial institutions to value their bad mortgages at whatever they wanted to rather than what they were in fact worth, further insolvencies in the system were avoided, at least temporarily and on paper.
What is interesting to observe is that the government's creation of an entirely artificial force to prop up and stimulate a reversal in the deleterious downtrend of the financial sector stocks is accepted as a legitimate way to influence stock prices, but the actions of short-sellers are seen as an unnatural and evil influence. We would argue that short-selling is a natural part of the process that defines the life-cycles of all stocks as they benefit from growth and the ensuing speculative excess on the upside, but at some point must go through a process of correction and downside price movement that clears the decks, so to speak, and either helps to build a foundation for a new uptrend and cycle of growth or results in a final and complete demise of a company that is no longer able to compete in its core industry. In a sense, the demise of older companies also helps to foster new growth cycles in that the way is cleared for newer, more innovative companies to supplant the older, slower, and larger companies that have lost their innovative and, hence, competitive edge. Short-selling, at its core, is nothing less than the investment manifestation of the virtuous cycle of creation and destruction, as well as the periodic need to cleanse excesses from the system that is the hallmark of an entrepreneurial economy.
As a very instructive and current example, one need look no further than the financial crisis of 2008 and the market events that led up to it. The reality is that the financial crisis of 2008 and the severe bear market that accompanied it actually began well before it reached full-blown crisis proportions between September 2008 and April 2009. It began quietly with the topping of home-building stocks in July of 2005. Recall that the financial crisis was a function of a mortgage crisis based on the promotion and writing of ridiculously risky home loans by banks and other home-lending institutions. The lowering of lending standards in turn fueled what was really a ballooning artificial demand for houses, and this heroin-induced rush of home buying drove home prices higher, spurring a homebuilding boom that manifested in the stock market as a strong uptrend in the prices of homebuilding and building-related stocks from 2000–2005. While the demand for housing reached a crescendo in 2006–2007, homebuilding stocks had already begun to top, as the charts of two separate homebuilding stocks, Toll Brothers (TOL) and Pulte Group (PHM) (Figures 1.1 and 1.2) show.

FIGURE 1.1 Toll Brothers (TOL) weekly chart, 2003–2006. Luxury homebuilder TOL topped in July of 2005 with the rest of the homebuilding stocks, presaging the coming housing and mortgage crisis that would shake the financial market three years later.
Source: Chart courtesy of HGSI Investment Software, LLC (www.highgrowthstock.com), ©2014.

FIGURE 1.2 Pulte Group (PHM) weekly chart, 2003–2007. This builder of single-family homes, townhouses, condominiums, and duplexes in 28 states had a nearly tenfold price move from 2000 to midsummer 2005.
Source: Chart courtesy of HGSI Investment Software, LLC (www.highgrowthstock.com), ©2014.
Homebuilding stocks to a large extent represented the point at which the rubber meets the road for the financial crisis as the consumer “end-product” of the housing stimulus, provided by an extremely low interest rate environment and lax lending standards both mandated and promoted by government policies that were readily embraced by the home-loan industry. As more and more consumers purchased homes they could not afford, eventually the chickens began to come home to roost as the reality of making loan payments took hold. The stock market, in its inimitable ability to foresee and begin discounting the future, saw this coming, and when the homebuilding stocks topped, they represented the first warning shot across the bow for the homebuilding industry at large, including the financiers and suppliers that both fed it and fed off of it. In this manner, the top in homebuilding stocks represented stage one of the impending financial crisis.
The great bear market of 2007–2009 officially started when the major market indexes topped in October 2007. Figure 1.3 shows the NASDAQ Composite Index topping in late October 2007 and then moving sideways for six weeks before breaking down further in January of 2008. The observant reader might also note that around this time the NASDAQ Composite had formed something of a “head and shoulders” top formation, a pattern that we will examine in detail later on in this book.

FIGURE 1.3 NASDAQ Composite Index, weekly chart 2006–2009. The general stock market, as represented by the NASDAQ Composite Index, tops in late October 2007.
Source: Chart courtesy of HGSI Investment Software, LLC (www.highgrowthstock.com), ©2014.
While the general market did not top until October of 2007, we have already observed that the homebuilding stocks topped in July of 2005, more than two years prior to the general market top in 2007. That was the first warning shot across the bow, but the second warning shot took place in the financial stocks themselves when they began to top in May of 2007, preceding the general market top by exactly five months. The chart of the Financial Select Sector SPDR (XLF), shown on a weekly chart in Figure 1.4, shows a classic head and shoulders topping formation around the peak in May 2007.
The breakdown in the peak off the top in the financial sector constituting the first down leg in the XLF took place from May to August, at which point the XLF rallied twice back up to its 40-week moving average. As financials led the downturn off the peak in May 2007, the period from August to October produced volatile reaction rallies and bounces in the group as a number of other leading groups, including solar energy stocks like First Solar (FSLR), shown in Figure 1.5, and Sunpower Corp. (SPWR), and technology stocks like Apple (AAPL), shown in Figure 1.6, and Baidu (BIDU) continued to rally well past the general market top in October 2007 and into late December 2007 and early January 2008.
So as the general market was continuing to move higher from May to October, the financials were trying to bounce and rally with the market, but this action only served to create a right shoulder in an overall head and shoulders top in the XLF, which then broke down in synchrony with the actual general market top in October 2007, as illustrated by the weekly chart of the XLF in Figure 1.4. Once the general market topped in October 2007, the other areas of leadership during the bull phase started to top over the next few months as a final wave of topping leaders took hold in early 2008, resulting in the second leg down off the peak in the NASDAQ Composite Index in January 2008, as can be seen in Figure 1.3.

FIGURE 1.4 The financial sector, as measured by the Financial Select Sector SPDR (XLF) ETF, tops in May of 2007, well before the general market indexes and long before the actual financial crisis took hold in the fall of 2008.
Source: Chart courtesy of HGSI Investment Software, LLC (www.highgrowthstock.com), ©2014.
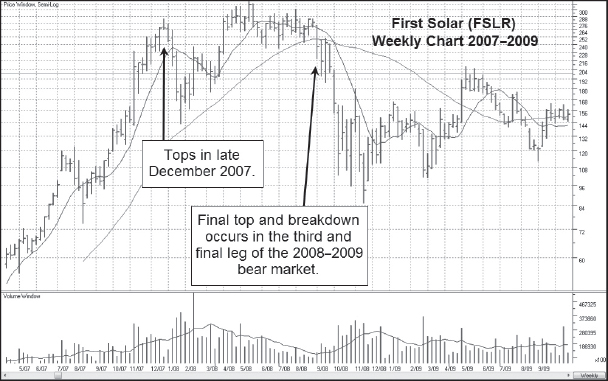
FIGURE 1.5 First Solar (FSLR) weekly chart, 2007–2008. Notice that FSLR initially tops out in late December 2007, and is then able to rally back to new highs when the general market stages a reaction rally and puts in a final top later in 2008, as the third and final leg of the 2008–2009 bear market takes hold.
Source: Chart courtesy of HGSI Investment Software, LLC (www.highgrowthstock.com), ©2014.

FIGURE 1.6 Apple (AAPL) weekly chart, 2007–2008. Notice that AAPL does not top out until early January 2008, over two months after the general market tops.
Source: Chart courtesy of HGSI Investment Software, LLC (www.highgrowthstock.com), ©2014.
The lesson here is that bear markets and the short-selling opportunities they present are thematic, unfolding events that reflect what is going on in the general economy—essentially, the “underlying conditions” that the great trader Jesse Livermore described as the backdrop of any market trend, whether bull or bear. Before the bear market becomes obvious to everyone, including government officials, stocks are already starting to top in waves, as money that had moved in during the uptrend now seeks to exit the market and leading stocks. This is a natural process and is in no way, shape, or form something that is artificially created by short-sellers.
Very real excesses build up in any bull market phase, which is often propelled by underlying growth in specific areas of the economy. In the early- to mid-1990s we saw a strong bull phase that was generated by strong growth in the technology area, specifically semiconductors and related computer technology, as the PC boom took root. In the late 1990s it was growth in the potential and profitability of the Internet that drove the wild dot.com boom, which in turn drove a parabolic bull market. In the mid-2000s, the bull market that ended in October 2007 was helped along by a housing bubble that resulted from excesses in easy money policies. Easy money policies by the Fed also served to sharply devalue the U.S. dollar, leading to huge growth in the prices of “stuff” stocks—companies that mined or produced basic materials such as steel, precious metals, fertilizers, coal, and building materials.
The ensuing bear markets are nothing more than the natural clearing out of excesses that were built up in the prior bull phases as winners and losers are sorted out and the foundation is laid for the next growth phase. Short-sellers are merely smart investors who can recognize a change in trend in the general market and leading stocks and profit thereby. If the stock market is accepted by all as a way to build wealth, why shouldn't investors also be able to take action to protect that wealth during a bear market, and even seek to further build that wealth by profiting on the short side? In our view, short-selling is as American as baseball, Mom, and apple pie.
 How Not to Sell Stocks Short
This book will explain in detail how we sell stocks short, and before we get started, it might be worthwhile to discuss how we DO NOT sell stocks short.
Often times we hear of a prominent hedge fund manager who goes on financial cable TV and declares a certain high-flying stock to be the beneficiary of nothing more than irrational, speculative fever on the part of mindless, lemming-like investors. Generally this hedge fund manager is a graduate of what we like to refer to as the University of “I-Am-Smarter-than-the-Market.” As such, he or she is one who is “smarter” than the mass of investors who get carried away with the “hype” surrounding a given “hot stock” and thereby sees fit to declare that the fundamentals of the company in question “do not justify” its often-high and going-higher stock price.
High-flying stocks that have attracted more than their fair share of naysayers who consider the stocks’ ever-rising prices as representative of a sort of moral infirmity among investors have in recent years included great companies like Netflix (NFLX), Tesla Motors (TSLA), and 3D Systems (DDD), for example. Getting up on financial cable TV and declaring investors in such stocks to be misguided doesn't win one a lot of fans, and because most of these hedge fund managers try to short these stocks on the way up, they generally end up looking stupid before they start looking smart, as the basic axiom of investing, essentially that the trend is your friend, often persists, even when it comes to allegedly overvalued stocks. Trying to short a stock based on the fact that it is overvalued ignores basic stock market reality when it comes to P/E ratios in leading stocks and seems to stand in the way of the dominant upside technical trend. Countless numbers of high-flying stocks over the years have been downgraded by analysts on the basis of being overvalued. This was especially true in the late 1990s with so many dot.com stocks reaching dizzying heights in price despite being downgraded a number of times by analysts.
Netflix (NFLX) is a more recent example of such a phenomenon, as it endured the wrath of a couple of very vocal “valuation” short-sellers all the way up during the incredible price run it had from early 2009 to mid-2011. Valuation short-sellers are those who believe a stock's price is going to go down because its price-to-earnings ratio, or P/E, is far too high. In December of 2010, a hedge fund manager we will simply refer to as “W” wrote an article in a prominent investment blog discussing the reasons why he was selling NFLX short. The day that article appeared, NFLX closed at a price of $181.65 a share. Within seven months the stock price hit an all-time high of $304.79, not too long after “W” had revealed that his fund had covered its short-sale position, unable to withstand the pain of the losses its NFLX short position generated as the stock ground its way higher, as can be seen in Figure 1.7.
W's primary reason, his only reason in fact, for shorting NFLX was that its P/E was “too high” and that the company's business model could not possibly generate the revenues and profits such a valuation implies. This, of course, ignores the fact that a P/E ratio is less a measure of static value and more a measure of the marketplace's current assessment of a company's forward earnings stream. If one objectively studies the price/volume action of leading stocks that have huge price moves, one quickly realizes that during these massive upside price runs the P/Es of these stocks actually expand, often to 100 or more times the current earnings. Price strength often begets further price strength, thus stocks and even markets themselves often go far higher than most analysts expect.

FIGURE 1.7 Netflix (NFLX) weekly chart, 2009–2011. There was a time to be long NFLX and a time to be short NFLX. Self-proclaimed graduates of the University of “I-Am-Smarter-than-the-Market” had trouble identifying either.
Source: Chart courtesy of HGSI Investment Software, LLC (www.highgrowthstock.com), ©2014.
Individuals like these are seen as “negative nellies” who fail to understand the dynamic nature of the U.S. stock market and the essential direction of money flows into and out of leading stocks during their life cycles. It's one thing to walk into a clothing store and declare a pair of jeans with holes in the knees to be grossly defective and hence not worth the price tag; it's quite another to recognize the contextual fact that sometimes jeans with holes in them represent the hottest, cutting-edge fashion statement that every style-minded consumer must make at any price. And so it is with stocks.
In our view, these valuation short-sellers give short-selling a bad name. They want to think negatively about a situation that is being viewed positively by investors who see the stock market as a realm of opportunity and possibilities. As well, valuation short-sellers ignore the psychological nature of the markets, and the inherently dynamic potential, often unknowable in precise terms before the fact, of an emerging-industry business model that can only be sorted out in advance by the “mass mind” of the stock market, e.g., millions of investors making real-time decisions with real money based on their best real-time knowledge and forward assessments.
To illustrate this idea, take the example of Apple (AAPL) in 2004 after it had come out with the iPod, ostensibly, as some argued at the time, an mp3 player “in drag” and nothing more. But the iPod product, fathered along by the genius of one Steve Jobs, would provide the platform for even more massive-selling products like the iPhone, which truly revolutionized the smartphone, and the iPad, which turned the PC on its head, over the next several years. The point is that stock market opportunities are dynamic and evolve as more and more investors begin to see the potential of a company's product platform and its role within a potentially huge emerging market for those products. Such was the case with Apple.
Eventually, however, there came a time to sell Apple short, but only when the stock's strong uptrend had finally reversed itself as everybody who was going to be in the stock eventually was. This left only one direction for money flows in the stock to begin moving, and that was out. “Pile in, pile out” was a critical phenomenon that was readily observed in the institutional fund ownership data for Apple as it finally topped and rolled over.
Another entirely underestimated company and investment opportunity that serves as an added example is the highly innovative electric car maker Tesla Motors (TSLA), shown on a weekly chart in Figure 1.8. In May of 2012, we notified our subscribers of a “buyable gap-up” in the stock in the mid-60 price range at what was roughly the start of a robust upside price run that eventually carried above 290 by the summer of 2014. At the time we also saw Tesla Motors as being similar to General Motors (GM) in 1915 when the stock of that future “big three” U.S. automaker began its own significant post-IPO price move. In the same manner that Tesla was bringing style and power to the otherwise mundane and utilitarian-oriented electric vehicle market in 2013, General Motors had introduced a mass-produced V-8 combustion engine that enabled the fledgling auto concern to bring style and power to the mainstream and help to accelerate the popularization of the automobile. Like Tesla in 2013, General Motors in 1915 was a recent IPO, having come public in 1911. Also like Tesla in 2013, General Motors in 1915 had been moving in a big, sideways consolidation for about 2.5 years before breaking out and initiating a massive upside price move. Thus we saw a historical “precedent” for what was going on with Tesla Motors based on the theme of a new company pushing the envelope of an emerging industry, in this case electric vehicles in 2013 as compared to what General Motors was doing with the combustion engine as it was pushing the envelope of the auto industry in 1915.

FIGURE 1.8 Tesla Motors (TSLA) weekly chart, 2012–2014. The emotional rants of the “Tesla bears” only seemed to propel the stock higher as short interest in the stock remained high all the way up through the $200 price level.
Source: Chart courtesy of HGSI Investment Software, LLC (www.highgrowthstock.com), ©2014.
Despite the fact that Tesla was selling at 100 times forward earnings estimates at the time, it was still able to generate a huge upside price move that began at the point where we first bought the stock, essentially in the mid-60 price area, in early May of 2013. Considering that it is not uncommon for such a “ridiculously high P/E” to attract short-sellers who consider themselves to be smarter than the market, Tesla quickly became a popular target of short-sellers hell-bent on seeing “foolish” buyers of the stock punished. In the end it was the short-sellers who were foolish and who suffered a brutal but still self-inflicted punishment. After all, a basic reality of the stock market is that a young, new, dynamic company with game-changing technology and a cutting-edge approach can often sell at 100 times forward estimates or more at the very point where it begins a huge upside price run. This has been seen time and time again with stocks like eBay (EBAY) and Amazon.com (AMZN) in 1998, Salesforce.com (CRM) from 2009–2010, or even Taser International (TASR) in 2003 when it had no earnings to speak of and hence an “infinite” P/E yet still was at the cusp of a nearly twenty-seven-fold price move over the next nine months! Such was the case with Tesla Motors in 2013. As we wrote in an article for Forbes.com in early June 2013, “What the GM example tells us is that maybe there will be more to this price move in TSLA than currently meets the eye, and investors should remain open to whatever the stock's future price/volume action tells us and not rely on simple-minded valuation analysis that can often cause investors to miss huge stock market opportunities.”
One reader commented in the article's blog section (remember that TSLA stock was around $90 at the time), “What about us who are short above $100? How dare you compare TSLA to GM in 1915!!! Now I know the longs are like cult members.” This sort of comment is typical of valuation short-sellers who, as a result of their graduate degrees from the University of “I-Am-Smarter-Than-the-Market,” believe they possess superior abilities and knowledge that they express by denigrating those who buy and profit from strongly trending stocks as “cult members.”
The mind-set of short-sellers like these is fraught with emotion, and at times it appears that their investment methodology in such a situation is born more of indignation than of any intelligent assessment of the trend and the stock's potential. Tesla Motors (TSLA) eventually moved higher than $290 a share as of the time of this writing, and so our answer to the individual who commented “What about us who are short above $100?” is that we hope they were smart enough to cover their positions once the stock rallied well past the $100 price level. In our experience, however, such individuals simply become even more indignant and continue to short the stock on the way up as they go bust.
When you argue against stocks like Apple, Netflix, Tesla, or 3-D Systems, you are arguing against the virtuous system of entrepreneurial capitalism that embraces the freedom, nobility, humanity, and shining promise of new ideas, new ways of thinking, positive change, and new products and services that enable people of all socioeconomic stages to improve their productivity, their leisure enjoyment, and ultimately their standard of living, and that is, well, downright un-American! Thus one facet of the dark side of short-selling is revealed, but in fact we see it more as the dumb side of short-selling by those who consider themselves as graduates of the University of “I-Am-Smarter-Than-the-Market.”
In our view, short-selling is nothing more than a method of investing and trading that recognizes the life-cycle paradigm arising from an economic system that thrives on creative destruction. A major component of that creative destruction is the process of cleaning out prior excesses and forcing the redeployment of capital to more productive areas of the economy. The quicker that process is able to cycle through the system, the better. Stocks, like people, have life spans. Unlike people, however, they can have more than one life span, providing opportunities on both the long and short sides depending on which side of the creation/destruction cycle they are in. Great companies like Apple can experience periods of tremendous growth that fuel a higher stock price, followed by periods of contraction as they become obsolescent and lose their competitive edge. During such a period, the price of the company's stock shares declines as it should. But great companies like Apple also adapt and respond by coming up with new ideas and new products to regain that edge and generate a new cycle of tremendous sales and earnings growth, which in turn fuels a higher stock price once again. In such a manner, a strong, adaptive, and innovative company can be born and reborn many times.
Investing and trading is about making money by profiting on the price movement of stocks and other securities. Short-selling is simply one component of smart investment and money management. Preserving gains is crucial in optimizing the performance of one's investments over the long term, and short-selling serves as a way to either profit outright or to help offset declines in other stocks that make up the positions in a portfolio with more of an intermediate- to long-term investment horizon during a bear market. The study and practice of short-selling not only provides investors with a useful arrow to keep in their quiver of investment skills, but it also aids in developing one's skill and understanding with respect to when to sell long positions in leading stocks when they have finally reached the end of their upside life cycle.