Chapter 7
Report Quality
In Chapter 3, we identified company adoption of integrated reporting as the key indicator of momentum. In Chapter 2, however, we also discussed the difference between a “combined report” and a truly “integrated” report. In Chapter 6, we described how greenwashing occurs when companies are insufficiently disciplined in their development of what we call the Sustainable Value Matrix (SVM). It is not solely the absolute number of companies practicing integrated reporting, but the quality of adoption that matters. How thorough and comparable these integrated reports are begins with the quality of frameworks for integrated reporting and standards for reporting on nonfinancial information. Although companies may achieve a truly integrated report by other means, the effectiveness with which they apply these frameworks and standards will determine how useful these reports are to investors.
To assess report quality, we analyzed 124 listed companies' self-declared integrated reports in the context of the “Consultation Draft of The International <IR> Framework” (Consultation Draft), published in July 2013.1 Sourced from Global Reporting Initiative (GRI) website via its “Sustainability Disclosure Database” on October 17, 2013, 100 were English-language reports of the 135 non-South African companies that had made this declaration. To these, we added the reports of the largest 24 South African listed companies by revenue. The analysis team began its work on October 8, 2013, and completed it on March 14, 2014. During that period, the team held numerous conference calls to discuss the research and analysis. Over 400 hours were spent coding the data template for each of these 124 reports, with an additional 500 hours spent aggregating and analyzing these data.2
While it may seem counterintuitive to use a framework that did not exist at the time of report preparation to analyze reports, this approach allows us to gauge whether, even at this early stage of the movement, companies were intuitively following the principles of integrated reporting as articulated in December 2013's “The International <IR> Framework” (<IR> Framework). If company practice matches the framework's suggestions, it both validates the framework and suggests that it is not unreasonably difficult to apply.3
In comparing company reports with the Consultation Draft, scoring was done based on its seven Content Elements, its Six Capitals, and seven Special Factors, for a total of 20 factors. Each factor was scored from 0 (lowest) to 3 (highest), meaning the maximum score a report could receive was 60. Sub-scores were calculated for each of the Content Elements, Six Capitals, and Special Factors. While some degree of subjectivity is inevitable in scoring narrative data, numerous steps were taken to ensure that the coding was done as consistently and reliably as possible across reports and coders. Appendix 7A contains a full explanation of the methodology used.
We had no expectations of report quality prior to our analysis, but the results pleasantly surprised us. With admittedly substantial variation, these 100 companies were, on average, doing a fair job. The 24 South African companies fared noticeably better, likely due to the fact that they had at least two years of experience producing an integrated report thanks to King III and the Integrated Reporting Committee of South Africa's 2011 Discussion Paper (IRC of SA Discussion Paper), and that, because of these pushes, they had been learning how to improve based on audience feedback and observing practices of other companies. However, some areas of noticeable weakness appeared in both samples. Discussed below, these included outlook in the Content Elements and materiality, connectivity of information, and stakeholder engagement in Special Factors.
The Six Capitals
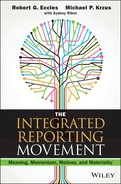
The <IR> Framework places great emphasis from both an integrated reporting and integrated thinking perspective on how companies use the six capitals (financial, manufactured, natural, human, intellectual, and social and relationship) “to create value over the short, medium and long term.”4 Although previously discussed in Chapter 2, this is illustrated again in Figure 7.1.5
Figure 7.1 “The International <IR> Framework” Value Creation Process
Source: International Integrated Reporting Council. “The International <IR> Framework,”p. 13, http://www.theiirc.org/international-ir-framework/, accessed April 2014.
For all six capitals, the average score for the 124 companies was 2.0, with 25 of them receiving a 3 on all six capitals. For each capital, a majority of the companies received a 2 or 3 rating: financial (85.5%), manufactured (67.7%), natural (82.2%), human (83.1%), intellectual (71.8%), and social and relationship (80.7%). South African companies averaged 2.3, while the average score for the other companies was 2.0. We consider the disclosures made by CEMIG,6 Lassila & Tikanoja,7 Singapore Stock Exchange,8 Inditex,9 Telekom Slovenije,10 and AngloGold Ashanti11 to be excellent examples of reporting on each of the capitals.
There was not a great deal of variation in the average score by type of capital—a range of .33 from lowest to highest (Figure 7.2). Likely due to the fact that 17 of these companies were in financial services, manufactured capital received the lowest (1.83) score. It is simply not relevant for the sector. Human capital and natural capital received the highest scores at 2.16 and 2.15, respectively, suggesting that most companies see them as important to their value creation process.12 Intellectual capital also ranked low (1.93). Although admittedly difficult to measure, the same is true for human capital, suggesting that many companies did not see it as an important capital.
Figure 7.2 Average Score by Capital
With a total average of 2.29 vs. 1.98 for the rest of the sample, South African companies scored higher on all six capitals. The difference was especially large for manufactured (2.29 vs. 1.72) and intellectual capital (2.29 vs. 1.84). The former is a result of a high percentage of South African companies (54%) relying on manufactured capital due to the fact that they operate in the energy, food and beverage, metal products, mining, pharmaceutical, and telecommunications sectors.13
Content Elements
The average score for the seven content elements we evaluated was 2.1, about the same as for the six capitals, with 25 companies receiving a 3 on all seven. Again, a majority of companies received a 2 or 3 rating for each content element: organizational overview and external environment (86.3%), governance (83.1%), risks and opportunities (71.8%), strategy and resource allocation (78.2%), business model (78.2%), performance (86.3%), and outlook (71.8%). We consider the disclosures made by Banco do Brasil,14 Umicore,15 Kumba Iron Ore,16 Aviva,17 BAE Systems,18 Société Générale de Surveillance,19 and Syngenta20 to be excellent examples of reporting on each of the content elements.
In the average score by content element, a difference of .30 from lowest to highest (Figure 7.3), little variation was noted. Opportunities and risks (2.03) and future outlook (1.93) were the two lowest scores. These low scores may indicate the inherent lack of clarity in discussing future-oriented issues and the accompanying anxiety companies have in doing so—especially in litigious environments.
Figure 7.3 Average Score by Content Element
South African companies scored higher on all content elements. With a total average of 2.35 vs. 2.06 for the rest of the sample (a difference similar to that of the scores on capitals), governance (2.50 vs. 2.11) had the highest score, virtually tied with organizational overview and external environment (2.46). Given how integrated reporting in South Africa came out of the King III code for corporate governance, the governance score is not surprising. Even in South African companies' two lowest-scoring elements, risks and opportunities (2.29 vs. 1.97) and outlook (2.21 vs. 1.86), their absolute score was still higher than that of the other sample.
When we supplemented this simple quantitative analysis by comparing the intention in the <IR> Framework with the patterns we saw in company practice, we found that even when the company described a particular content element in a fulsome way, the information was often scattered throughout many different parts of the report. Terminological inconsistencies were also rife. Thus, while companies received fairly high scores by each factor on average, nearly all of these reports needed substantial improvement in terms of the <IR> Framework's Guiding Principles on the connectivity of information and report presentation:
The connectivity of information and the overall usefulness of an integrated report is enhanced when it is logically structured, well presented, written in clear, understandable and jargon-free language, and includes effective navigation devices, such as clearly delineated (but linked) sections and cross-referencing. In this context, information and communication technology can be used to improve the ability to search, access, combine, connect, customize, re-use or analyse information.21
While a small number of the reports we studied were “logically structured, well presented, written in clear, understandable and jargon-free language,” very few succeeded in providing “effective navigation devices, such as clearly delineated (but linked) sections and cross-referencing.” Almost none used information and communication technology “to improve the ability to search, access, combine, connect, customize, re-use or analyse information.” As a result, deciphering how “the pieces fit together” in these integrated reports required more energy than necessary.
Organizational Overview and External Environment
While the <IR> Framework asks, “What does the organization do, and what are the circumstances under which it operates?”22 and explains what the answer to this question should include, it intentionally does not prescribe a format for the report.23 We found no consistent approach in how companies provided this information. It was often mixed with other content elements, like business model and/or performance-related information like financial results, which in some cases were about financial capital. Moreover, when an organizational overview was provided, it appeared in different places. For example, the company might include a link in its online integrated report to another part of the company's website—such as “Corporate Profile,” “Who We Are,” “About Us,” or a “snapshot”—where the user would still have to search for the information of interest.
Governance
The <IR> Framework asks, “How does the organization's governance structure support its ability to create value in the short, medium and long term?”24 In contrast to organizational overview, most companies discussed governance in a single, well-defined section of their report. This is likely due to the fact that most countries have codes and regulations regarding corporate governance that define it as a topic. Nevertheless, we found substantial variation in how companies treated the issue. Some used very lengthy sections of their report—dozens of pages—providing many details about the various elements of corporate governance, such as executive compensation. Longer sections sometimes contained discussions about risk but usually did not address those risks that come from pursuing opportunities. Other companies had very short sections with little detail. Many factors explain this variation in length, from the impact of mandated reporting requirements, companies taking a compliance-only, tick-the-box approach, and simply not knowing how best to discuss this element. Rarely did this discussion explicitly include time frames.
Business Model
The <IR> Framework asks, “What is the organization's business model?”25 As depicted in Figure 7.1, how the organization creates value over the short-, medium-, and long-term is at the core of the <IR> Framework. The <IR> Framework emphasizes that effectiveness and readability can be enhanced by explicit identification of its key elements, a simple diagram with accompanying explanation of these elements' relevance to the organization,26 a narrative flow that is logical given the particular circumstances of the organization, and identification of critical stakeholder dependencies and important factors affecting the external environment.27
As a Guiding Principle, most business model discussions would benefit from increased “connectivity of information.” While some companies combined the description of their business model with a discussion of performance, we did not find a single case in which the company explicitly defined the relationship between its business model and short-, medium-, and long-term value creation. As with governance, we noted substantial variation in the depth with which companies discussed their business model, although we did not find a single example in which a company used the <IR> Framework's recommended features for enhancing effectiveness and readability. Even at the business unit level, some had detailed descriptions that included a discussion of the company's market and strategy, and how the capitals were used in the resource allocation process. Rarely, however, did a company explicitly link the capitals to the capital input/activities/output/capital impact process.
Risks and Opportunities
The <IR> Framework asks, “What are the specific risks and opportunities that affect the organization's ability to create value over the short, medium and long term, and how is the organization dealing with them?”28 Relevant risks and opportunities are those that affect the availability, quality, and affordability of the capitals the company needs to create value over different time frames.29 A comprehensive discussion about either risks or opportunities was rare in the reports we analyzed. On the whole, the discussion was even more scattered in the report, especially for opportunities, than it was for organizational overview and external environment. This could often be attributed to differences in how companies frame these topics. When companies saw risk and opportunity as two sides of the same coin, they discussed them, including their interdependencies, together. Otherwise, opportunities were covered in a variety of places, such as the outlook section (itself a content element) or in discussion relevant to one of the capitals, such as R&D investments. Perhaps driven by regulatory reporting requirements, it was more common for risks to be a stand-alone section. Still, they were also covered in such sections as materiality, governance, or even in a general “About This Report” or “About Us” section.
Strategy and Resource Allocation
The <IR> Framework asks, “Where does the organization want to go and how does it intend to get there?”30 Answering this question includes a statement of strategic objectives for the short-, medium-, and long-term; what the company is doing to accomplish them; resource allocation plans for implementing this strategy; and how it will measure achievements and target outcomes over different time frames.31 We found strategy and resource allocation to be one of the most diffuse of the content elements, as it never appeared as a separate section or even as the main topic of a well-defined section by another name. The topics in this content element were typically covered in discussions about the company's business model and performance. Companies varied in the extent to which they were explicit about the six capitals when discussing resource allocation. In some cases, one or more of the capitals was described, but the company was not explicit about the use of this capital as a resource.
Performance
The <IR> Frameworks asks, “To what extent has the organization achieved its strategic objectives for the period and what are its outcomes in terms of effects on the capitals?”32 This includes both qualitative and quantitative information such as indicators with respect to targets and opportunities, with explanations of their significance, implications, and the methods and assumptions used in compiling them; the organization's positive and negative effects on the six capitals; the nature of its relationships with key stakeholders and how the organization has responded to their legitimate needs and interests; and linkages between past and current performance, and between current performance and outlook.33 For the most part, the reports we reviewed would be better categorized as “combined reports” rather than “integrated reports.” They included the anticipated information on financial and operating performance, often presented well through summaries earlier in the report and with more detail and accompanying explanation. Sometimes later in the report, detail included the business unit or even product level.
Although typically framed as “sustainability” or “corporate social responsibility” performance, all reports contained information on nonfinancial performance, with the capitals discussed more in the background than foreground. The degree of detail regarding nonfinancial performance varied widely, as did how prominently it was displayed. For a relatively small number of companies, a modest amount of forward-looking information—targets or projections—was presented in the context of past performance, both financial and nonfinancial. Noticeably lacking in nearly all reports were explanations of how financial and nonfinancial performance related to each other—a grave oversight considering the centrality of “connectivity” as an idea. Also lacking in virtually all reports was any explanation of how past performance and other factors would contribute to future value creation considered for the short-, medium-, and long-term.
Outlook
The <IR> Framework asks, “What challenges and uncertainties is the organization likely to encounter in pursuing its strategy, and what are the potential implications for its business model and future performance?”34 As the company's view on anticipated future changes, outlook should be built on sound and transparent analysis about changes in the external environment in the short-, medium-, and long-term; what effect these will have on the organization; and how the organization is currently equipped to respond to critical challenges and uncertainties that are likely to arise.35
Although a few came close, virtually no company provided all of the information suggested by the <IR> Framework. Further evidence that this was the weakest of the content elements is that only 25 companies scored a 3, compared to 45–50 for all the others. Various formats were used to present the company's view on outlook. Some companies had a specific outlook section, although titles and level of detail varied. Others provided this information throughout the report, sometimes down to the business unit level. A few companies combined performance and outlook into a single section. Companies varied substantially in exactly what information they regarded as important for this element. It was fairly common for companies to discuss trends and challenges. Although less common, a number of companies identified challenges and uncertainties. Probably due to liability and competitive concerns, most companies did not provide targets, forecasts, projections, or even scenarios.
Special Factors
The average score for the seven Special Factors we evaluated was 1.68 (2.09 for South African companies vs. 1.58 for all other companies). Significantly lower overall than for the six capitals and content elements, this category also had the largest range from high to low of .92 (Figure 7.4), with only 11 companies receiving a 3 on all seven factors. Concomitantly, a smaller percentage of companies had a score of 2 or 3 for each special factor: material risks identified (62.1%), explained how material risks are handled/mitigated (54.0%), used a materiality matrix (34.5%),36 stakeholder engagement demonstrated and explained (60.5%), connectivity of information demonstrated or explained (68.6%), and letter from chief executive officer (CEO) or chief sustainability officer (CSO) addressing organizational sustainability (67.7%). The one exception was website content supporting the integrated report (92.9%). We consider disclosures made by Wärtsilä,37 DSM,38 SAP,39 American Electric Power,40 and BS Financial Group41 to be excellent examples of reporting on each of the special factors.
Figure 7.4 Average Score by Special Factor
These data suggest that the “Guiding Principles” part of the <IR> Framework will be the most challenging to follow. Connectivity of information demonstrated or explained, the key to producing an integrated report rather than a combined report, received a score of 1.76. Only 25 companies received a score of 3 on this item. Stakeholder engagement demonstrated and explained also scored fairly low at 1.75.42 Although identification of material risks received a score of 1.90, explanation of how material risks are handled or mitigated received a score of 1.63, and use of a materiality matrix only got a score of .97 based on the fact that most companies (nearly 60%) did not have one in their report—although some did on their website.
A comparison between South African companies and the rest of the population casts the lower scores on special factors into even sharper relief. In contrast to the rest of the sample (scored at 1.58), the average for the South African companies was 2.09—a much bigger spread than for the six capitals and content elements. Furthermore, some of the greatest differences in all of the factors occurred in special factors. The most striking disparity was in providing a materiality matrix (1.71 vs. 0.79). South African companies were also much better at explaining how material risks were handled or mitigated (2.08 vs. 1.52), showing connectivity of information (2.33 vs. 1.62), and using their website to support their integrated report (2.33 vs. 1.74). Some of these differences could be due to use of the IRC of SA Discussion Paper, which contained an in-depth discussion of materiality. Despite the fact that the term “connectivity” is not overtly mentioned, South African companies scored much higher here. Similarly, for the CEO/CSO letter, South African companies scored 2.21 in contrast to the rest of the sample's 1.83, which is also not covered in the IRC of SA Discussion Paper. Interestingly enough, there was virtually no difference between South African (1.79) and non-South African companies (1.74) on stakeholder engagement demonstrated or explained, although stakeholders received substantial discussion in the IRC of SA Discussion Paper.
Materiality
The treatment of materiality in the <IR> Framework has been covered extensively in Chapter 5. Since most companies discussed materiality as a risk factor, we focused our analysis accordingly. Although not high in an absolute sense, the materiality scores indicated that companies on average did a better job identifying their material risks than they did in explaining how they handled or mitigated them. Some discussed material risks at the business unit level. The very low score for use of a materiality matrix indicates that disclosure about the process companies used for identifying material risks was generally poor, even if some did discuss the relationship between stakeholder engagement and the identification and management of material risks. Disclosure was even poorer when it came to explaining the company's definition of materiality or if and how it was making progress in managing these risks.
Stakeholder Engagement
Stakeholder relationships are one of the Guiding Principles in the <IR> Framework: “An integrated report should provide insight into the nature and quality of the organization's relationships with its key stakeholders, including how and to what extent the organization understands, takes into account, and responds to their legitimate needs and interests.”43 Different from the actual quality of stakeholder engagement itself, we measured the quality of disclosure about stakeholder engagement. However, we hypothesize that these are closely related to each other; stakeholders will challenge a company that makes excessive claims about its degree of stakeholder engagement.
Other than use of a materiality matrix, stakeholder engagement was, along with connectivity of information, ranked the lowest of the special factors. It was also the only category in which there was no discrepancy between South African companies and the rest of the sample. However, as discussed in the previous chapter, there is a close relationship between stakeholder engagement and identifying material issues. Nearly 90% of the companies receiving the highest score for stakeholder engagement also received the highest score for identifying material risks (Table 7.1). In contrast, 75% of the companies that received the lowest score for stakeholder engagement also scored the lowest for identifying material risks.
Table 7.1 Stakeholder Engagement and Identifying Material Risks
| Stakeholder Engagement Demonstrated and Explained |
||||||
| 3 | 2 | 1 | 0 | Total | ||
| Material Risks Identified | 3 | 34 (88%) | 14 (39%) | 4 (14%) | 1 (5%) | 53 |
| 2 | 1 (3%) | 12 (32%) | 10 (34%) | 1 (5%) | 24 | |
| 1 | 3 (9%) | 9 (24%) | 13 (45%) | 3 (15%) | 28 | |
| 0 | 0 (0%) | 2 (5%) | 2 (7%) | 15 (75%) | 19 | |
| Total | 38 (100%) | 37 (100%) | 29 (100%) | 20 (100%) | 124 | |
Companies that scored high in both categories typically disclosed on them in the same section of their report. Various formats were used to disclose stakeholder engagement, including tables and graphics. Some companies were explicit about following certain standards (e.g., AA1000 from AccountAbility) or best practice frameworks (e.g., from GRI).44 In a few cases, companies only provided positive information about the outcomes of stakeholder engagement, raising the question of whether they were following the <IR> Framework's Guiding Principle of Reliability and completeness: “A complete integrated report includes all material information, both positive and negative.”45
Providing further support for the previous chapter's argument that constructing the SVM and getting its full value requires effective stakeholder engagement, we also found a strong relationship between company publication of a materiality matrix and its level of stakeholder engagement (Table 7.2). Nearly three-quarters of the companies that received the highest score on the materiality matrix scored the highest on stakeholder engagement—in contrast to only 16% among companies that did not include a materiality matrix in their integrated report. This suggests that producing a materiality matrix enhances disclosure about stakeholder engagement, likely because stakeholder engagement is an important element of constructing the matrix and thus often discussed when the matrix is presented.
Table 7.2 Stakeholder Engagement and the Materiality Matrix
| Company Uses a “Materiality Matrix” in the Reportto Present the Risks | ||||||
| 3 | 2 | 1 | 0 | Total | ||
| StakeholderEngagement Demonstratedand Explained | 3 | 19 (73%) | 4 (24%) | 3 (38%) | 12 (16%) | 38 |
| 2 | 4 (15%) | 11 (64%) | 1 (12%) | 21 (29%) | 37 | |
| 1 | 3 (12%) | 1 (6%) | 4 (50%) | 21 (29%) | 29 | |
| 0 | 0 (0%) | 1 (6%) | 0 (0%) | 19 (26%) | 20 | |
| Total | 26 (100%) | 17 (100%) | 8 (100%) | 73 (100%) | 124 | |
Connectivity of Information
While all of the Guiding Principles are important, for us “Connectivity of information” lies at the heart of integrated reporting. It is through showing connectivity, or the relationships between different aspects of corporate performance, that a report transitions from a “combined report” to an “integrated report.” According to the <IR> Framework, “An integrated report should show a holistic picture of the combination, interrelatedness, and dependencies between factors that affect the organization's ability to create value over time.”46 This requires integrated thinking to facilitate the connectivity of information flow into internal reporting, analysis, and decision-making so that the results are reflected in the external integrated report.47
As it is difficult to achieve in a paper format and almost equally hard to evaluate, connectivity of information received a fairly low score for the entire sample. To trivialize the concept, connectivity of information refers to the notion that “everything is related to everything else.” This is illustrated in Figure 7.5, which shows that the explanation of connectivity of information in the <IR> Framework includes all of the six capitals and substantive content elements (except for Basis of preparation and presentation and General reporting guidance). Thus, a company has to make choices about what connections to make and in what priority and sequence. Since all content elements are related to each other, the company can justifiably discuss the others when focusing on any specific one. In fact, as shown in Figure 7.6, in discussing each content element, the <IR> Framework explicitly refers to many other elements. If the integrated report were organized by content element, each of which discusses other relevant content elements, this would lead to substantial repetition and would violate the Guiding Principle of Conciseness.48 However, the same problem would exist if the report were organized in another way. Since a paper report proceeds in a linear fashion in spite of many interrelationships among different pieces of information in the report, there will always be a tradeoff between concision and connectivity. The solution, we will argue in Chapter 9, is to use information technology as a way of assuaging the limitations of a paper format presentation.
Figure 7.5 Connectivity of Information, Content Elements, and the Capitals
Figure 7.6 Relationships of the Content Elements to Each Other in the International <IR> Framework
We found the most common attempt to provide connectivity to be in the discussion of the company's business model, risks and opportunities or, to a lesser extent, in strategy and resource allocation. The rarest instance of all—and, to us, the “Holy Grail” of integrated reporting—was a clear articulation of how performance in one dimension affected performance on another. Major obstacles to this include understanding these cause-and-effect relationships and having the data to test hypotheses about them, the latter further limited by the lack of standards. In order to ascertain their robustness, these relationships must be tested across a number of firms.
Website Content
Focused on the content of an integrated report and the relationship between integrated reporting and integrated thinking, the <IR> Framework has relatively little to say about the different channels and formats for providing or gathering information and for stakeholder engagement. That is, the Internet and the role of technology are not addressed in great detail. In its discussion defining the meaning of an integrated report, the <IR> Framework merely notes that the integrated report can be an “entry point” to more detailed information, such as the use of hyperlinks for web-based reports.49
Since the next chapter is devoted to corporate reporting websites, here we will merely identify some of the ways in which the companies in our sample were leveraging the Internet. For the most part, they were quite modest, much like the examples in the previous chapter. PDF reports always included a link to the company's website, but specific topics in most of these PDF reports were not linked to exact sections of the website where the content was discussed in greater detail.50 In some cases, the online version of the integrated report included links to supplementary information, like more detailed data or further explanation of a topic. This sometimes helped to illustrate the connectivity of different pieces of information. A few companies enabled users to construct their own custom report by choosing which sections of the integrated report to assemble. Although this feature was not available at the individual data item level, in some cases the user could download data in blocks. Finally, some companies put their materiality matrix on their website. Some only put it on their website. A few included the interactive capabilities discussed in the previous chapter. One of the most interesting examples, discussed in more detail in the next chapter, was SAP's completely digital integrated report, which enables the audience to better comprehend the company's view on the connectivity of different types of performance information.
CEO Letter
Although the <IR> Framework says virtually nothing about a letter from the CEO or any other company official, we studied this item as a proxy for integrated thinking. To what extent was integrated thinking reflected in the opening letter from a senior company official that always accompanies an annual or integrated report? Although not always signed by the CEO, every report we examined contained some type of letter. Some letters were signed by the Chairman of the Board or even the CSO. When the latter was the case, it gave the impression that the integrated report had evolved out of a sustainability report rather than a financial report. Putting aside the fact that very few of these letters explicitly used the term “integrated report” or “integrated reporting,” the general quality of integrated thinking demonstrated in these letters was poor.
Although better letters attempted to explain how “CSR” or “sustainability” was core to the company's strategy and/or beliefs (i.e., not a stand-alone initiative), these assertions were rarely supported by much information. Those who made this statement sometimes claimed that by being a more sustainable company, they would contribute to a more sustainable society. This too appeared in general terms with little data to back up the claim from a company or society perspective. Some letters accomplished even less than this, mentioning “sustainability programs” or “CSR initiatives” without any attempt to link them to the core strategy and operations of the company. Since these opening letters set the tone for the reader, they are a strong signal of just how integrated the report really is. Conversely, the quality of the letter will be a function of the quality of the integrated report. That said, regardless of the letter's quality and that of the integrated report it accompanies, these paper documents are only one way in which the company communicates to its audience. These must be viewed in the broader context of how companies are using the Internet for their corporate reporting websites, the subject of the next chapter.
Assurance
Although the integrated reporting movement is still in its early stages, the issue of whether and how to perform an integrated audit or assurance opinion has already emerged. The traditional audit opinion on the financial statements is a form of “positive” assurance that proclaims everything was done right. To the extent nonfinancial information has an audit opinion, it almost always receives a negative assurance opinion, which roughly translates to “we couldn't find anything seriously wrong.” A financial audit opinion is largely binary. The company either gets a clean audit opinion or it does not (a “qualified opinion”), and the latter is rare because of the negative signal it sends to the market. Generally, the company and its auditor work hard to make sure the audit opinion is a clean one.51
For nonfinancial information, degrees of assurance range from self-assurance (the company says, “Trust me.”), through limited assurance (from an accounting firm or other service provider), to full assurance (positive). Although rare, full assurance almost always comes from a Big Four accounting firm. Limitations on a full assurance opinion for nonfinancial information include the lack of measurement, reporting, and auditing standards. In addition, two other significant challenges are acquiring or developing the capabilities necessary to provide assurance on nonfinancial information and litigation risk, especially in the United States.52 Very few companies have even come close to having a positive assurance opinion on an entire integrated report, although Philips appears to be making progress toward that objective (see inset “Assurance on the Philips Annual Report”).
Roughly half of the firms (55%) had some type of assurance opinion on their nonfinancial information, of which three-quarters (76%) came from a Big Four accounting firm. The others were typically from a boutique sustainability consulting firm. In our sample, we did not find any example in which there was a single audit opinion for both financial and nonfinancial information. In some cases, the same audit firm provided both opinions; in others, two different firms did.