
Chapter 14
Understanding Applications in a Virtual Machine
Virtualization and all of its accompanying benefits are changing the way infrastructures are designed and deployed, but the underlying reasons are all about the applications. Applications are the programs that run a company's business, provide them with a competitive advantage, and ultimately deliver the revenue that allows a company to survive and grow. With the corporate lifeblood at risk, application owners are reluctant to change from the existing models of how they have deployed applications to a virtual infrastructure. Once they understand how a virtual environment can help mitigate their risk in the areas of performance, security, and availability, they are usually willing to make the leap. Hypervisors leverage the physical infrastructure to ensure performance resources. Multiple virtual machines can be grouped together for faster and more reliable deployments. As both corporate and commercial services begin to shift to cloud computing models, ensuring that the applications supported on the virtual platforms are reliable, scalable, and secure is vital to a viable application environment.
- Examining virtual infrastructure performance capabilities
- Deploying applications in a virtual environment
- Understanding virtual appliances and vApps
Examining Virtual Infrastructure Performance Capabilities
Our efforts so far have focused on virtual machines and the virtual environment that supports them. While this is valuable, the result has to be that the applications deployed on physical servers can be migrated to these virtual environments and benefit from properties you have already investigated. Applications are groups of programs that deliver services and information to their users. These services and information provide income for their companies. Fearful that the service will be compromised, the groups responsible for the applications (the application owners) are often reluctant to make changes to their environments. Application owners are unwilling to risk application changes that might impact the application's availability, scalability, and security. In Chapter 13, “Understanding Availability,” you saw some of the ways a virtual environment can increase the uptime of an application. The ease of altering a virtual machine's configuration to add additional resources can make virtual machines more scalable than their physical counterparts. Other virtualization capabilities, such as live migration or storage migration, bring greater flexibility and agility to applications in a virtual environment. Another area where virtualization provides great benefits is the creation and manageability of the virtual machines through templates and clones, which can significantly reduce application deployment time and configuration errors, both areas that impact a company's bottom line. All of these are important, but probably most crucial is application performance.
Applications that perform poorly are usually short lived because they impact a business on many levels. Aside from the obvious factor that they extend the time it takes to accomplish a task and drive down efficiency, slow applications frustrate users, both internal and external to a company, and could potentially cost revenue. Again, it raises the topic of increased user expectations. Think about your own experiences with online services. Would you continue to purchase goods from a website where the checkout process took 20 minutes, or would you find another vendor where it would be less cumbersome? This is one reason why application owners are hesitant about virtualization—they are unsure about sharing resources in a virtualization host when their current application platform is dedicated entirely to their needs, even though it might be costly and inefficient.
Virtualization has a number of technologies that allow a business-critical application to get the resources it requires to operate quickly and efficiently, even at the expense of less critical virtual machines. The model used here is from VMware's ESXi solution. While these features are not in every vendor's virtualization solution, as products evolve, they will probably appear in some future release. The first of these is resource settings. Each virtual machine has three settings that can be adjusted to affect the amount of CPU and memory resources that it can receive. Figure 14.1 illustrates the options for these virtual machine settings (Shares, Reservations, and Limit). The first setting is Shares, and it is used to measure against the shares that other virtual machines have been allocated to determine precedence. If a virtual machine has half the CPU shares of another virtual machine, it will be entitled to only half of the resources. In times of CPU contention, a virtual machine with more shares will be entitled to more scheduled CPU time. A reservation is the guaranteed minimum that a virtual machine will always have, even when resources are scarce. If there are not enough resources on a virtualization host to meet the reservation, the virtual machine cannot be powered on, and the virtual machine will be powered on in another host in the cluster. The limit is the greatest amount of resources that can be allocated to a virtual machine. This is normally not used because the resource configured for the virtual machine, the memory amount or number of processors, is the upper limit.
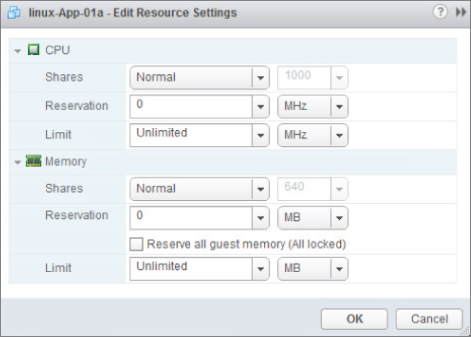
Figure 14.1 Virtual machine resource settings
On a single virtualization host, the hypervisor uses these settings to prioritize how memory and CPU resources should be rationed. If there is no resource contention, then all the virtual machines receive all of the resources they require, as they need them. This is the optimal scenario. In situations where virtual machines begin to request more resources than the physical host can provide, the hypervisor will allocate the resources using the resource settings as the governing rules. When these settings are configured correctly, virtual machines that contain critical applications can be assured of receiving enough resources to maintain their performance. Less critical applications may suffer performance degradation, but that should not impact the business.
This model is simple enough for a single virtualization host, but what happens in the case of a virtualization cluster? Here resource pools are used. The name is an accurate description of its function: a pool of resources. Resource pools can be applied on a single virtualization host, or across multiple hosts in a cluster, and they aggregate the CPU cycles and memory to be shared out among the virtual machines, groups of virtual machines, or other entities such as departments. Resource pools can be further subdivided into smaller child resource pools, enabling an administrator to have more granular control of the resource allocation. The options for managing a resource pool are similar to the individual virtual machine settings and involve defining resource shares, reservations, and limits. The difference is that you then assign multiple virtual machines to each of these pools, and that resource pool can span one or more virtualization hosts. Again, a critical application composed of multiple virtual machines, spread across more than one virtualization host, can be assured that enough resources will always be available for its needs. Figure 14.2 shows a simple example of two resource pools on a cluster. Each is allocated a portion of the aggregate resources with some extra capacity put aside for growth and short-term performance spikes. Because changes can be done dynamically, there is no performance impact when resource pools need to be adjusted.
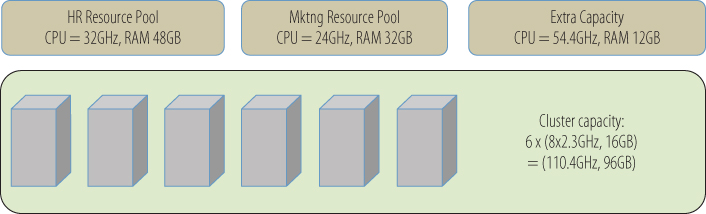
Figure 14.2 Resource pools
Another feature that aids good application performance in a virtual environment is live migration. If an application in a physical server runs out of resources, the application needs to be taken offline to add additional resources to the server, or to replace the server entirely with a larger machine. You saw earlier that virtual machines are nimbler because in the same circumstance adding resources would require minimal downtime, if any, depending on the operating system hot-add capability. But what happens in a virtualization server where most of the physical resources are already being consumed by the multiple virtual machines being hosted, and more resources are being demanded by a VM? In this case, one or more virtual machines can be live migrated to other virtualization hosts in the cluster, freeing up resources for the hungry virtual machine. When the resource demand has been satisfied, and the overall requirement on the virtualization host recedes to previous levels, virtual machines can be migrated back. Obviously, resources need to be available on the other hosts in order to migrate the guests there. If there are no more available resources in the cluster, it is time to add more hosts to the cluster. Does this mean a virtualization infrastructure administrator needs to constantly monitor the performance characteristics of the cluster in order to actively migrate virtual machines? Fortunately, that level of involvement is not necessarily required. Virtual infrastructure solutions have automated load-balancing capabilities as part of the architecture. When, from a resource-utilization standpoint, a cluster becomes unbalanced, virtual machines can automatically be migrated from one virtualization host to another, providing an optimal and even allocation of the available resources.
This is a simple description of a sophisticated performance load-balancing mechanism. There are levels of automation that can be configured allowing administrators to oversee the process or permitting a fully automated migration strategy. Complex application rules, such as VM-affinity, can be applied that guarantee certain virtual machines always run together on the same physical server, ensuring that if one virtual machine is migrated, the other goes with it. One reason for this might be that the two virtual machines are constantly exchanging high amounts of data. On the same virtualization host, that traffic occurs at high speed on the virtual network, rather than having to traverse a slower physical wire between physical hosts. An additional benefit of this situation is that the whole of the network data volume between these two VMs has been removed from the physical network, freeing that capacity for other work and extending the network bandwidth.
The converse, anti-affinity, can be configured as well, guaranteeing that if necessary, two selected virtual machines won't ever be permitted to be guests on the same virtualization host. This case might be used where a critical application service provided by redundant virtual machines would still be available in the event of a virtualization host failure. In Chapter 13, “Understanding Availability,” you learned about storage migration. Like live migration, storage migration can also be automated, allowing virtual infrastructures to communicate with storage arrays to automatically resolve disk performance issues without needing a storage administrator to discover, diagnose, and resolve the issue.
Though you saw mention of them earlier, it is worth a brief second look at two other features. In Chapter 9, “Managing Storage for a Virtual Machine,” one of the tuning features discussed was Storage I/O Control, a quality of service capability that can moderate storage throughput on a per virtual machine basis. By assigning higher priorities to the virtual machines of a critical application, you can ensure that disk I/O contention will not be a bottleneck for that application. That is, of course, assuming that there are enough physical resources to accommodate the need. Priorities are administered with shares and limits as you saw with the resource pools. Similarly, in Chapter 10, “Managing Networking for a Virtual Machine,” you learned that there is a capability to prioritize network throughput as well. Also administered with shares and limits, Network I/O Control can be applied to traffic types, groups of virtual machines, and individual virtual machines. Both of these technologies can ensure good performance for critical applications, even in situations that might otherwise be subject to resource pressure. As a secondary effect, they improve efficiency by reducing the time and effort an application administrator needs to monitor and manage these types of performance issues.
These are not all of the things that can be applied to ensure good performance for applications staged in virtual machines. You have seen before that good configuration and architecture practices in the various infrastructure areas—CPU, memory, network, and storage—all offer similar benefits when translated from physical to virtual systems. The same applies here as well. The use of more and faster disks will provide better response time from storage devices. More bandwidth accommodates less network contention. Virtualization features contribute to greater availability, flexibility, and better performance, but they are not the sole reasons.
Deploying Applications in a Virtual Environment
The best way to be sure that an application performs well is to understand the resource needs of the application, but more importantly, to measure that resource usage regularly. Once you understand the requirements, you can begin to plan for deploying an application in a virtual environment. There are some things that you can always count on. A poorly architected application in a physical environment is not necessarily going to improve when moved to a virtual environment. An application that is starved for resources will perform poorly as well. The best way to be sure an application will perform correctly is to allocate the virtual machine enough resources to prevent contention. Let's look at a simple example.
Many applications are delivered in a three-tier architecture, as shown in Figure 14.3. The configuration parameters in the figure are merely sample numbers. There is a database server where the information that drives the application is stored and managed. Usually, this will be Oracle, Microsoft SQL Server, or maybe the open-source-solution MySQL. This server is typically the largest one of the three tiers with multiple processors and a large amount of memory for the database to cache information in for rapid response to queries. Database servers are resource hungry for memory, CPU, and especially storage I/O throughput. The next tier is the application server that runs the application code—the business processes that define the application. Often that is a Java-oriented solution, IBM Websphere, Oracle (BEA) WebLogic, or open-source Tomcat. In a Microsoft environment, this might be the .NET framework with C#, but there are many frameworks and many application languages from which to choose. Application servers usually need ample CPU resources, have little if any storage interaction, and have average memory resources. Finally, there is the web server. Web servers are the interface between users and the application server, presenting the application's face to the world as HTML pages. Some examples of web servers are Microsoft IIS and the open-source Apache HTTP server. Web servers are usually memory dependent because they cache pages for faster response time. Swapping from disk adds latency to the response time and might induce users to reload the page.
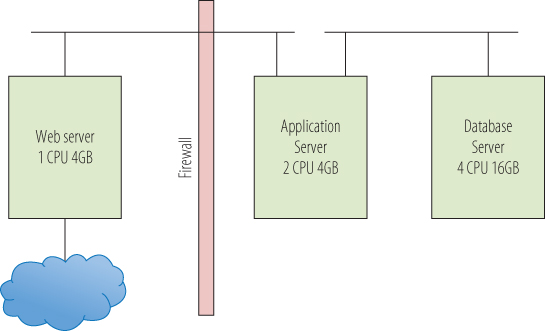
Figure 14.3 Three-tier architecture—physical
When you visit a website, the web server presents you with the HTML pages to interact. As you select functions on the page, perhaps updating your account information or adding items to a shopping cart, the information is passed to the application server that performs the processing. Information that is needed to populate the web pages, such as your contact information or the current inventory status of items you are looking to purchase, is requested from the database server. When the request is satisfied, the information is sent back through the application server, packaged in HTML, and presented to you as a web page. In a physical environment, the division of labor and the division of resources is very definite because each tier has its own server hardware and resources to utilize. The virtual environment is different.
Figure 14.4 shows one possible architecture for this model. Here, all of the tiers live on the same virtual host. In practice, that is probably not the case, but for a small site it is definitely possible. The first consideration is that the virtualization host now needs to be configured with enough CPU and memory for the entire application, and each virtual machine needs to have enough resources carved out of that host configuration to perform adequately. The virtual machine resource parameters discussed earlier—shares, limits, and reservations—can all be used to refine the resource sharing. Note that while in the physical model, all of the network communications occurred on the network wire; here, it all takes place at machine speeds across the virtual network in the virtualization host. Here also, the firewall separating the web server in the DMZ from the application server can be part of the virtual network. Even though the application server and the database server are physically in the same host as the web server, they are protected from external threats because access to them would need to breach the firewall, the same as in a physical environment. Because they do not have direct access to an external network, through the firewall is the only way they can be reached.
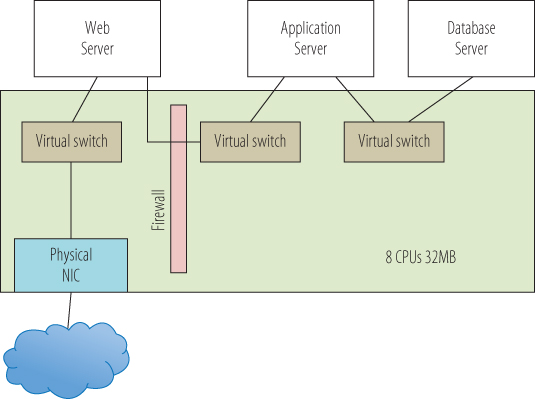
Figure 14.4 Three-tier architecture—virtual
As the application performance requirements change, the model can easily adjust. Applications that need to support many users run multiple copies of the web server and the application server tiers. In a physical deployment, it would not be unusual to have dozens of blade servers supporting this type of application. Load balancers are placed between the tiers to equalize traffic flow and redirect it in the event of a web server or application server failure. In a virtual environment, the same can be true when deploying load balancers as virtual machines. One large difference is that as new web servers or application servers are needed to handle an increasing load, in a virtual environment, new virtual machines can be quickly cloned from an existing template, deployed in the environment, and used immediately. When there are numerous cloned virtual machines on a host running the same application on the same operating system, page sharing is a huge asset for conserving memory resources. When resource contention occurs in a virtualization cluster, virtual machines can be automatically migrated, assuring best use of all of the physical resources. Live migration also removes the necessity of taking down the application for physical maintenance. Finally, in the event of a server failure, additional copies of the web server and application server on other virtualization hosts keep the application available, and high availability will restore the downed virtual machines somewhere else in the cluster.
With all of the different layers and possible contention points, how do you know what is happening in an application? There are tools that will monitor the activity in a system and log the information so it will be available for later analysis and historical comparison. This information can be used to detect growth trends for capacity modeling exercises, allowing the timely purchase of additional hardware, and prevent a sudden lack of resources. Virtualization vendors supply basic performance management and trending tools as part of their default management suites. Additional functionality is offered as add-on solutions for purchase. There is also a healthy third-party market of tools that supports multiple hypervisor solutions. As always, there are many tools developed as shareware or freeware and easily available as a download. All of these can be viable options, depending on your particular use case. The point is that measuring performance, and understanding how an application is functioning in any environment, should be a mandatory part of an organization's ongoing application management process.
- For a quick look at observing performance in a virtual machine, power on the Linux virtual machine you created in Chapter 6, “Installing Linux on a Virtual Machine.”
- Log in to the virtual machine.
- Open a browser and navigate to the website http://dacapobench.org/. DaCapo is a benchmark suite that you will use to generate load on the Linux virtual machine.
- Select the Download link on the left side of the page. On the Download page, click on the first hyperlink, which will download the
dacapo jar9.12-bachdacapo jar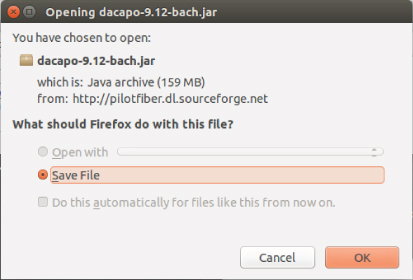
Figure 14.5 Saving the
jar - Open a Terminal window, which you can find by selecting the top icon in the left panel known as the Dash. If Terminal is not displayed as one of the Application offerings, enter terminal in the search bar, and then open a Terminal window. Navigate to the directory where you downloaded the
jar/home/<user>/Downloads - Execute the benchmark by entering
java –jar dacapo-9.12-bach.jar h2. This is an in-memory benchmark test that will stress the virtual machine. It will run through the benchmark test and finish by displaying metrics about the test, as shown in Figure 14.6. If you receive an error message stating that java isn't available, select one of the offered packages and follow the suggested command to install it.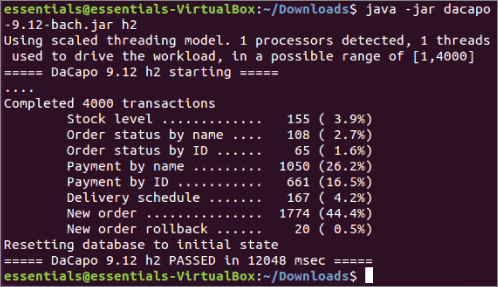
Figure 14.6 Executing the benchmark test
- You might be underwhelmed by that last step because there is not that much to see. Monitoring the resources of the virtual machine will show how the benchmark application affects the system. Select the top icon in the left panel, also known as the Dash. If you hover over the icon, it will display “Search your computer and online sources.” In the text bar, enter system. A number of choices, both utilities in your virtual machine and other things the extended search system has found, are displayed. Select System Monitor. Select the Resources tab, as shown on Figure 14.7.
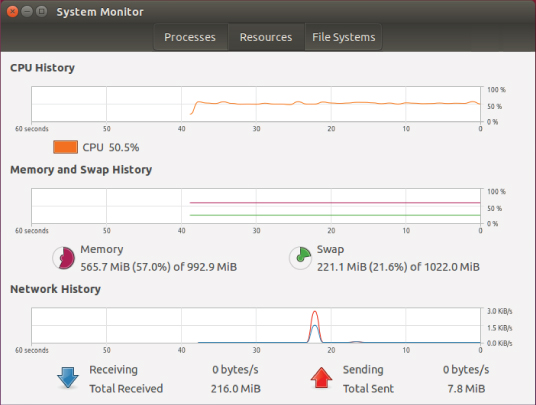
Figure 14.7 The System Monitor
- The screen displays the last 60 seconds of activity for CPU utilization, memory and swap usage, and network I/O. Because the benchmark is memory based, you should see activity in the first two areas. Move the Terminal window so you can enter commands and see the System Monitor.
- Execute the benchmark test again and watch the effect. As illustrated in Figure 14.8, you can see an instant rise in CPU utilization spiking to the 100 percent mark where it remains for the duration of the test. Although memory rises, it never goes above 50 percent utilization, so it seems the 2 GB of memory allocated for this virtual machine is more than adequate. Swapping and network I/O are not affected.
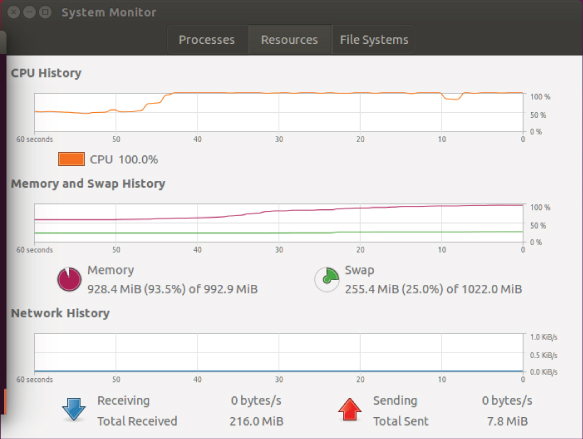
Figure 14.8 Benchmark effects
- This is only half the picture—the view from inside of the virtual machine and the resources that have been allocated to it. The next step is to examine how this activity affects the virtualization host. Resize the Virtual Machine window on your desktop so you have space for another window.
- On the Windows toolbar, enter
perf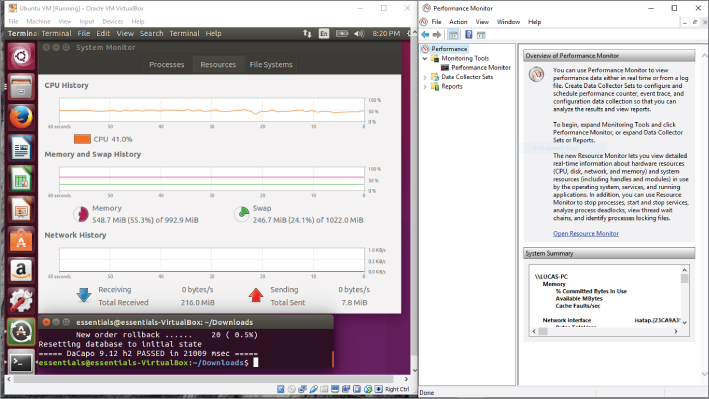
Figure 14.9 Examining the virtualization host
- In the Performance Monitor, open the Monitoring Tools folder and highlight the Performance Monitor icon. The default display is the CPU performance, and you can observe the CPU utilization. You can clear the Monitor window by right-clicking on the performance chart and selecting Clear from the menu.
- In the Linux virtual machine, restart the benchmark test. In the Linux System Monitor, everything occurs as it did in previous iterations. The CPU activity spikes to 100 percent for the duration of the test. In the Performance Monitor, as shown in Figure 14.10, the CPU utilization spikes as well, but far short of the top. In an actual application environment, this might indicate that you need to add one or more vCPUs to the virtual machine for improved performance.
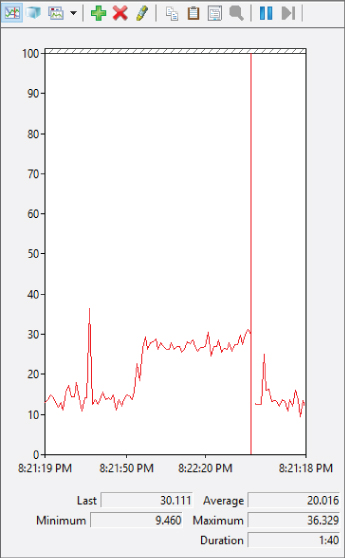
Figure 14.10 Performance Monitor on the host
These are obviously simple tools and simple tests but even in large multi-tier and multiple-system application deployments, the same principles apply. In a virtual environment, performance measurements need to be done from inside the virtual machine to understand where resources are constrained and affecting application performance. Measurements also need to be done on the virtualization host and at the overall cluster layer to have a full picture of the performance environment. Many organizations undergo constant performance monitoring of their critical applications, allowing them to regularly review how their environment is behaving. With this information, they can be proactive about preventing resource constraints, instead of waiting for issues to occur and managing them in the midst of application problems.
Understanding Virtual Appliances and vApps
The three-tier application discussed earlier was probably created by a number of people in the IT department, although in smaller shops one person can wear all of the hats. A virtualization administrator created the original virtual machines and configured them according to some basic parameters. An operating system engineer provisioned the operating systems on each one and then updated it with the latest patches. Any corporate standard tools were added at this time. The application developer or specialist then installed and configured the application components—web server, application server, application code, and database. Integration tests were run to validate and stress the virtual machines as an application unit. Once all the testing was complete and any resulting changes had been applied, they were converted into templates, the gold images to produce the production virtual machines. You learned earlier that virtual machines can speed this provisioning procedure by orders of magnitude, but it is still a transfer of the physical server provisioning process to a virtual infrastructure without fundamental operational changes. Virtual appliances change this model.
Virtual appliances are prebuilt virtual machines that already contain everything needed to deploy an application. Often the operating system is an open-source deployment or a specially developed thin OS, also called JeOS (pronounced “juice,” for Just Enough Operating System) that only has what the application requires and no more. Because of this, virtual appliances require none of the patching and maintenance of a traditional operating-system-based installation. When a new version is available, the entire virtual machine is replaced, minimizing the time needed to deploy a new release. In many cases a virtual appliance installation consists of a download, unpacking the virtual machine on a virtualization host, powering it on, and performing some minimal configuration steps to connect it to the desired network and storage. Virtual appliances are often delivered in OVF format so they can be quickly deployed on any hypervisor solution.
The next step is to package one or more virtual machines that comprise an application into a container. This container, called a vApp, might contain the three virtual machines described earlier that made up the three-tier application. Like a virtual appliance, a vApp is stored in the OVF format making it easily transportable. A vApp also packages information about the application's networking, availability, and security requirements. Think of a shipping container on a cargo transport ship. When the ship docks, thousands of these containers are offloaded and sent in a thousand different directions quickly and efficiently. Dockyard workers use technology to read the barcodes on each container, which can supply all the inventory, customs, ownership, and routing information. vApps have all of the deployment information as part of their container. When deployed in a virtual environment, a vApp packaged application can be provisioned in the cluster and provide the desired level of availability, security, and the proper network configuration, all without an administrator's assistance or intervention.
This functionality (the ability to rapidly clone, deploy, and move applications while maintaining service levels around application availability, scalability, security, and manageability) is at the heart of the promise of cloud computing. Delivering new services more rapidly and more efficiently—and providing them in a secure, scalable, and highly available manner—will fuel this next evolution of computing. It will not be long before new cloud computing models provide entire data centers with the same capabilities you have seen for virtual machines. The foundation of this new model is virtualization.
Open Stack and Containers
New methods of deploying applications are rapidly appearing. Where virtualization was a disruptive technology a decade ago, new models are now beginning to disrupt virtualization.
One of these is containers. Containers provide a technology to package applications and everything those applications need to run into a standard unit that can then be rapidly and repeatedly deployed in many environments. This may sound identical to what virtualization provides, and in many ways the benefits that containers provide mirror what you saw earlier in this text. The differences are where companies make decisions about deployments. For example, one large difference between the two models is that the container engine sits above an operating system and shares the kernel among the containers. Each container has its own files—code, executables, system libraries—just like a virtual machine, except by sharing the kernel code for efficiency, each container must run the same single version of an operating system. As you have seen, each virtual machine can have its own copy of an operating system and VMs on a single host can all run different operating systems without difficulty. If the deployment model only requires a single operating system across of the workloads, then containers might be a possible option. Containers are widely used for development environments because they allow a very rapid instantiation of one or more environments and are easy to share among a team of people. Other use cases involve companies that entirely control their applications from start to finish. Google and eBay are examples of companies that deploy many of their applications and services in a containerized environment. You can learn more about containers at https://www.docker.com/ or http://kubernetes.io/.
OpenStack is an open-source project that is designed to manage pools of compute, network, and storage resources, both in traditional data centers and in cloud computing architectures. It is a framework that includes the compute virtualization we have focused on, adds network and storage services, and provides additional capabilities like orchestration for automation, telemetry for metering, and containers to include engines like Docker or Kubernetes in the framework. Similarly, virtualization engines like VMware ESXi and Red Hat KVM can also be employed as part of an OpenStack infrastructure. As the area of compute virtualization has matured, the complementary and supporting infrastructures have also matured. There are many third-party solutions that provide virtualized storage or virtual networking. More robust solutions include these capabilities and offer integrated performance monitoring, capacity planning, application catalogs, automation and orchestration services, security, compliance, and more. OpenStack is the open-source community version of this effort, allowing anyone to download and use the solution at no cost. Like other open-source projects, developers around the globe contribute code to the project, helping to incrementally add stability and functionality to the whole. Similar to how Red Hat provides enterprise-level support for Linux at a cost, there are companies that provide support for OpenStack as well. You can discover more about the OpenStack project at https://www.openstack.org/.