3 Testing as a Source of Initial Information for Successful Practical Reliability Prediction
Lev M. Klyatis
As was considered in Chapter , the application of successful reliability prediction has not yet fully developed for practical use by industry. This is largely because the statistical methodologies that are employed do not directly connect with the sources for obtaining accurate initial information which is a necessary element for the successful application in design of these methodologies. This initial information is usually obtained from testing technologies that are not fully developed to duplicate real‐world conditions. Therefore, there is a significant difference between the results predicted and the real‐world results during the desired time period, whether this is the service life, warranty period, or any other established time.
3.1 How the Testing Strategy Impacts the Level of Reliability Prediction
Let us consider in greater detail how the testing strategy impacts the level of reliability prediction. There are two basic aspects of testing (Figure 3.1):
testing in normal field conditions, where the product works in real world;
accelerated testing.
Figure 3.1 Scheme of the two basic aspects of testing.
For reliability evaluation and prediction, one usually uses accelerated testing, for which there are four basic approaches, as shown in Figure 3.2. In this book we used the fourth approach, because:
The first approach does not provide accurate initial information for successful prediction, because it does not take into account the effect of multi‐environmental types of testing influences on the product reliability during the defined life cycle (years of usage).
Approach number 2 does not provide reliable information because it does not work with the actual product or the actual influences experienced in the field.
Approach number 3 does not accurately simulate real field conditions, therefore it does not offer reliable information necessary for successful reliability prediction.
Figure 3.2 Scheme of the four basic approaches to accelerated testing.
It must be recognized that all types of laboratory testing or proving‐ground testing is actually accelerated testing. This is because the objective of the testing is to provide predictive results quicker than can be obtained in normal field conditions. Moreover, accelerated testing usually includes some degree of greater than normal stresses to produce quicker test results.
Figure 3.3 shows the evolution of reliability testing from the traditional separate simulation of the field input influences, which relied primarily on traditional ALT to ART/ADT. It shows how complex the path to accurate ART/ADT truly is.
Figure 3.3 The path from traditional ALT with separate (or some) simulation input influences to ART/ADT with simulation for the full field situation (full field input influences plus safety plus human factors).
Figure 3.4 depicts the basic causes of why the first three currently used approaches of accelerated testing usually lead to an unsuccessful prediction.
Figure 3.4 Reasons why the currently used approaches to accelerated stress testing often lead to unsuccessful prediction of reliability and durability.
Figure 3.5 shows that the vast majority of testing that is done is functional testing, followed by a much lower volume of traditional ALT and that combined testing (which began to develop and used in 1950s). ART/ADT is the smallest volume of testing currently in use.
Also highly accelerated life testing (HALT) and the highly accelerated stress screen (HASS) are often improperly referred to as ART or reliability testing. A careful reading of the book by Gregg Hobbs [1], who is the author of HALT and HASS, shows that these types of testing are intensive methods that use stresses higher than those encountered in actual field environments.
It is worthy of note that in that book, Gregg Hobbs never mentions reliability testing, although some people wrongly interpret his approach as being reliability testing (ART or ADT). From Figure 3.6, one can understand the basic causes for the slow development in the area of testing. This figure demonstrates that the majority of technical progress over the last 50–60 years is related to the development of ideas and research.
Figure 3.6 Progress of the different areas of activity (over the last 50–60 years).
A lower level of technical progress is depicted for design development, followed by manufacture and service. The lowest level of technical progress relates to testing areas (4). Unfortunately, this is contradictory to what should be the real practice. As new products are introduced with new and higher levels of technology, complexity, and technical progress, their increased complexity requires corresponding higher level of testing if reliability too be successful predicted.
But Figure 3.6 clearly demonstrates the rate of technical progress in testing (curve 4) is increasing much more slowly than the rate of technical progress in ideas, research, and design development. This is one reason for the increase in recalls, product failures, and product liability litigation.
Too often, upper management in organizations is reluctant to invest the funds and other resources needed for testing development. Testing is viewed as a cost center that is to be contained rather than an investment that will return profit through loss avoidance and reduced risk and liability. It is far easier for managers to envision new and innovative product design as the path to investment returns. Unfortunately, as a result, many companies have lost a lot of money in the long term from recalls, complaints, and higher costs, such as redesign or production changes, than was predicted by the design and manufacturing teams. Lev Klyatis previous publications provide examples of this.
Figure 3.6 also helps one understand why three of the four basic approaches of accelerated stress testing currently used frequently lead to inaccurate prediction (1, 2, and 3 in Figure 3.2).
When the initial information used for reliability calculations is poor, the results are likely to be poor. For example, many companies still use single‐axis vibration testing today, as was done for more than the last fifty years. An associated factor is progress in the development of vibration testing equipment also depends on the speed of technical development in the area of electronics which is heavily used in test equipment's systems of control. A second big difference is that what was called vibration testing fifty years ago is now often mistakenly called reliability testing. This can be read about in Accelerated Reliability and Durability Testing Technology[2]. A similar situation exists in accelerated corrosion testing. Until recently, only chemical pollution from a single chemical was evaluated, while in the real world there are many chemicals and field conditions present simultaneously, as is shown in Figure 3.9. These are but two of many examples. Figure 3.7 shows the interactions of actual field input influences on failures. Further details can be found elsewhere [2,3].
Figure 3.7 The path from field input influences to failures.
3.2 The Role of Field Influences on Accurate Simulation
For a better understanding of the path depicted in Figure 3.7, it is important to remember the following.
All types of laboratory and proving‐ground testing supposedly duplicate the real‐world conditions, but:
this testing often does not accurately reflect real‐world conditions; and
accelerated testing, because it simulates testing faster and/or higher stress levels than in the real world, is also different from actual real‐world conditions.
There are different levels of simulation. Higher level (more accurate) simulation leads to better testing results, and will produce a more successful prediction.
Step‐stress testing is not an accurate simulation, because it generally does not simulate the real conditions of the field situation. Therefore, prediction based on step‐stress‐testing‐indicated reliability may be very different than real‐world reliability.
As a result, field use will result in:
a greater number of failures than was predicted after testing during design and manufacturing;
more recalls, complaints, and other problems.
As another example, consider commonly used simulations of vibration and corrosion testing. As can be seen in Figure 3.8, while vibration in the field is accompanied by many input influences, usually vibration testing in the laboratory considers only one of these influences—usually the surface profile of the operating terrain. But failure may be a result of other inputs that are present in the actual conditions, and the effects of these other factors then leads to laboratory results different than field results. The final result is unsuccessful prediction. These are the reasons one needs to simulate all relevant influences, as shown in Figure 3.8, for accurate simulation of the field vibration effect of a mobile test subject.
Figure 3.8 Factors in the vibration of a mobile test subject in the field.
In a similar manner, let us consider accelerated corrosion testing. Corrosion in the field depends on two groups of interconnected influences (Figure 3.9) multi‐environmental and mechanical. The multi‐environmental group consists of chemical pollution, mechanical pollution, moisture, temperature, and so on. Mechanical influences consist of deformation, vibration wear, friction, and so on. Therefore, for an accurate simulation using an accelerated corrosion process in the laboratory, one needs to simulate the complex input influences. Instead, if one simulates only chemical pollution influences, the predicted results are not likely to be accurate.
Figure 3.9 Principal scheme of corrosion in the field as a result of multi‐environmental and mechanical influences, and their interactions.
The full array of the interacted field input influences on a mobile product is depicted in Figure 3.10, while Figure 3.11 depicts the influences that need to be considered for an accurate simulation of temperature effects.
Figure 3.10 Depiction of the various input influences that must be accounted for based on actual field conditions experienced by the product.
Figure 3.11 Scheme of the study of temperature as an example of input influence on the test subject.
Further, most products usually consist of a series of interconnected components that, in the real world, interact with each other. Therefore, these component interactions must also be taken into account for accurate simulation, including all the aspects and the full operational range of each input influence, as shown in the example of temperature simulation depicted in Figure 3.11. These can be seen in greater detail elsewhere [2].
For accurate real‐world simulation it is necessary to take into account the interactions of not just the unit or product, but also how the unit or product interacts with other elements of the completed functional unit or product, as is shown in Figure 3.12. For example, if the company is designing and manufacturing transmissions for the automotive industry, one needs to take into account that the transmission, first, does not work separately and, second, interacts with the vibrations of the product, as well as other components of the completed car or truck. Unfortunately, companies often do not take this into account.
Figure 3.12 The full hierarchy of the complete product and its components as a test subject.
This is one of the basic causes as to why reliability during stress testing (or other types of ALT) is different from reliability in the field. There are many other problems in using ALT that are not discussed here, (but considered in [2]) and why it is our belief that ART/ADT is a better approach to improving reliability prediction.
3.3 Basic Concepts of Accelerated Reliability and Durability Testing Technology
ART and ADT was described in detail in Accelerated Reliability and Durability Testing Technology[2]; therefore, only the basic concepts of this type of testing are detailed here.
ART/ADT consists of two basic components (Figure 3.13). The first basic component, accelerated laboratory testing, as shown in Figure 3.14, includes the interconnected groups of multi‐environmental testing, mechanical testing, electrical (electronic) testing, testing for assuring product safety (e.g., crash testing), and so on. These must act simultaneously, as they do in the field. The second component of ART/ADT, periodic field testing, is shown in Figure 3.15.
Figure 3.14 Basic components of accelerated laboratory testing as a component of ART/ADT.
Figure 3.15 Periodic field testing as the second major component of ART/ADT.
Thus, ART and/or ADT includes all of the following:
the basic concepts of a strategy for development of accurate physical simulation of the interacted real‐world conditions;
the principles of a system of controls that will provide physical simulation of the random input influences on the actual product;
development of the equipment needed for the specific ART of the product;
control mechanisms for the simulation processes, output variables, and degradation processes;
managing and conducting ART/ADT for the product by trained and qualified personnel.
It is important for everyone to understand that reliability is not a separate performance component, but it interacts with all of the other performance components, such as durability, maintainability, supportability, life‐cycle cost, safety, profit, recalls, and so on, as is discussed further in Successful Accelerated Testing[4]. Also, for accurate simulation of field conditions, it is necessary to account for the human factors, such as the way the operator and the way management will actually use the product which often is not necessarily as instructed by the operator's manual, as these also have an impact on the product reliability. These factors are depicted in Figure 3.16.
Figure 3.16 Demonstration of the influence of management and operator's reliability on the product/technology reliability [2].
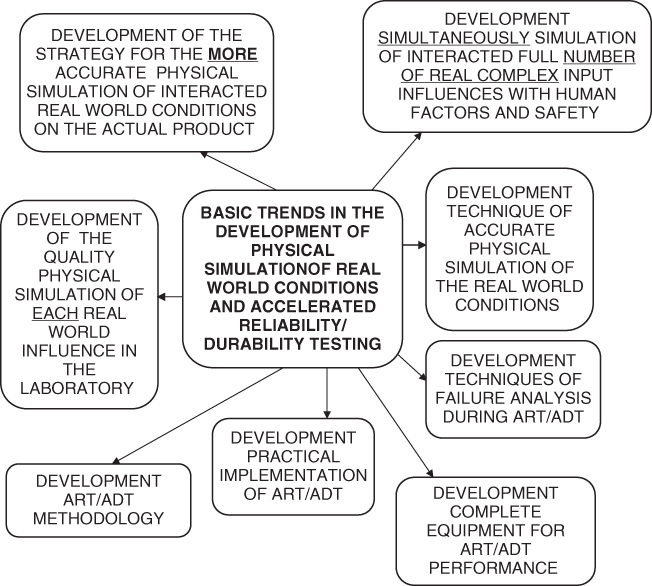
Further aspects of this issue have been published elsewhere [2–5]. Some components of these concepts can be seen herein. Figures 3.17 and 3.18 demonstrate some of the specific aspects needed to produce accurate physical simulation of field conditions. It must also be noted that this simulation, as well as ART/ADT, is continuing to evolve. The basic trends of these simulations and testing are shown in Figure 3.17, which shows that the basic step is the accurate physical simulation of the field conditions. This is the first basic step one needs for successful reliability prediction. Without a clear understanding of conditions, successful implementation of accurate reliability prediction is not possible.
Figure 3.17 Schematic trends in development of physical simulation of the real‐world conditions and ART/ADT.
Figure 3.18 Some reasons for low engineering culture.
Once the first step of accurate physical simulation has been completed, the second step is conducting ART/ADT. But, in order to do this, it is also necessary to understand the trends in the development process as shown in Figure 3.17. This development process must be connected closely with the development of an engineering culture (including organizational). Figure 3.18 depicts some of the cultural problems in many organizations that must be overcome to obtain this goal. These are discussed in greater detail in Successful Prediction of Product Performance[5].
Unfortunately, some of the reasons for this is that, in the past, professionals in testing and design have not provided accurate simulation of the field performance. As a result, management does not have faith or confidence in providing the necessary backing and resources to improve testing. Better results provided by ART can help to overcome this perception.
3.4 Why Separate Simulation of Input Influences is not Effective in Accelerated Reliability and Durability Testing
It was the many years of practical experience in reliability and durability testing, including field and laboratory testing and their effectiveness, that helped authors to understand the importance of real‐life conditions that needed to be simulated in the laboratory for effective reliability predictions. The key element is the need to simulate accurately real‐world conditions. This experience clearly demonstrated how real‐world conditions interact with each other, and how important it is to take into account these interactions for accurate simulation of the field situation. For example, while it was easily understandable that temperature and humidity do not act separately from pollution, radiation, and other environmental factors, similar interdependencies also exist with electrical, mechanical, and other interacting groups of influences. From this field testing experience and researching the literature about field conditions, it became possible to understand and discern which interactions were meaningful, and which were not.
And from experience with the SAE World Congresses, as well as Reliability and Maintainability Symposiums, ASQ World Conferences, IEEE Workshops in Reliability, ASAE Annual International Meetings, and other meetings and publications [6–18], it could be seen that many of the authors of the papers often did not carefully analyze the field conditions. Knowledge of these conditions is needed to accurately simulate in the laboratory, and to obtain accurate information of reliability, quality, and durability of their test subjects in the real world during the product service life or some other specified time or use. (also see the websites of MTS (https://www.mts.com/en/index.htm), K.H. Steuernagel (http://www.aikondocdesign.com/KHS/khspg2.htm), and Arizona Equipment (http://www.awsequipment.com)). The input influences of real‐world conditions acting on a test subject are shown in Figure 3.19. As can be seen from this figure, they interact with each other, and the character of these interactions affects product reliability, durability, safety, and other performance measures.
Figure 3.19 Interconnected group of real‐world input influences on test subject.
And these interactions relate to all areas: industrial (automotive, aircraft, aerospace, electronic, and so on), medical, social, and so on with the understanding that, for different products, there are different groups and severities of these input influences.
Figure 3.20 depicts the multi‐environmental group of input influences. For accelerated testing to be useful as a basis of a test, it needs to accurately simulate the real‐world specific input influences shown in Figures 3.20 and 3.21. It is important to remember that in the real world the input influences never act separately, and similar situations exist with product degradation processes in the field.
Figure 3.20 Multi‐environmental group of input influences.
Figure 3.21 Example of content of interacted components of mechanical group of input influences.
The book Accelerated Reliability and Durability Testing Technology[2] goes into further detail as to other groups of input influences. Often, there is a misunderstanding of the difference between reliability testing and other types of testing, such as combined, step‐stress, vibration, corrosion, and many other types of testing [16–18]. This misunderstanding often leads to significant differences between the laboratory testing results and field performance of the product.
But the basic problem is still that the separate simulation of field input influences is not effective. Let us consider this problem.
It was understandable that, for example, temperature and humidity do not act separately from pollution, radiation, and other environmental factors. Similar situations exist in electrical, mechanical, and other groups of influences. A second example, that is also understandable, is that the corrosion process is the result of many factors – chemical, mechanical, and so on. This is understandable from both experience and from advanced literature. Field testing experience was an essential element in helping to better understand which literature about field conditions and their actions is reliable and which is not.
An important aspect necessary for the solution of this problem is the correct understanding of the terms and definitions used in this scientific discipline.
For successful simulation and the ability to achieve dependable reliability and durability testing, and ultimately to obtain the true objective successful reliability prediction, it is very important that there be a correct understanding of these terms and definitions. To obtain this goal, the terms and definitions that are included in the referenced books Accelerated Reliability and Durability Testing Technology[2] and Successful Prediction of Product Performance[5], as well as the standard definitions presented in Chapter of this book, should be used consistently.
From experience, before conducting accelerated testing one should understand the following:
Worldwide, professionals are conducting accelerated testing in different areas of industry, but the basic problem remains that more accurate simulation of actual field conditions is needed. This problem persists as of the time this book was written.
For simulation processes to be effective, you need to know precisely what needs to be simulated and how to accurately simulate complicated real field conditions. Clear answers to questions such as what kind of field conditions need to be simulated, and how to evaluate the accurateness of the simulation compared with real world conditions, are needed.
From experience as a field test engineer, it is important to include the analysis of field conditions acting on the product in written reports of the testing. These reports provided benefits to designers. Often, it is found that such information is not included in reports by colleagues and other test engineers.
During the preparation of author's PhD dissertation, author's research into improving harvesting technology included experimental research on how changing the influence of different field conditions impacted the product, how they interacted with each other, and, finally, how these interactions influenced the research results. This knowledge came from careful analysis of the real field situation. A major problem is many people involved in research, design, testing, and manufacturing of products do not have enough experience in field testing and research. Too often their only experience is with laboratory research and testing.
To a similar degree, those involved in the design phase did not know (and often still do not know) enough about the real field conditions, and how they influence product quality, reliability, durability, and interact with other performance components. Throughout the design, testing, and manufacturing processes, these professionals still spend too little time actually in the field conditions. As a result, they do not understand how important this real experience is to developing a successful product. Figures 3.19 and 3.20 demonstrate examples of the interactions of various field influences.
Generally, there are several groups of input influences acting simultaneously on the test subject. The input influences of real‐world conditions acting on the test subject is shown, as an example, in Figure 3.19. Product reliability, durability, safety, and other performance components are influenced by the level of success of the prediction which depends on the character of such interactions.
The aforementioned concepts can be applied to all products in all areas: automotive, aircraft, aerospace, electronics, and so on.
While the overall concepts remain the same, the specifics for different products are often related to different groups of input influences. As an example, Figure 3.20 demonstrates the multi‐environmental group of input influences.
In order for accelerated testing to be useful as a basis of testing, it must accurately simulate the real‐world input influences, as shown in Figures 3.20 and 3.21.
In the real world, input influences never act separately. A similar situation exists with the product degradation process in field operations. For example, the corrosion process in the field is often a result of the interaction of several different types of field input influences.
Figure 3.9 illustrates corrosion as result of interaction of two groups of field input influences: multi‐environmental and mechanical. In this illustration, the multi‐environmental group consists of the interaction of chemical pollution, mechanical pollution, temperature, humidity, and so on. The mechanical group consists of vibration, deformation, friction, and so on. Accurate simulation of the field corrosion process can only be simulated accurately in the laboratory if these field conditions are accurately simulated.
But many corrosion test chambers available in the market only simulate chemical pollution. This is an example of inaccurate simulation of field conditions for the same basic reason—without accurate knowledge of the field conditions you cannot know what to simulate in the laboratory. This results in inaccurate ART and ADT, which then negatively affects product quality, reliability, durability, and other performance metrics, which then can lead to economic losses, recalls, and other negative impacts of the new products or technologies.
Another element needed to provide an accurate simulation of real‐world conditions is understanding that in the real world the test subject (engine, transmission, and so on) is not a discrete and independent unit, but is a component that works in conjunction with other parts of the entire product or the entire machine, as is depicted in Figure 3.12. While all of these input influences interact on the completed machine, too often testing is only done for the part or component.
Unfortunately, many companies who are suppliers that design and manufacture components for a completed machine only test for their part or components. For example, a transmission manufacturer may test their transmission for vibration, but without knowing the effects of the engine and driveshaft as encountered in the real world they do not have an accurate simulation for predicting product reliability. This is especially important for accurate physical simulation of mobile machinery.
Practical implementation of this requires involving a group of engineers and staff who have in‐depth knowledge of the interactions of these attached components or a team approach to testing the product with its attachments.
Early in his career, the author was in the position of an engineer and was not able to implement many of these ideas. Later, when the author achieved a management position, he was able to implement these concepts and improve the reliability predictions of the entire unit. It is his firm belief that too many professionals involved in laboratory testing do not understand the need to perform laboratory testing with accurate simulation of the interaction of multiple field influences.
You can see reliability testing being performed in many American, Japanese, European, and other countries based on results obtained from separate vibration testing and separate corrosion testing using test chambers accounting for one influence only. This is also prevalent in climatic (simulation temperature plus humidity) and many other types of testing. There are two basic reasons for this situation:
First, the perception that the testing and experimental research process will be cheaper and simpler. While this may appear to minimize testing and developmental costs it fails to account for the future losses attributable to the imprecise testing. Unfortunately, these avoidable losses are difficult or impossible to predict and quantify; and, the testing unit is often not deemed responsible for them, as was demonstrated earlier in this book.
Second, because they do not take into account the influences and interactions that are present in the real world, they never know how well the tested product actually works in the real world. Also, the testing group often does not receive meaningful feedback on a tested product's problems or performance.
As a result, the degradation of the product in the laboratory (during testing) is different from the actual degradation in field use, and too often the final results are complaints, recalls, losses in projected profit, customer dissatisfaction, litigation, and other economic and technology problems.
Unfortunately, this is an all too typical situation resulting from narrow thinking by management. These test systems (ART/ADT technology) provide the ability to find the causative factors that result in low reliability and durability, and thereby avoid or greatly decrease the costs of remediating problems. Consider one example. By accurately simulating in the laboratory the basic field influences, one can study and understand the prevalent degradation processes. And because the testing can use high‐speed projecting machines, which expose the product to degradation at a much faster rate than occurs normally, studying and predicting the degradation processes and the ability to make product improvements becomes possible. These processes cannot be done in the field, because the machinery often works in dusty conditions, with a lot of mechanical pollution. It is possible in the laboratory to use many types of apparatus that cannot be used in the field for studying the degradation process. But this can be effective only if one is simulating accurately in the laboratory the field conditions. Many companies do not, or cannot do this.
Chapter details some practical examples of successful implementation reliability testing and prediction. Finally, in this chapter let us briefly consider the cost versus benefit of ART. For this we will use the situation where there is simultaneous combination of different types of input influences, and compare this with single testing, where there is separate simulation of input influences. The cost of the equipment, methodology, and staff time for conducting single tests—for example, separate vibration testing, or corrosion testing, or temperature plus humidity testing, or testing in dust chambers, or input voltage plus vibration testing, and so on—may appear to be less expensive than reliability testing using a combination of all the above types of influences.
This is correct if you only consider the direct costs of the two approaches. But we know the quality of the testing impacts many other costs, such as those related to subsequent processes, including design, manufacturing, usage, service, and so on. For example, the reasons (and costs) for returns, recalls, service bulletins and product modifications are often associated with the poor accuracy of the testing. One must also take into account all the costs associated with future changes in the safety, quality, and reliability during the life of the product. Failure to accurately simulate interacted real‐world influences on the product leads to increasing expenses for returns, recalls, and customer confidence and acceptance of the product.
From experience in consulting for many companies, when a test engineer in vibration testing is asked what is the goal and objective of their testing, the usual answer is “reliability.” But this answer is wrong; the product's reliability depends on more than the results of vibration testing.
Let us demonstrate an example of poor testing results on the vibration testing of an electronic product. The following example was published in 1999 in the Tutorial Notes of the Annual Reliability and Maintainability Symposium [19]:
In today's stress testing environment, there are two predominate methods for delivering vibration energy to units under test (UUTs): Electrodynamic (ED) shakers and Pneumatic or Repetitive Shock (RS) vibrators, also known as six Degrees of Freedom (DOF) shakers.
ED shakers require a controller to produce an electrical signal, which is fed to a high power amplifier that drives the coil. ED systems are very flexible in that they provide excellent control of the vibration spectrum and can provide sine, swept sine, and shock as well as random vibration. The major disadvantage is their inability to produce multi‐axis simultaneous vibration. Some manufacturers overcome this by orienting multiple shakers orthogonal to one another. This configuration is very expensive and generally not applicable to combined environmental testing.
A popular alternative to ED vibration is referred to as 6 DOF or Repetitive Shock vibration. In this application, multiple air driven hammers are mounted to the bottom of a vibration table in orientations that transmit energy in the x, y, and z directions as well as rotational energy about each axis (hence the term six degrees of freedom). Compared to a comparably priced ED system, RS can attain higher g levels and can handle more product mass. The major disadvantage is that the frequency distribution of the vibration spectrum produced by RS cannot be easily controlled. Power sources should be capable of delivering power over the full specified voltage input range of the product under test.
The foregoing relates to the recent time and is only one more example of how low quality of simulation is an obstacle for successful prediction of reliability. Similar situations relate to presentations at the SAE World Congresses, Quality Congresses, and other conferences.
But vibration is only one component of mechanical testing (influences). In the real world the varied mechanical influences act in combination with multi‐environmental influences, electrical and electronic influences, and so on. The product's reliability, whether measured by the degradation process, time to failures and between failures, cost of failures, and so on, is a final result of all field input influences in action, and coupled with human factors. Without accounting for these influences one cannot successfully predict the product's reliability.
As a result of poor prediction, during use unpredicted accidents or failures, and increased cost of use can be experienced, which, through the cost of returns, the costs of improvement to the design and manufacturing processes, and other costs such as lost customers, recalls, and litigation produce significant, and unanticipated organizational losses. The book Successful Prediction of Product Performance[5] details how, over 30 years, recalls in automotive industry have increased, which leads to increasing losses measured in billions of dollars.
When these costs are considered, it is evident that accurate accelerated reliability (or durability) testing is more economical to the organization than single testing with simulation of only separate influences. Detailed consideration of this problem, with examples, can be found in the book Accelerated Reliability and Durability Testing Technology[2]. In conclusion, because of the cost of subsequent problems, single testing with simulation of discrete input influences is more expensive than ART/ADT simultaneous combination, even though the testing cost may be higher.
As demonstrated in Figure 3.3, there is no easy path to transition from traditional ALT, which does not provide the information needed for successful reliability prediction to ART/ADT, which does offer this possibility. This path requires qualitative (accurateness of interactions) and quantitative (increasing number of field inputs) simulation as detailed in the literature [20–24].
References
1 Hobbs GK. (2000). Accelerated Reliability Engineering: HALT and HASS. John Wiley & Sons.
2 Klyatis LM. (2002). Accelerated Reliability and Durability Testing Technology. John Wiley & Sons, Inc., Hoboken, NJ.
3 Klyatis L, Klyatis E. (2006). Accelerated Quality and Reliability Solutions. Elsevier.
4 Klyatis L, Klyatis E. (2002). Successful Accelerated Testing. Mir Collection, New York.
5 Klyatis L. (2016). Successful Prediction of Product Performance. Quality, Reliability, Durability, Safety, Maintainability, Life Cycle Cost, Profit, and Other Components. SAE International. Warrendale, PA.
6 SAE 2005–2016 World Congress & Exhibition. Event Guides.
7 SAE 2012–2016 AeroTech Congress & Exhibition. Event Guides.
8 ASQ 2006–2016 World Conferences on Quality and Improvement. Program.
14 ASAE (The International Society for Engineering in Agricultural, Food, and Technological Systems) 1994 Winter & Summer Meetings. Final Programs.
15 Annual Reliability and Maintainability Symposiums. The International Symposium of Product Quality & Integrity. Proceedings, 1997–2002, 2012.
16 Kyle JT, Harrison HP. (1960). The use of the accelerometer in simulating field conditions for accelerated testing of farm machinery. In Winter Meeting, ASAE, Memphis, TN. ASAE Paper No. 60‐631.
17 Briskham P, Smith G. (2000). Cycle stress durability testing of lap shear joints exposed to hot–wet conditions. International Journal of Adhesion and Adhesives 20: 33–38.
19 Chen AH, Parker PT. (1999). Tutorial notes. Product reliability through stress testing. In
Annual Reliability and Maintainability Symposium, January 18–21, Washington, DC.
20 Klyatis L. (2014). The role of accurate simulation of real world conditions and ART/ADT technology for accurate efficiency predicting of the product/process. In SAE 2014 World Congress and Exhibition, Detroit, paper 2014‐01‐0746.
21 Klyatis LM. (2011). Why current types of accelerated stress testing cannot help to accurately predict reliability and durability? In SAE 2011 World Congress and Exhibition, paper 2011‐01‐0800. Also in book Reliability and Robust Design in Automotive Engineering (in the book SP‐2306). Detroit, MI, April 12‐14, 2011.
22 Klyatis L, Vaysman A. (2007/2008). Accurate simulation of human factors and reliability, maintainability, and supportability solutions. The Journal of Reliability, Maintainability, Supportability in Systems Engineering (Winter).
23 Klyatis L. (2006). A new approach to physical simulation and accelerated reliability testing in avionics. In Development Forum. Aerospace Testing Expo2006 North America, Anaheim, CA, November 14–16.
24 Klyatis LM. (1998). Physical simulation of input processes for accelerated reliability testing. In The Twelfth International Conference of the Israel Society for Quality (proceedings on the CD‐ROM. File://F//Images/Dec982S.htm, pp. 1–12), Jerusalem, December 1–3, abstracts, p. 29.
Exercises
3.1
Show schematically two basic aspects of testing detailed in this chapter.
3.2 Show the scheme of basic approaches to accelerated testing. How many are there?
3.3 Why is only one approach considered in this book?
3.4 Show the scheme of the actual path from traditional testing with simulation of separate or several input influences to ART/ADT.
3.5 Why is HALT or HASS incorrectly called reliability testing?
3.6 Show graphically the rate of technical progress over time comparing the speed of ideas and research, design, manufacturing, service, and testing.
3.7 Why is the speed of technical progress in testing lower than these other areas?
3.8 Show schematically the differences from traditional accelerated testing to ART/ADT.
3.9 List some of the other factors that influence vibration in the real world.
3.10 What factors should be included in laboratory vibration testing? Why is testing only for vibration not accurate?
3.11 List some of the factors that influence corrosion in the field.
3.12 What factor is generally used for simulating corrosion testing in the laboratory. Why is this wrong?
3.13 List some of the input influences on mobile machinery in the field.
3.14 Describe how other components of a complete vehicle connect with each other and must be accounted for in field simulations.
3.15 What are the basic components of ART/ADT?
3.16 What kind of basic components are part of ART/ADT?
3.17 Why is periodic field testing a necessary component of ART/ADT?
3.18 Why are factors such as management and operator reliability needed for product reliability?
3.19 List some of the basic trends in the development of physical simulation of real‐world conditions.
3.20 Why is it this author's belief that the lack of an engineering culture is a significant factor in their reluctance to improve testing?
3.21 Why are separate simulation of field influences not effective in ART/ADT?
3.22 List some of the basic groups of input influences acting on mobile products in the field.
3.23 List some of the interacted factors of multi‐environmental group of input influences that constitute the field.
3.24 List some of interacted factors that constitute a mechanical group of input influences in the field.
3.25 List some of interacted factors that constitute an electronic group of input influences in the field.
3.26 List some of interacted factors that constitute an electrical group of input influences in the field.
3.27 What costs are frequently overlooked in accounting for the cost of testing?