CHAPTER 12
Align Performance Measures with the Strategy
PERFORMANCE MEASUREMENT POSES SEVERAL unique challenges for supply chain management. Executives and managers need to understand how the supply chain affects performance within their firm. In most instances, external trading partners have a major effect on how and why a firm performs certain activities. Executives and managers must understand how their internal performance affects the performance of their trading partners and the different activities that are performed by upstream suppliers or downstream customers. All trading partners should realize that their supply chain is competing against other supply chains for the share of wallet or purse of the customer at the end of the supply chain, and the purchase price will matter to that customer.
An understanding of these interactions requires a significant exchange of information—the right information between firms. The information must be specific to the relationship and clearly demonstrate how interactions between the supply chain and the firm affect performance in both directions. In addition, executives need the ability to translate nonfinancial performance into financial value creation for the firm, its stockholders and owners, and for the firm's trading partners in the supply chain.
The ability to translate improved process performance into value makes a compelling argument when attempting to persuade trading partners to align their business practices with supply chain objectives. Executives and managers across the supply chain need to understand how changing business practices will affect nonfinancial performance, such as cycle time, product availability, quality, on‐time delivery, customer satisfaction, or obsolescence. They also need to understand whether aligning their performance will create additional value for their firm. A key part of this alignment process requires that managers reexamine the nature of their supply chain costs and select or modify the tools used to capture cost information in ways useful to supporting decision making. As different costing tools are incorporated into the supply chain cost management process, performance measures need to evolve. Likewise, as trading partners collaborate and align performance, additional insight will be required regarding how changes in the supply chain are affecting performance, costs, and value.
LINKING COST AND PERFORMANCE
Supply chain costing can provide management with better capability to translate supply chain performance into financial performance. Effective supply chain management does more than reduce cost. It creates value for the end user and other stakeholders. Although cost reduction is a highly desirable result, supply chain management can create value by increasing sales, gaining additional market share, reducing inventory, or improving asset productivity. The cost drivers embedded in supply chain costing can be used to demonstrate how supply chain process changes will impact the four components of the value equation: revenues, cost of goods sold (COGS), expenses, and assets. This is illustrated in the section linking costs, performance, and value found later in this chapter.
Supply chain costing must be linked to the performance measurement system. The linkage is necessary to ensure that supply chain costing is not implemented in isolation from other factors such as quality and throughput cycle time. Linking supply chain costing to performance measures means managers will focus more on understanding their costs and what drives cost in their organization. The combination of cost and performance information represents a major step forward in cultivating a cost‐conscious culture within the firm.
Sharing nonfinancial information is and will remain a critical part of supply chain processes. The capability to translate nonfinancial information into financial information is essential because the language of senior executives is finance. Key decision makers will require that the value created through supply chain management be measured and sold in financial terms. The translation will also help gain acceptance from trading partners. Firms affected by a proposed change in a supply chain process will need to be convinced of the financial merits of the change. Demonstration of improved financial performance will be especially important when additional costs or investments are required by the trading partner. The use of tools such as the balanced scorecard (BSC) can facilitate this process.
Measuring the financial benefits and burdens resulting from supply chain initiatives will help determine if they are being equitably allocated across trading partners. An equitable allocation does not necessarily mean equal and should be based on the level of investment, risk, and performance. Measurement can help ensure that the supply chain is producing financial performance consistent with the strategic objectives of the firm and other trading partners.
Selecting good supply chain performance metrics, doing appropriate measurement, and acting on the measurements is an essential part of the supply chain costing journey. The measures should increasingly focus on process and give managers clues about what may happen, that is, be leading indicators. Activities throughout the organization (and ideally across the supply chain) that relate to a particular outcome are the focus of these measures. The performance measurement system should emphasize problem solving through the use of root cause analysis and attempting to eliminate the cause of the problem. Value is created by having multiple groups across functions and organizations actively collaborating on measures and performance analysis.
Issues with Many Existing Performance Measures
There is still a strong emphasis on short‐term performance measures and many examples of how this emphasis conflicts with efforts to improve supply chain management. However, managers understand the importance of having a broad variety of real‐time measures in place to support efforts to improve modern supply chain processes. Financial and nonfinancial measures that broaden management focus beyond monthly or quarterly results and support strategic supply chain decisions are essential, and will require changes in existing performance measurement systems. However, even when strong incentives to change exist, implementation is a major challenge. Change is even more problematic if top management is not viewed as “walking the talk.”
When performance measures do not align with an entity's objectives and strategies, they often drive the wrong type of behavior. The result is higher supply chain costs and at least a partial failure in supply chain management. Exhibit 12.1 includes several examples of what can happen when there is misalignment between internal performance measures and supply chain objectives. Operating managers often react to performance measures that are not linked to the organization’s strategic plan. As the examples show, failure to link measures with objectives will produce situations where managers respond inappropriately or drive the wrong behaviors in the organization. Often the performance measures are not forward looking and thus are of little help in improving processes. Even worse, top management is often unaware of the extent of this disconnect or misalignment.
EXHIBIT 12.1 Disconnect between Performance Measures and Supply Chain Management Objectives
| Inferior quality goods are shipped at period end to meet an area's quarterly revenue or tonnage targets. Additional costs are then incurred in the next quarter to have the goods returned, ship the right quality of goods, and interact with the customers who received the inferior goods. |
| Customer support is charged with responding to customer questions and inquiries. Staffing levels are cut to meet wage budget targets. Calls and electronic inquires are then not responded to on a timely basis, problems escalate from minor to major, and existing and potential customers are lost or order less. |
| To meet raw material purchase price standards purchasing managers severely pressure a critical supplier to accept unreasonably low selling prices in a weak economy. As demand rises the supplier is unwilling or unable to provide the additional materials the firm needs. The firm becomes that supplier's customer of last choice. |
| Critical shipments to customers are delayed so the shipping manager can meet percentage targets for full truckload deliveries. The customer must shut down production because of missing goods and classifies the shipping firm as an unreliable supplier. The customer significantly lowers future orders. |
| Critical company infrastructure expenditures are delayed to avoid increasing depreciation costs that would keep the company from making this year's target profit. The company is then forced to pay a premium for the space and equipment needed to support next year's demand for services because of the construction delay. |
| Production is outsourced based on a promise of lower labor costs. Control over quality and production timing is lost, delivery costs soar, and the time spent managing the production process increases dramatically. Overall costs increase. |
| R&D personnel receive a bonus for developing a cheaper product component. The production department must incur higher costs to handle the fragile component and control the toxic waste it releases during production. |
One common characteristic of these examples is that an action is taken that makes an employee or functional area look good in the short run, but has negative long‐term consequences to the firm because there is a misalignment in performance measures and supply chain objectives and strategies. Such results occur when senior managers focus too extensively on short‐term financial results. Responding to questions about variances and budget shortfalls seldom results in systematically changing future performance. These efforts are not linked to strategy and systemic cost improvement. Instead, managers modify what they do to avoid having to deal with questions about variances and budget differences. The result is little or no process improvement.
Another characteristic of these examples is that the performance measures are narrowly focused on a function or small part of a function. To effectively manage supply chain costs, performance measures must support cost management efforts that extend outside the functional area, and even outside the organization. Appropriate measures should exert the right type of pressure to reduce costs throughout the internal and external supply chain.
Performance measures should increasingly focus on information that helps manage supply chain processes across functions and organizations. Measures cannot stop at departmental, functional, or even organizational boundaries. If they do, suboptimization typically results. Lean organizations are process oriented and focus on customers and suppliers (internal and external). Performance measures need to reward cooperation and long‐term decision making. They should reward actions that help identify root causes and implement solutions to problems. Partnering with other parts of the supply chain is essential to remove waste, increase flexibility, and become more responsive. Work is being done in teams and performance measures must find ways to reward teams, not individuals. There is a need to benchmark activities and link the results to performance evaluation.
LINKING SUPPLY CHAIN COSTING TO PERFORMANCE MEASUREMENT
Supply chain costing provides both a cost and performance view of the processes and activities comprising the supply chain. Processes affected by supply chain initiatives can be mapped to identify the activities and corresponding cost drivers. After identifying these activities, supply chain costing determines the activity costs based on the resources consumed from each trading partner (see Exhibit 12.2). The use of multiple cost drivers supports a more accurate determination of costs and assignment to products, customers, or supply chains.

EXHIBIT 12.2 Supply Chain Costing—Cost Assignment and Identification of Activity Cost Drivers
Using cost drivers, supply chain costing establishes a cause‐and‐effect relationship between the activities and the factors driving activity costs and performance outcomes (see Exhibit 12.3). Managers can identify how supply chain initiatives affect activities across the supply chain. They can target those factors driving cost and performance and take action to achieve the desired outcome. By expanding this view across the supply chain, each trading partner can develop and align performance measures that are consistent with the overall supply chain process objectives. Supply chain costing increases management's understanding of how the interactions occurring between trading partners affect overall performance by breaking down the process in measurable activities, developing performance measures, and identifying what actually drives performance and cost.
The combination of supply chain cost and performance information can directly support management decision making. The information visibility permits a supply chain–wide assessment of how activities performed by multiple trading partners interact to affect cost and performance. Managers can employ new strategies by reconfiguring processes to drive changes in the activities and how they are performed within each firm. Supply chain costing captures the effect of these changes on performance, translates the changes into costs, and, when coupled with economic value added (EVA), updates the changes into financial performance.

EXHIBIT 12.3 Using Cost Drivers to Develop Supply Chain Process Performance Measures
Source: Adapted from Gary Cokins, Activity‐Based Cost Management: An Executive's Guide (John Wiley & Sons, 2001), Figure 2.17, p. 67.
USING THE SUPPLY CHAIN COSTING FRAMEWORK TO TRANSLATE SUPPLY CHAIN PERFORMANCE INTO FINANCIAL PERFORMANCE
Combining supply chain costing with an economic value added (EVA) model provides a mechanism to convert supply chain performance into financial performance. Supply chain costing is used to examine the interdependence of supply chain activities and, using cost drivers, to quantify performance into specific activity costs and measures. The EVA model incorporates these cost changes with changes in sales, costs, and assets to determine the effect on value creation in the firm and in trading partners across the supply chain. A positive EVA indicates management created value for the firm by generating profits in excess of the cost of assets employed. A negative EVA suggests managers destroyed value since profits did not cover the cost of assets.
Larger firms often have cost systems capable of tracing costs to activities and processes and use EVA to determine the value created in their firms. Limited visibility regarding their trading partners' costs and financials result in these firms not using EVA to measure value creation outside the firm. However, supply chain managers increasingly recognize that they need to be able to measure and sell the value created through supply chain initiatives, not only to their leadership team but also as a means to develop a compelling argument for their trading partners to collaborate.
Supply‐Side Value Analysis
A value‐added analysis can be extended to integrate the cost and performance information obtained through supply chain costing into a single framework. Exhibit 12.4 shows the supply side of this extension. The model on the left is shown from the supplier's perspective and is linked with value drivers and aligned performance measures.
Value drivers link to each of the major components of the EVA equation. The sales value drivers identify how changes in supply chain processes affect revenue growth through better understanding end‐user requirements, aligning performance and resources more closely with strategy and target markets, and collaborating with downstream trading partners to reduce their costs.
The cost of goods sold (COGS) can be impacted through kaizen costing and value engineering to reduce costs internally, while target costing can drive cost reductions during product design and development with upstream suppliers. Expense value drivers address many of the inbound and outbound costs captured in landed cost or customer profitability analyses. For example, by improving the order fulfillment process or optimizing the transportation network, supply chain professionals would reduce costs for the firm and have a direct effect on EVA.
The supply chain can affect the firm's charge for assets by reducing average inventory levels, accelerating payments, and improving asset utilization through improved demand visibility and the sharing of marketing, production, and product development information among trading partners.
The linkage demonstrates how improved supply chain performance at the activity level affects the corresponding value driver and leads to value creation and increased profitability within the firm. Managers can develop performance measures at the operational level that align behavior with the value drivers.

EXHIBIT 12.4 Developing and Aligning Corporate Performance Measures with Supplier Value Drivers and Supply Chain Objectives
Source: Adapted from Douglas M. Lambert and Terrance L. Pohlen, “Supply Chain Metrics,” The International Journal of Logistics Management 12, no. 1 (2001), p. 14, © Copyright Douglas M. Lambert. Used with permission. For more information about the SCM Framework see drdouglaslambert.com.
Customer‐Side Value Analysis
An analysis from the customer's perspective provides the mirror image of how collaborative action drives value for downstream trading partners in the supply chain (see Exhibit 12.5). Revenue value drivers include increased sales generated through lower prices, increased product availability, the introduction of new technology, the codevelopment of new products with the supplier, and improved customer service. Price reductions in COGS may occur as the supplier passes along a lower price reflecting the reduced costs of doing business with the customer. Expense value drivers reflect several cost trade‐offs. For example, customers may order and receive products more frequently, decreasing storage, order placement, and inspection costs. Current assets decrease as the supplier assumes greater responsibility for inventory management and replenishment. Optimization of the distribution network may reduce fixed assets by eliminating distribution centers or increasing asset productivity.
An extended framework results when this type of analysis is extended to include other trading partners. The customer side of the integrated approach is shown in Exhibit 12.5. Placed side by side, Exhibits 12.4 and 12.5 represent this linkage across the value chain. The extended framework promotes more effective communication by identifying exactly what needs to occur at the activity level to achieve corporate and supply chain objectives. As process changes occur, the financial implications can be identified so that managers can ensure an equitable allocation of the resulting benefits and burdens based on the costs, asset investments, and risk incurred.

EXHIBIT 12.5 Developing and Aligning Corporate Performance Measures with Customer Value Drivers and Supply Chain Objectives
Source: Adapted from Douglas M. Lambert and Terrance L. Pohlen, “Supply Chain Metrics,” The International Journal of Logistics Management 12, no. 1 (2001), p. 14, © Copyright Douglas M. Lambert. Used with permission. For more information about the SCM Framework see drdouglaslambert.com.
In many instances, the resulting performance measures may appear similar to those previously used by the different trading partners. However, there are key differences. Value and performance are measured by specific customers or suppliers—customer and supplier profitability analyses are essential. Measures such as on‐time delivery, returns, or perfect orders continue to be tracked, but the focus shifts to how the entire supply chain performs and how each enterprise contributes to overall supply chain performance. Measures focus on achieving overall supply chain objectives, as opposed to corporate objectives. Existing metrics will need to be adapted to capture differences driven by customer, supplier, or supply chain.
An analysis from the supplier's and customer's perspectives enables management to obtain a complete assessment of how value is created by incorporating all the components of the shareholder value equation. From the supplier's perspective, the analysis can be used to demonstrate the value created with a specific customer or in an entire supply chain. For example, the analysis can be used to demonstrate the value created by working with a trading partner by including only the revenues generated in the relationship, the costs directly attributable to conducting business with the customer, and any directly traceable asset charges, including inventory carrying costs, accounts receivable, and equipment utilization. The supplier can benchmark the value achieved by working with a specific trading partner to the value obtained by selling to other customers using different supply chain strategies. Downstream trading partners can use the analysis to obtain similar capabilities. The customer can identify the revenue generated from selling the supplier's products, the cost of doing business with the supplier, and charges for asset use. A combined analysis from the supplier's and customer's perspectives helps managers evaluate how their performance will drive changes in shareholder value simultaneously in both firms.
Supply chain executives can apply the combined analysis even when one of the supplier or customer firms does not currently use profitability or value analysis. In these instances, management can use cost estimation models and, with a reasonable degree of accuracy, estimate the sales, expenses, costs, and assets by using information from other firms in the supply chain. Although cost estimation models do not provide exact calculations of cost changes, they do provide useful indications of expected changes in the value created. These estimates are useful for demonstrating how changes in the value drivers will affect value creation in other trading partners. This approach proves especially useful when attempting to sell process changes to managers who currently lack this information. Without the analysis, managers tend to focus strictly on the added costs and investment and may perceive an inequitable distribution of resulting benefits and burdens between the supplier and customer; however, an EVA analysis expands the discussion to include revenue and asset value drivers, such as inventory carrying costs.
INTEGRATING SUPPLY CHAIN COSTING INTO A BALANCED SCORECARD
Integrating supply chain costing with the balanced scorecard will help ensure that a more complete set of performance measures is used. A strategy map and its associated balanced scorecard (BSC), popularized by Harvard Business School's Robert S. Kaplan and Dr. David Norton,1 has several measurement perspectives that make it richer than exclusively financial performance measurement models. A strategy map incorporates four perspectives: financial, customer, internal business processes, and learning, innovation, and growth. Collectively, supply chain costing with a strategy map and its associated balanced scorecard provide comprehensive reporting of current operating performance and insights into what to change going forward to manage future performance.
There is also a lack of consensus as to what a balanced scorecard is. To complicate matters, many organizations initially start developing a balanced scorecard without first developing its companion, and arguably more important, strategy map, from which the balanced scorecard's key performance indicators (KPIs) should be derived. Further complicating matters, organizations confuse strategic KPIs that belong in a balanced scorecard with operational performance indicators (OPIs) that belong in a dashboard.
Kaplan and Norton recognized the shortcoming of executive managements' excessive emphasis on after‐the‐fact, short‐term financial results. A balanced scorecard resolves this myopia and improves organizational performance by shifting attention from financial measures and managing nonfinancial operational measures related to customers, internal processes, and employee innovation, learning, and growth. These influencing measures are reported during the period so reactions can occur sooner. This in turn leads to better financial results.
There is additional confusion about the purpose of a balanced scorecard. Some executives say they have successfully transferred their old columnar management reports into visual dashboards with flashing red and green lights and directional arrows. A balanced scorecard is much more than that.
One problem is how anyone knows if those measures—the so‐called key performance indicators (KPIs)—support the strategic intent of the executive team. Are the selected measures the right measures? Or, are they what you can measure rather than what you should measure? Is the purpose of the balanced scorecard really only to better monitor the dials against targets rather than facilitate the employee actions needed to move the dials?
Organizations need to think deeper about what measures drive value and reflect achieving the direction‐setting strategic objectives defined by their executive team. With the correct strategic KPIs, organizations should strive toward optimizing these measures, and ideally be continuously forecasting their expected results.
The Mistake of Implementing a Balanced Scorecard without Its Strategy Map
Why are so many managers familiar with the term balanced scorecard but so few familiar with the term strategy map? The strategy map is orders of magnitude more important than the balanced scorecard, which is merely a feedback mechanism. Why do executives want to implement a balanced scorecard without a strategy map? One possible explanation is the mistaken belief that those vital few strategic KPI measures, rather than the trivial many measures, can be derived without first requiring employee teams and managers to understand the answer to a key question: “Where does the executive team want the organization to go?” This question is best answered by the executive team's vision and mission—and they must point to the direction they want the organization to follow them to. That is the executive team's primary job—setting direction. The strategy map and its companion balanced scorecard are both important, but their combination answers a different question: “How will we get there?”
Exhibit 12.6 illustrates a generic strategy map with its four stacked popular perspectives. Each rectangle in the strategy map represents a strategic objective and its associated projects or competencies to excel at plus their appropriate performance indicator measures and targets.

EXHIBIT 12.6 Generic Strategy Map
Source: Adapted from Gary Cokins, Performance Management: Integrating Strategy Execution, Methodologies, Risk, and Analytics (New York: John Wiley & Sons, 2001), p. 95. Copyright Gary Cokins. Used with permission of the author.
Note that in the exhibit there are dependency linkages in a strategy map with an upward direction of cumulating effects of contributions from accomplishing the strategic objectives. The derived strategic KPIs are not created in isolation but rather have context to the executive's mission and vision. To summarize, a strategy map causally links the strategic objectives from the bottom perspective upward:
- Accomplishing the employee innovation, learning, and growth objectives contributes to the internal process improvement objectives.
- Accomplishing the internal process objectives contributes to the customer satisfaction, retention, and growth objectives.
- Accomplishing the customer‐related objectives results in achieving the financial objectives, typically a combination of revenue growth and cost management objectives.
A strategy map is like a force field in physics, as with magnetism, where the energy, priorities, and actions of managers and employee teams are mobilized, aligned, and focused. At the top of the map, maximizing shareholder wealth (or, for public sector organizations, maximizing community and citizen value) is not really a goal—it is a result. It is a result from accomplishing all of the linked strategic objectives with cause‐and‐effect relationships.
One peril that threatens the success of this methodology is executive teams that are anxious to assign performance indicator measures with targets to employees and hold them accountable. Executives typically skip two critical steps of involving the employees to gain their buy‐in as well as their commitment to the measures. The first is ensuring that they understand the executive team's strategy, and the second, more critical, prior step is identifying the mission‐essential projects and initiatives that will achieve the strategic objectives. The presence of enabling projects and initiatives goes to the heart of what distinguishes a strategic objective from just getting better at what you are already doing.
A strategy map and its derived balanced scorecard are navigational tools to guide the organization to execute the strategy, not necessarily to formulate the strategy. Executive teams are capable with defining strategy, but a high involuntary chief executive officer (CEO) turnover rate and the increasingly shorter tenure of CEOs are evidence of their failure to fully, and successfully, implement their strategy.
There is a wide variety of measures that could be part of each of the four segments of the balanced scorecard. Financial perspective measures might include revenue growth, operating income, and change in return on investment. Customer perspective measures may emphasize the number of new customers, market share in a distribution channel, and customer service ratings. On‐time delivery, service response time, and order delivery time are examples of internal perspective measures. The learning and growth perspective measures include increase in employees trained in process management, percentage of delivery systems with real time measures, and the percentage of cross‐trained employees.
Each organization can customize the scorecard measures to fit its situations. Various authors who have written about the balanced scorecard include lists illustrating the types of measures that fall under each of the scorecard's categories. Authors such as Bhagwat and Sharma,2 Gunasekaran, Patel, and Tirtiroglu3 provide lists specifically related to supply chain processes.
Measurements Are Far More a Social System Than a Technical One
Selecting and measuring strategic KPIs is critical. You get what you measure, and a strategy map with its associated balanced scorecard serves a greater social purpose than a technical one (although information technology and software are essential enablers). Performance measures motivate people and focus them on what matters most. Therefore, having appropriate performance measures matters!
Imagine if, every day, every employee in an organization, from the cleaning person or janitor to the CEO or managing director, could answer this single question: “How am I doing on what is important?” The first half of the question can be easily displayed on a dial with a target; it is reported in a balanced scorecard. But it is the second half of the question—“on what is important”—that is the key, and that is defined in the strategy map.
The following provides an example from an unnamed company that recognized and acted on these questions many years ago.
A computer equipment manufacturer in the Midwestern United States prided itself on communicating its strategies so that every employee at every level of the organization was aware of the company goals. Some skeptical outsiders visiting the plant decided to test this claim. They asked a janitor sweeping the factory loading dock how his job related to the goals of the company. The janitor replied as follows. “My company's goal is to reduce the cost of its products. A major cost for us is inventory. We recently shifted to just‐in‐time production to reduce inventory stocking cost. This means that our suppliers deliver products to us every two hours. If I do not clean this loading dock before the next load arrives, we are unable to accept delivery. This would set back the production schedule in the plant and increase the cost of production. We would also have the added cost of returning the materials to the supplier.”4
The balanced scorecard involves identifying and integrating appropriate cause‐and‐effect linkages of strategic objectives that are each supported by the vital few key measures, and then subsequently cascading the KPIs down through the organization. KPIs ultimately extend into the operational performance indicators (OPIs) that employees can relate to and directly affect.
The primary task of a strategy map and its companion balanced scorecard is to align employees' work, actions, and priorities with multiple strategic objectives that, if accomplished, will achieve implementing the executives' strategy and consequently realize the end game of maximizing shareholder wealth (or maximizing citizen value). The strategic objectives are in the strategy map, not in the balanced scorecard. The strategic KPIs in the balanced scorecard reflect the strategic objectives in the strategy map.
The primary purpose of a strategy map is to communicate the executive team's strategy to employees in a way they can understand it, and to report the impact of their contribution to attaining it. Starting with KPI definitions without context to the executive's mission and vision denies this important step.
An Automobile GPS Navigator Analogy for an Organization
A strategy map and its companion balanced scorecard are similar to an automobile's GPS route navigator for organizations. For organizations, the destination input into the GPS is the executive team's formulated strategy. The executive team's primary job is to set strategic direction, and the top of their strategy map is their destination. However, unlike a GPS's knowledge of roads and algorithms to determine the best route, managers and employee teams must “map” which projects, initiatives, and business process improvements are best to arrive at the destination (realizing the strategy).
A strategy is never static; it is dynamic and needs to be constantly adjusted. This means that the destination input to the GPS navigator is constantly changing, placing increasing importance on predictive analytics to determine the best destination for stakeholders.
How Are Balanced Scorecards and Dashboards Different?
There is confusion about the difference between a balanced scorecard and a dashboard. There is similar confusion differentiating key performance indicators (KPIs) from normal and routine measures that are the operational performance indicators (OPIs). The adjective “key” of a KPI is important. An organization has limited resources or energy. To use a radio analogy, KPIs are what distinguish the signal from the noise—the measures of progress toward strategy execution. A negative result of this confusion is that organizations typically include too many KPIs in their balanced scorecard system, which should be restricted to strategic KPIs.
A strategy map design is first completed, and then the firm's strategic KPIs are selected and target levels for each are identified. With this understanding, it becomes apparent that the strategy map's companion balanced scorecard, on its surface, serves more as the feedback mechanism. It allows everyone in the organization, from front‐line workers to the executive team, to answer the question: “How are we, not just me, doing on what is important?” More importantly, the scorecard should facilitate analysis to also know why. The idea is not to just monitor the dials but to move the dials.
A Balanced Scorecard and Dashboards Serve Different Purposes
The two terms—balanced scorecard and dashboards—have the tendency to be confused and used interchangeably, when each brings a different set of capabilities. The sources of the confusion are:
- Both represent a way to track results.
- Both make use of traffic lights, dials, sliders, and other visual aids.
- Both can have targets, thresholds, and alert messages.
- Both can provide drill‐down to other metrics and reports.
Exhibit 12.7 illustrates the difference between a balanced scorecard and dashboards using a taxonomy starting with all measurements in general at the top. A balanced scorecard and dashboards are not contradictory; they are used for different purposes.
At the top portion of the exhibit is the realm of the balanced scorecard. A balanced scorecard is intended to be strategic. It serves to align the behavior of managers and employees with the strategic objectives formulated by the executive team. In contrast, dashboards, at the bottom portion of the exhibit, are intended to be operational.
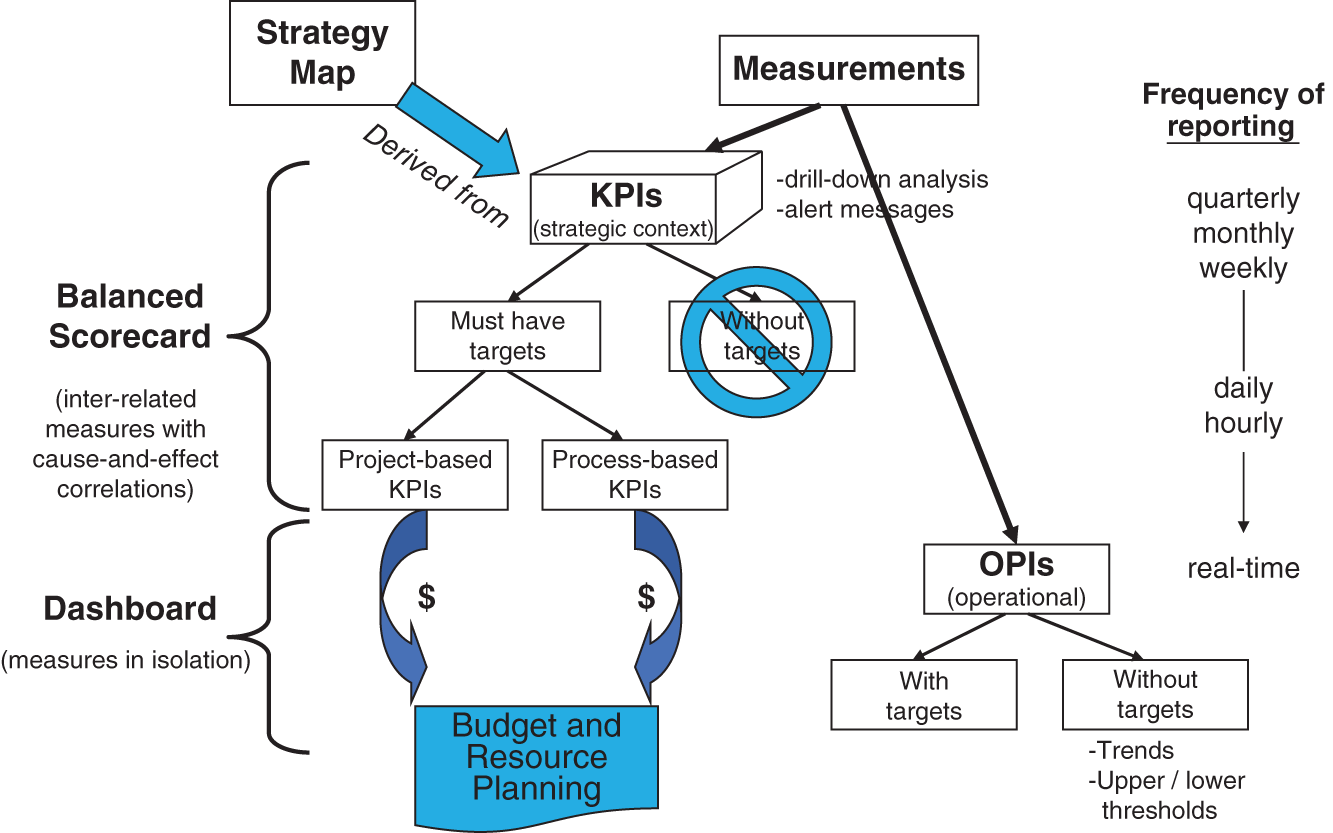
EXHIBIT 12.7 Balanced Scorecard versus Dashboard
Source: Adapted from Gary Cokins, Performance Management: Integrating Strategy Execution, Methodologies, Risk, and Analytics (New York: John Wiley & Sons, 2001), p. 105. Copyright Gary Cokins. Used with permission of the author.
A balanced scorecard provides information that is lacking in dashboards. It answers questions by providing deeper analysis, drill‐down capabilities, traffic‐light‐alert messaging, and pursuing inferences of performance improvement potential to determine motivational targets. A balanced scorecard does not start with the existing data, but rather it begins with identifying what strategic projects to complete and core processes to improve and excel in to accomplish the strategic objectives.
Here are some guidelines for understanding the differences:
- Balanced scorecards chart progress toward accomplishing strategic objectives. A balanced scorecard reports performance associated with an organization's strategic objectives and plans.
There are two key distinctions of a balanced scorecard: (1) each KPI must require a predefined target measure; and (2) KPIs should be made up of both project‐based KPIs (e.g., milestones, progress percentage of completion, degree of planned versus accomplished outcome) and process‐based KPIs (e.g., percent on‐time delivery against customer promise dates). A scorecard comprised mainly or exclusively by process‐based KPIs is not an efficient engine of change; it merely monitors whether progress from the traditional drivers of improvement, such as quality or cycle‐time improvement, is occurring. Process improvement is important, but innovation and change are even more important.
- Dashboards monitor and measure processes. A dashboard, however, is operational and its OPIs report information more frequently than those in the balanced scorecard. Each dashboard measure is reported with little regard to its relationship to other dashboard measures. Dashboard measures do not directly reflect the context of strategic objectives.
This information can be more real‐time in nature, like an automobile dashboard that lets drivers check, at a glance, their current speed, fuel level, and engine temperature. It follows that a dashboard should ideally be linked directly to systems that capture events as they happen, and it should warn users through alerts or exception notifications when performance against any number of metrics deviates from the norm or what is expected.
A balanced scorecard should include (1) the linkage of strategic KPIs to the strategy map and the fiscal budget (as well as rolling financial forecasts); and (2) the linkage of dashboard operational OPIs selected to influence behavior that will ultimately result in achieving or exceeding the strategic KPI targets. In Exhibit 12.7 the strategy map is located in the upper left and the budget and resource planning at the bottom.
Scorecards Link the Executives' Strategy to Operations and to the Budget
A strategy map is in the upper left of Exhibit 12.7. The exhibit denotes that KPIs should be derived from the executives' strategic objectives and plans. If KPIs are selected independent of the strategy, then they will likely report only what can be measured as opposed to what should be measured. Failure to execute a strategy is one of a CEO's major concerns, and therefore KPIs should reflect either mission‐critical projects and initiatives or core business processes that must be excelled at. Hence there is the need for both project‐based and process‐based KPIs.
The budget (and increasingly rolling financial forecasts) should be derived from the required funding of the projects (e.g., the nonrecurring strategy expenses and capital investments) and of the operational processes (e.g., the recurring operational capacity‐related expenses that vary with driver volumes, such as customer demand).
Dashboards Move the Scorecard's Dials
The organization's traction and torque are reflected in the OPI measures—the more frequently reported operational measures. Although some OPIs may have predefined targets, they do not need to have them. OPIs serve more to monitor trends across time or results against upper or lower threshold limits. As OPIs are monitored and responded to, the corrective actions will contribute to achieving the strategic KPI target levels with actual results.
Cause‐and‐effect relationships between and among measures underlie the entire approach to integrating a strategy map (formulation), balanced scorecard (appraisal), dashboards (execution), and fiscal budgets (the fuel).
Many organizations overplan and underexecute. With regard to KPI and OPI selection, first learn the principles, and then apply them through selecting, monitoring, and refining the KPIs. Designing a strategy map and its associated balanced scorecard is a craft, not a science.
INTEGRATING COSTING WITH STRATEGY, CUSTOMERS, PROCESSES, MEASURES, AND SHAREHOLDERS
Exhibit 12.8 expands the CAM‐I ABC cross in Exhibit 7.2 to include customers, strategy, and performance measures. In the upper‐left box is where the executives formulate their strategy, based primarily on customer needs and preferences. The supply chain costing is in the middle. Performance is in the bottom right box. Note that the performance box has inputs from the processes (e.g., productivity) and from the final cost objects (e.g., profits with profit margins). Also note that customers are bidirectionally connected to performance. As mentioned in Chapter 9, customers are the source of financial value creation for shareholders and owners.
Exhibit 12.9 decomposes Exhibit 12.8 into more detail. In the upper left is the zone of the customer‐based strategy map and its associated balanced scorecard with KPIs. At the far right are examples of operational performance enabled from the process view of costs. At the bottom, note that revenues are coupled with the strategic cost information, primarily from activity‐based costing (ABC), to calculate profits. The profit levels in turn impact the shareholders' and owners' financial wealth creation. The upward arrow from the final cost objects into the activities and ultimately into the resource capacity expenses reflects driver‐based budgeting and rolling financial forecasts, described in Chapter 11. The performance measurement in the lower right is bidirectionally connected to the strategy realization with variance analysis of the planned versus actual results.

EXHIBIT 12.8 CAM‐I ABC Cross Expanded

EXHIBIT 12.9 CAM‐I ABC Cross Expanded and Decomposed
Source: Adapted from Gary Cokins, Activity‐Based Cost Management: An Executive's Guide (New York: John Wiley & Sons, 2001), p. 200. Used with permission of the author.
ADDING VALUE THROUGH LINKAGES
The increased cost visibility made available by supply chain costing has far‐reaching implications for supply chain management. Value creation will drive strategic decisions regarding the composition and structure of the supply chain. The linking of supply chain strategy to activity costs and nonfinancial performance measures will change the firm's evaluation of carriers, vendors, and trading partners' performance while providing a greater degree of influence over changes occurring in the supply chain. Restructuring the supply chain to make the most of efficiencies or seize competitive advantages will further emphasize the requirement for a mechanism capable of equitably allocating cost benefits and burdens between trading partners.
Managers can use supply chain costing as a strategic tool for restructuring relationships within their supply chains. Traditional cost management systems bury many supply chain–related costs in indirect or “overhead” accounts (e.g., SG&A) and allocate these costs based on sales or volume shipped. Supply chain managers consequently have had little insight regarding how their actions drive costs within each trading partner or drive value for the end user. Supply chain costing supports strategic supply chain management by displaying these costs and accurately tracing them to the products, customers, or supply chains based on actual consumption. Supply chain costing facilitates the construction of product, customer, or supply chain profit‐and‐loss statements. These documents help managers better understand what drives costs and profitability, not only in their firm but within and across relationships in the supply chain. Managers can use this newfound intelligence to target supply chain relationships yielding the greatest value for strategic alliances or partnerships while taking action to reduce or eliminate high‐cost/low‐value‐added relationships.
Supply chain costing can play an integral role in allocating benefits and burdens within the channel. It lays the foundation for an allocation mechanism by accurately tracing costs to the specific resources contributed and the gains each partner will receive. Firms can then use this information to identify discrepancies and negotiate mechanisms to overcome perceived inequities. The information can also be used to determine how best to share any resulting savings across the supply chain. Allocation mechanisms that fairly distribute the savings according to contribution will increase the commitment to change within the supply chain and toward the building of a sustainable competitive advantage.
NOTES
- 1. R. Kaplan and D. Norton, “The Balanced Scorecard: Measures That Drive Performance,” Harvard Business Review 70, no. 1 (1992): 71–99.
- 2. Rajat Bhagwat and Milind Kumar Sharma, “Performance Measurement of Supply Chain Management: A Balanced Scorecard Approach,” Computers & Industrial Engineering 53, no. 1 (2007): 43–62.
- 3. A. Gunasekaran, C. Patel, and E. Tirtiroglu, “Performance Measures and Metrics in a Supply Chain Environment,” International Journal of Operations and Production Management 21, no. 1/2 (2001): 71–83.
- 4. Shahid Ansari, Jan Bell, and Thomas Klammer, “Strategy and Management Accounting,” in the modular series Management Accounting: A Strategic Focus (Ansari, Bell, Klammer; Lulu.com)