CHAPTER 15
Mode
How much does the medium affect the message? As TV rolled out, McLuhan et al. (1967) looked at the new way of delivering information, or the medium, and noted how it changed communication. Communication leverages the form in which it is contained. Let's revisit our restaurant and take a look at the menu. As you peruse the offerings, what medium is the menu? Is it a paper menu, a digital one on your device, or one that is multisensory through audio, video, and digital display?
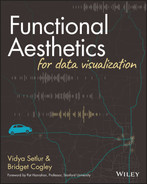
In the age of COVID-19, menus are far more likely to be accessed digitally. The medium might be a large screen, a tablet, or a phone, but the mode—or the way we interact with the medium—is fairly consistent across these devices. Restaurants use QR code menus that interact with smartphones. Customers can scan the code at the table with their phones, and the menu instantly appears on their screens, as seen in Figure 15.1. Digital menus open a host of new possibilities for restaurants to display menu items in an appealing way to diners.
The mode helps us decide how we interact: whether we scroll, click, and swipe across the screen or turn pages and run our fingers along the items. Digital menus have the advantage of displaying detailed photos of plates, appetizers, and desserts, allowing us to learn more on our own without engaging the waiter. Bright displays give restaurants options to change colors, fonts, and designs around menu items. Restaurants can run promotions on a set schedule, say, based on the season, and update the menus without having to reprint. The menu on a cold rainy day could easily feature comforting ramen, while on a hot day with lots of sunshine, it may prioritize salad and sushi offerings.
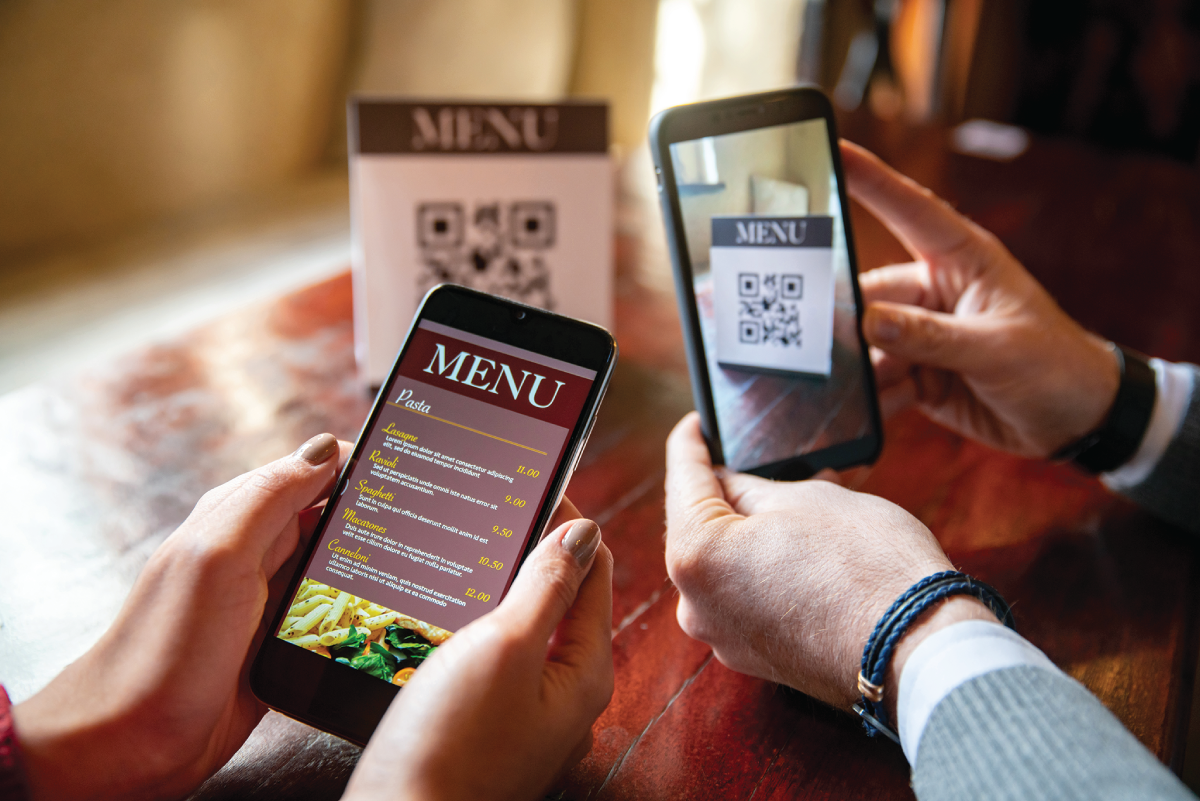
FIGURE 15.1 Digital menus introduce a new mode for food ordering.
Hispanolistic/Getty Images
Even before COVID-19, restaurants have experimented with taking the menu digital. Online menus allow diners to explore offerings and get excited about a meal beforehand. They integrate well with delivery and accessibility applications as well as novel advances in automated order taking. Experiments with ordering through voice and text chatbots allow a digital menu to adapt, showing recommended pairings or past orders. We've only just scratched the surface of what digital menus can do.
While digital menus create an interactive mode, paper menus aren't going away entirely. Restaurants often distill their whole aesthetic into a paper menu. Is the menu carefully bound into a leatherette cover, tied together with string, or quickly printed on standard copy paper? What texture does the paper have? The attributes of the menu often convey as much about price and experience as the building does. Just like books, traditional menus invite a sensory experience created by engaging touch as much as vision. The mode of paper menus is less individually customized—physical menus can show wear from use, unless frequently printed and replaced. COVID-19 sanitation requirements and contact tolerance between customers urged a faster shift to digitization.
Mode depends on the task at hand, the context, and even the local culture and norms of the target audience. Menus demonstrate this, but so do maps. We brought up maps as a strong example of functionally aesthetic visualization in Chapters 1 and 2. They are an example of how their function depends on their representation, intended purpose, audience, and context in which the map is viewed. Let's look at how the task of wayfinding brings to light the interplay between medium and mode.
Navigate Like a Local
Have you ever been lost with no clue as to where you are? Perhaps you missed that crucial turn because you couldn't read the sign in the dark, it was simply nonexistent, or it came up too fast. These are all problems that we can relate to, but navigation is especially complicated in countries where most people rely on landmarks as the de facto mode for successful navigation. India is one such country where street names are not commonly used: the typical wayfinding strategy is to simply ask someone on the street. Without road names, it's difficult to produce a set of directions that makes sense to find the dry fruit store in Old Delhi, shown in Figure 15.2.
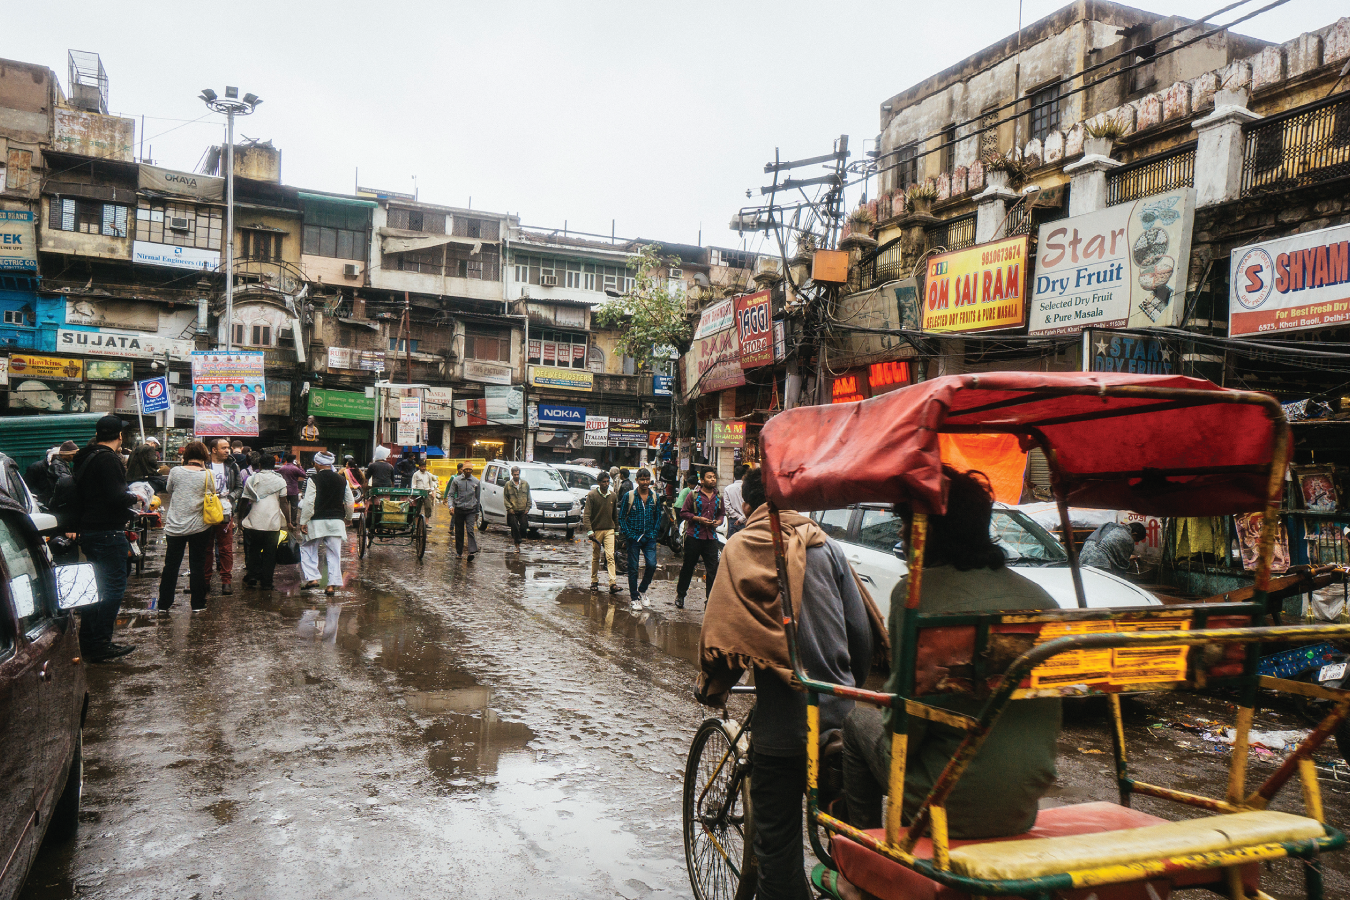
FIGURE 15.2 A typical street scene in Old Delhi, India, where locals and tourists go about their business
Instants/Getty Images
Creating functionally aesthetic maps requires deeply understanding the target users’ behaviors, their visual cues, and what makes a good landmark. In other words, we need to understand the mode of their wayfinding to provide route descriptions that are both understandable and usable. Google observed how people give and get directions in India (Unnikrishnan & Gupta, 2009). The study involved several aspects of figuring out the mode of sensemaking in a particular country. Researchers interviewed businesses, asking how to get to their stores, observed how people drew diagrams of routes to places unfamiliar to us, and even followed people around as they tried to find their way.
The study showed that using landmarks in directions in places like India helps for two simple reasons: they are easier to see than street signs and they are easier to remember than street names. Spotting a pink building on a corner or remembering to turn after a gas station is much easier than trying to recall an unfamiliar street name. Sometimes there are simply too many signs to look at and the street signs drown in the visual noise. A good landmark always stands out. It may be any object in the environment that is visually distinctive and easily recognizable (e.g., river, brightly colored building) or a well-known place (e.g., celebrity's mansion, popular restaurant), as long as its primary property is that of a point of reference (Caduff & Timpf, 2008).
There are three situations in which people resort to landmarks:
- When people need to orient themselves: for instance, they just exited a subway station and are not sure which exit to take to get to the street level.
- When people need to describe the location of a turn: for instance, “Turn right after the Starbucks.”
- When people simply want to confirm that they are still on the right track and haven't missed their turn: for instance, a reassuring message stating, “Keep going for six more miles.”
Even the hand-drawn route map that we introduced in Chapter 2 and show here again in Figure 15.3, embodies information that's only relevant to the attendee attending the wedding event. Both paper and sketching as a mode favor simplicity and allow for a bit of levity in the creation. Key highways and streets help navigate the person from the hotel to the venue. The mode is relevant to the audience, context, and mood captured by the playful sketch of the martini glass and heart on the paper medium.
FIGURE 15.3 Hand-drawn route map to the wedding destination (revisited)
Digital wayfinding typically leverages breadcrumbs (i.e., a navigation path that shows where the user is on a website or app) as landmarks. URL construction allows people to quickly understand and verify the path chosen. Within the site, elements may move elsewhere or provide additional breadcrumbs to show the path. As shown in Figure 15.4, our site uses meaningful words from the page titles in the URL, and elements are underlined to help with wayfinding.
FIGURE 15.4 Digital wayfinding on websites
Landmarks in visualization help people find their way through interactivity. As consumers select marks on charts, the selections may highlight, or the non-selected marks may fade. Additional breadcrumbs provide navigational paths and scaffolds, helping users understand what filters have been applied. Figure 15.5 shows the dashboard from Chapter 14 in a non-interacted state.
As we interact with this dashboard, breadcrumbs can help users follow along with what's happening. Figure 15.6 shows a prototype of what breadcrumbs could look like with natural language integration. The selection highlights Snacks in the Central Region. Visually, the breadcrumb darkens the bar and fills the background space with a darker hue. This language helps orient people to the dashboard (Situation 1 from the Google Map research study). Text spells out impact on downstream charts: the new comparison splits products by the Selected item (which uses preattentive attributes as a legend) and filters for the category and region (Snacks in the Central Region). Natural language in the title helps affirm what is happening: Products are now by select vs. rest, and monthly trends are for Snacks and Central Regions. This practice supports when landmarks are used for directions (Situation 2) and confirmation practices (Situation 3).
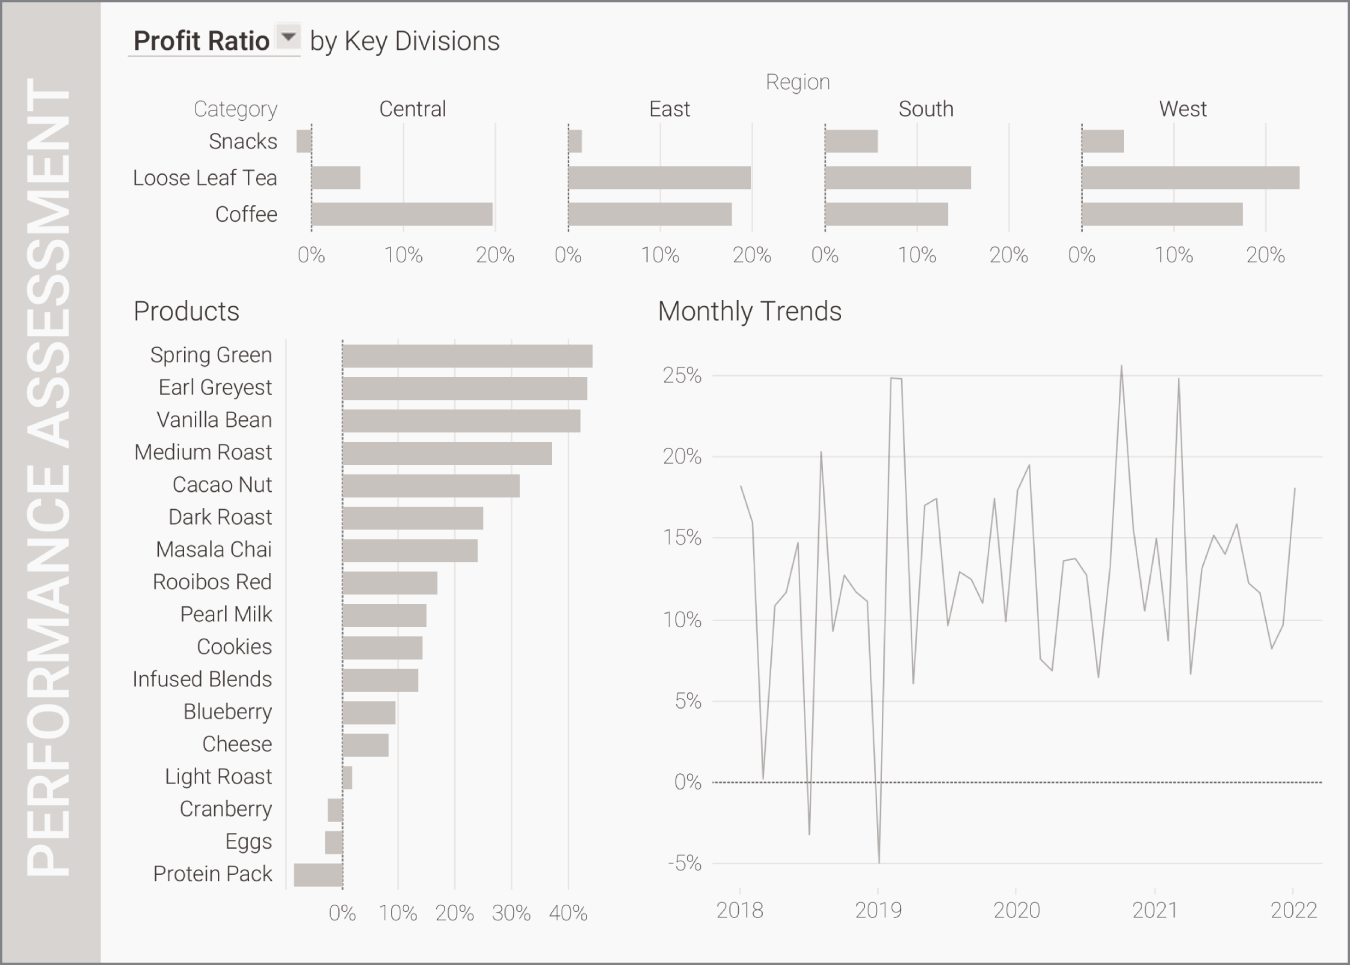
FIGURE 15.5 Dashboard before wayfinding
Just like using landmarks, balancing noise with navigation requires crafting clear cuing systems. The landmarks need to be distinct enough to find and follow while providing more clarity than clutter. Adding a second interaction to this dashboard requires a different landmark that provides distinction without creating undue overload. Figure 15.7 shows the addition of a second landmark in yellow. Careful thought around reasonable interactions means the first category chart filters the line chart while the product compares the selected attribute. The breadcrumb text first presents the filters (for Snacks and Central Region) and then the comparison (selected in yellow). In the physical world, this may translate directions that include zigzag turns close together.
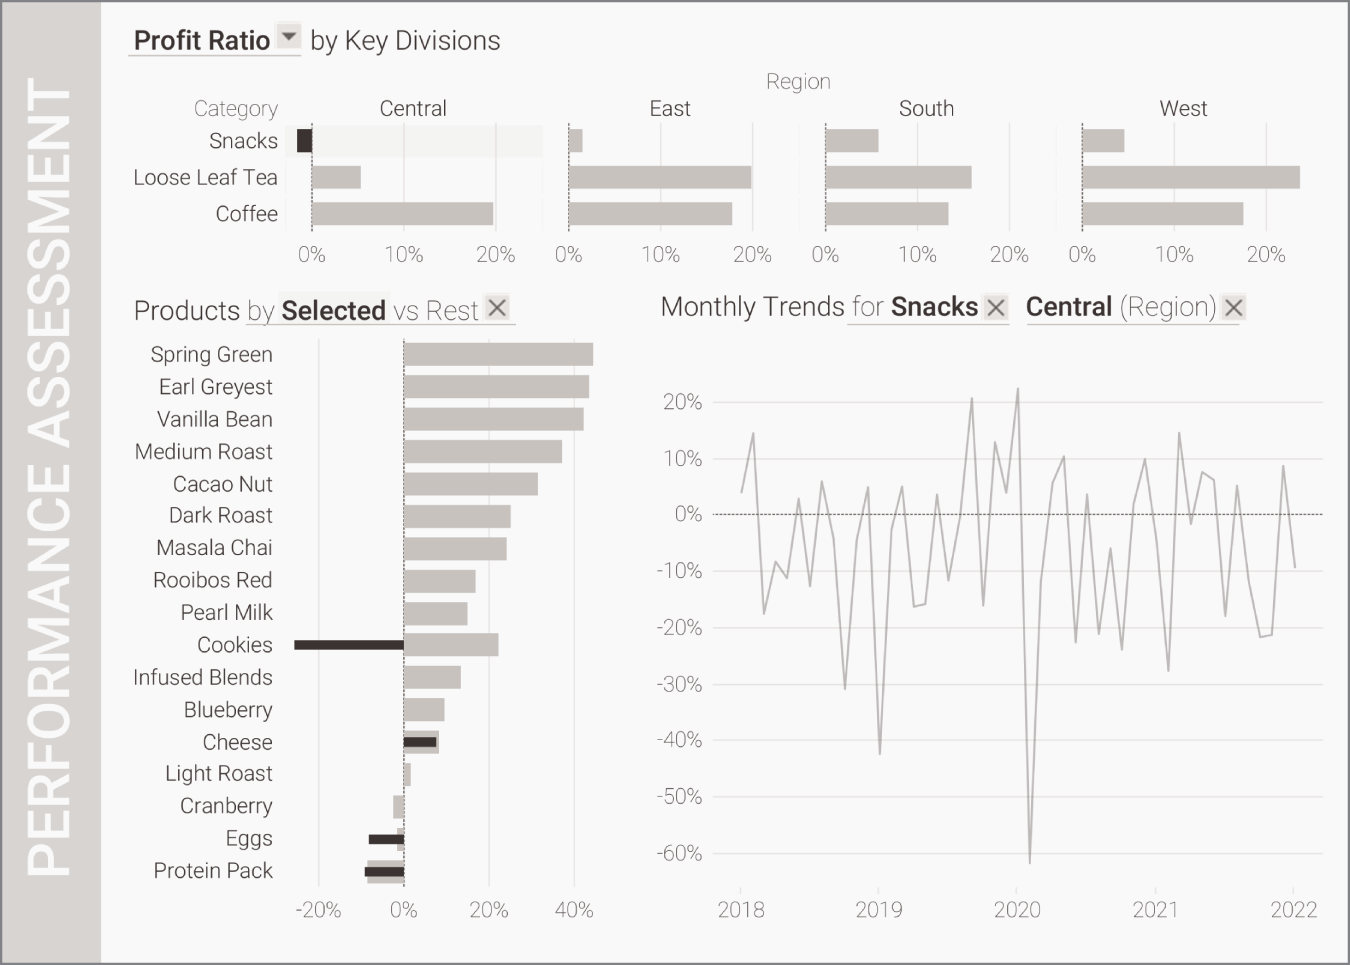
FIGURE 15.6 Dashboard with both visual and natural language landmarking
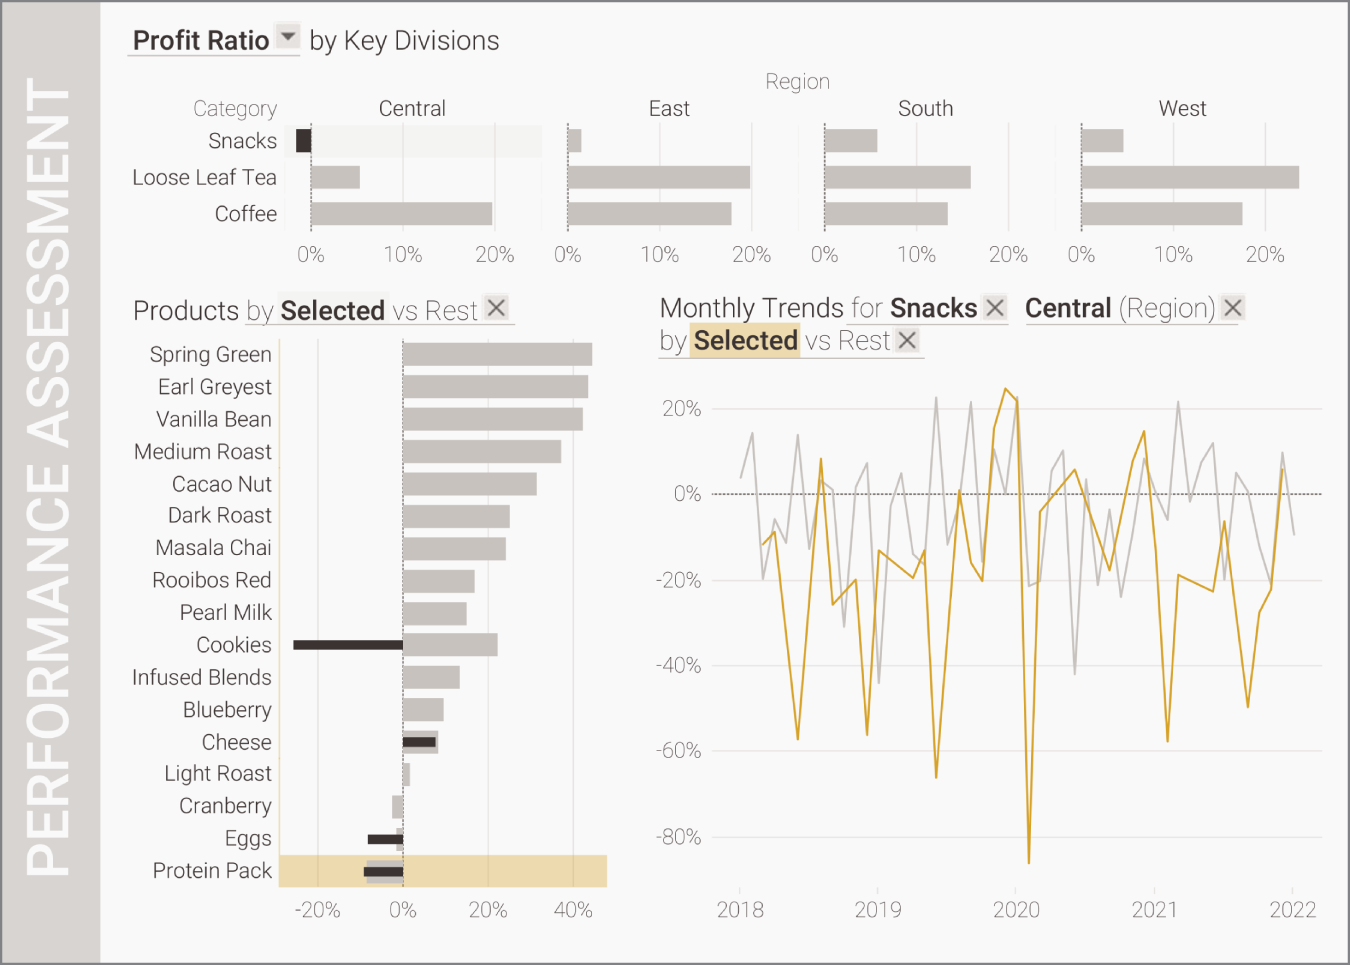
FIGURE 15.7 Interaction with two landmarks enabled
Landmark systems provide valuable scaffolds while navigating. They can be translated to the mode in which we're interacting. For paper, they may reduce details, while digital modes add clarifiers. In addition to navigation, mode takes into account the societal values that influence communication as well as impacts from the medium itself. The mode and mediums change how we communicate, or as McLuhan et al. noted, “The medium is the message.” TV, chatbots, and AI assistants influence our mode of communication.
Revisiting Analytical Chatbots
The last few years have seen a lot of excitement around chatbots. They've become a prevalent way of engaging with users, especially for customer service and transactional tasks such as making a doctor's appointment or inquiring about an order. It's easy to see the appeal.
The interface, voice, and even tone of these chatbots affect mode. As discussed in Chapter 13, understanding user intent and providing relevant responses is important to any chatbot platform; the interaction and expectations can be quite different whether one is speaking to the chatbot versus typing. Clifford Nass and Youngme Moon (2000) suggested that interaction with robots activates the same social brain areas as a conversation with a fellow human. And if that's the case, adding a human touch to a chatbot's responses resonates with people better than machine-like responses. Individuals exhibited similar behaviors with televisions and computers as they did with other humans: not only did they treat the machines with respect, but they also interacted with male-sounding and female-sounding computer voices differently based on gender stereotypes.
Social heuristics are simple decision-making strategies that guide people's behavior and decisions in the social environment when time, information, or cognitive resources are scarce (Hertwig & Herzog, 2009). People often apply these social heuristics to computer interactions, focusing on cues in language, intonation, and emotions expressed by the chatbot agent. Research supports the benefits of using anthropomorphic characteristics in human-bot interactions in encouraging more conversational interaction and enhancing a person's ability to make precise assumptions on how that agent is likely to act based on its persona. There's evidence that people tend to anthropomorphize voice chatbots by addressing the interface based on their perceived gender or simply being polite and using words such as “please” and “thanks, chatbot!”
Research explored how people interacted with analytical chatbots through text and voice (Setlur & Tory, 2022). We previously showed a Slack-based text chatbot example in Chapter 13. Figure 15.8 shows the transcriptions of a human interacting with an analytical voice chatbot. Participants interacted with an Alexa Echo device through voice, and the chatbot used a popular US English–based female voice option called Joanna (https://aws.amazon.com/polly). The gray text bubbles indicate voice transcripts from the human, while the blue ones are from the voice chatbot. Follow-up questions and feedback from the chatbot encourage conversational behavior, inviting the person to continue to explore a wineries dataset. People found it helpful when chatbots clarified phrases from the question like “best wineries” with a response that included “top winery,” making sure the chatbot understood them. The value of repeating validates the quality and accuracy of the system response, particularly with voice when there's nothing visual. Repair and refinement (presented in Chapter 9) is a big part of the analytical conversation experience, where the mode for being able to correct or change a system's response often depends on the medium—a follow-up question like, “Would you like to hear the next two?” when using voice or displaying widgets in a Slack interface for the user to select the next two wineries, for example.
The advancements in AI are opening up new opportunities for humans to interact with computers, such as the following:
- Simulating human voices, linguistic patterns, personalities, and appearances
- Assuming roles or tasks traditionally belonging to humans
- Conceivably, accelerating the integration of technology into everyday life
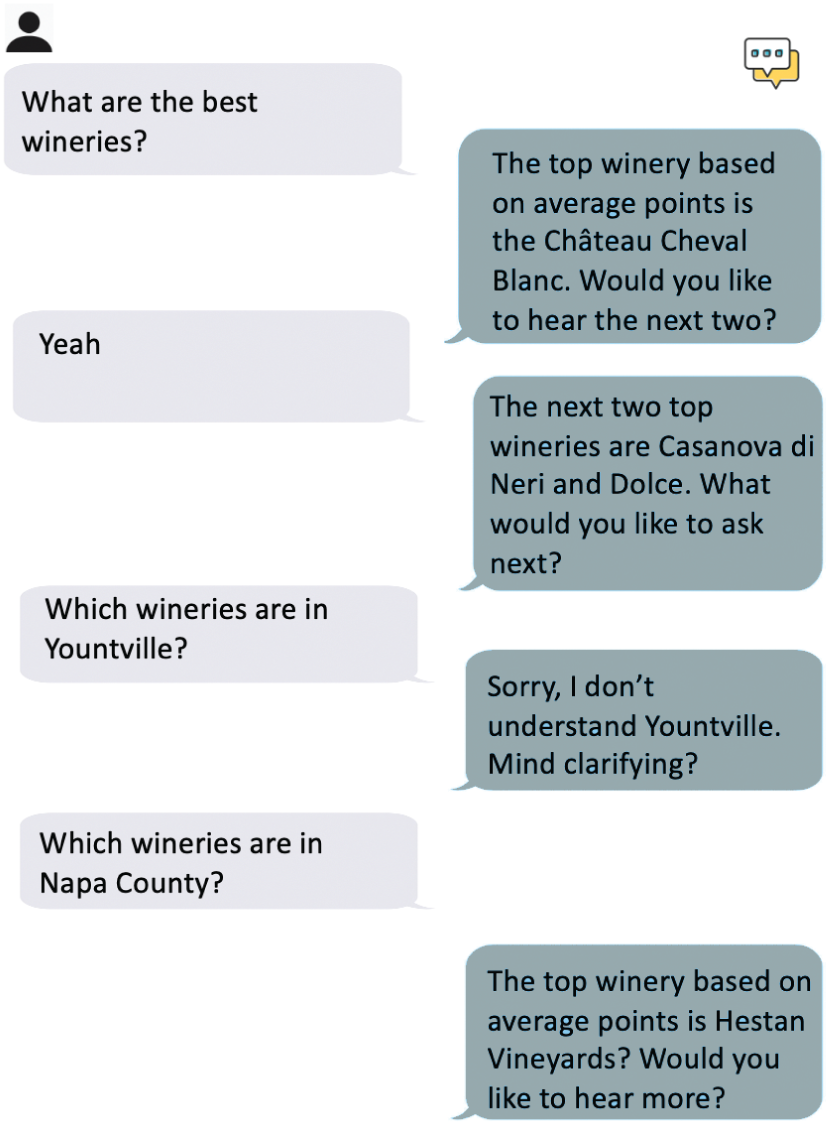
FIGURE 15.8 Interaction transcript with an Alexa Echo analytical chatbot
Determining the mode of interaction becomes increasingly important as functionally aesthetic visualization and the experiences built around it also get more nuanced and sophisticated.
Video Killed the Radio Star
Technological advances affect not only interaction but the exposition of information. Mode, along with literacy, affects how we frame and present information. Chatbots interact differently than humans, and we respond differently to each as well. With chatbots, we may dump word salad onto it in piecemeal bits. First, we may type “weather Columbus OH tomorrow,” then we get “hourly trends,” to get it to “things to do outside,” whereas we may ask a person what the weather would be like and if they know of anything happening. In other words, people code-switch to “computer speak” as they interface with chatbots, quickly determining the mode of interaction to be successful. Even before the advent of intelligent computers, people found creative outlets to express their point of view in the medium that was commonly available at that time.
Back before digitalization, people displayed information on paper by painstakingly drawing graphs, diagrams, and maps. In Chapter 3, we examined how the work of W. E. B. Du Bois, William Playfair, and Florence Nightingale showcases the variety and techniques used to display data by hand. Data started to be visualized by systems and tools with the evolution of multimedia resources and all the possibilities of the Internet. They multiplied the possibilities of combination and made the visualization of data more dynamic with animations, interactive graphics, and maps at different scales. Printed or static visualizations require a different exposition style than interactive graphics. How much of our practitioner wisdom comes from printed charts?
The changes in television provide a potential road map to the changes we can expect from interactive visualizations. As sitcoms transitioned from radio to television, they heavily catered to the ear, providing laugh tracks and a speech style still well suited for audio-only listening. As TV matured as a medium, the exposition styles changed by using the camera to drive the storytelling first and balancing the dialog. The camera setup and lighting became more elaborate, using shots, angle, and shifts in hue to provide tone and nuanced emotion.
Visualization, too, changes mode to mirror shifts in the medium. Early printed visualizations were hand-sketched, allowing artistic inspiration to literally and figuratively be drawn into the work. Software enables systemizing and developing abstractions that are useful for any visualization tool. Functionally aesthetic visualization is about constructing visual representations of data to amplify cognition. As Leland Wilkinson (2005) wrote in his seminal work The Grammar of Graphics, the basis for many modern-day visualization tools,
If we endeavor to develop a charting instead of a graphing program, we will accomplish two things. First, we inevitably will offer fewer charts than people want. Second, our package will have no deep structure. Our computer program will be unnecessarily complex, because we will fail to reuse objects or routines that function similarly in different charts. And we will have no way to add new charts to our system without generating complex new code. Elegant design requires us to think about a theory of graphics, not charts.”
Further innovations combine artistic representations of data into densely layered unique visualization. Interactivity enables filtering, animation, the unveiling of text, and changes to the graphic as the user scrolls. New modes around augmented reality (AR) create further immersion, as well as broaden the senses one can use to access the medium. Could visualizations include sounds to nuance the data?
Beyond the Desktop
Most data today is seen through a screen. Whether through a phone, a laptop, or a large display in an office, the digitization of data visualization enables a greater spread of charts. Most business visualizations still come designed as desktop-centric dashboards. What happens when other screens take priority?
Between smaller screens and touch interaction, the phone requires a different paradigm for design than a traditional desktop. The mode requires considering both of these factors and presenting information and interactions differently. We'll leverage the dashboard from Chapter 2 (Figure 2.9) and build mobile-first. As we saw in Chapter 8, scaling down our designs requires thinking about the orientation of the screen, the colors, and also the mode. Figure 15.9 preserves the first part of the dashboard and alters the second part to make it more useful. The darker color mutes the brightness of the screen, and the bubble chart allows filtering to meet the needs of larger fingers. Figure 15.10 provides a side-to-side scroll option and similar styling for each pane.
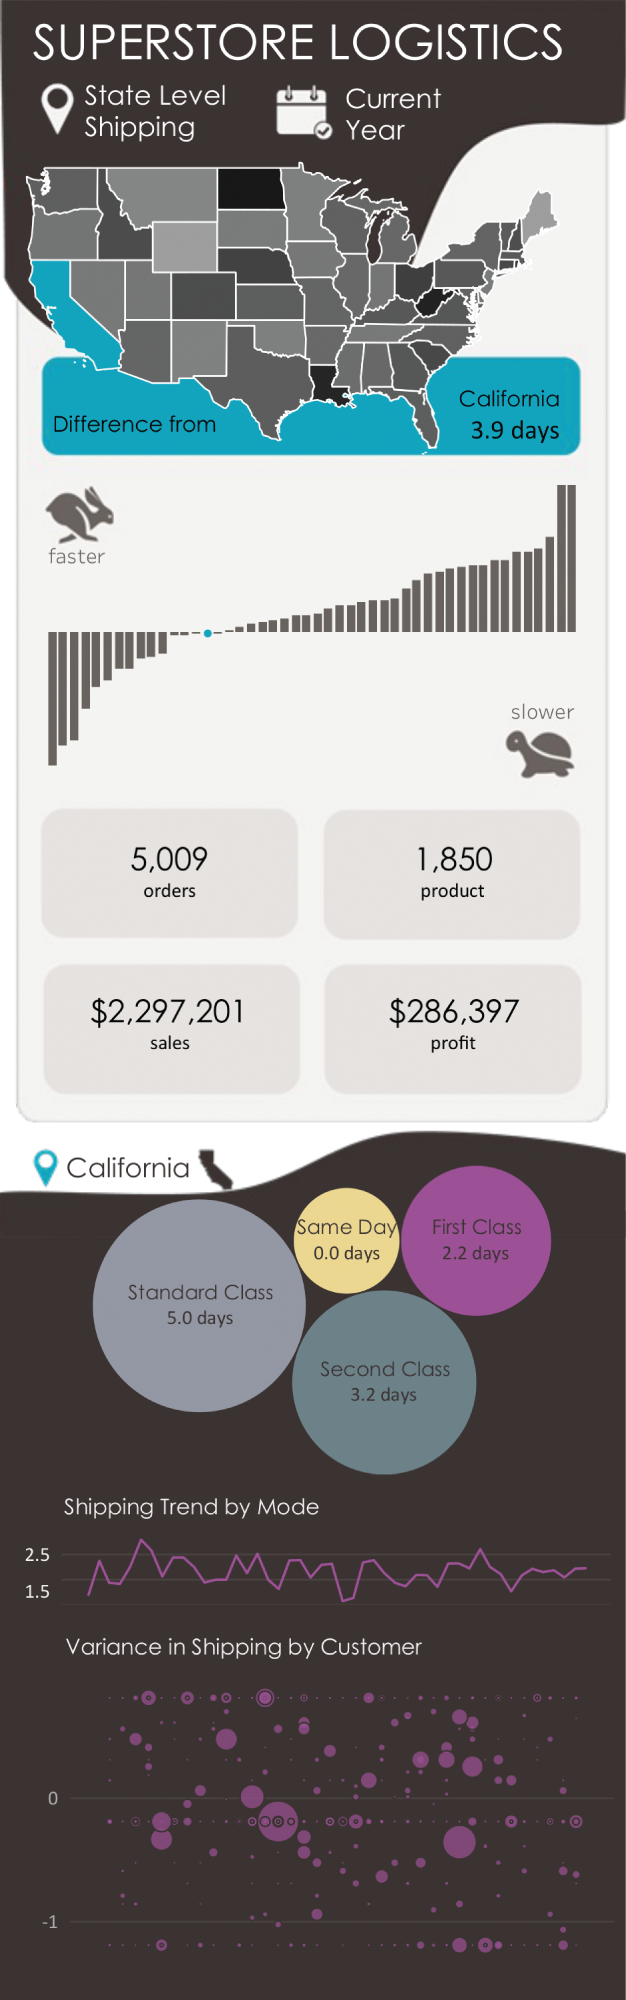
FIGURE 15.9 Mobile-first designed lengthwise
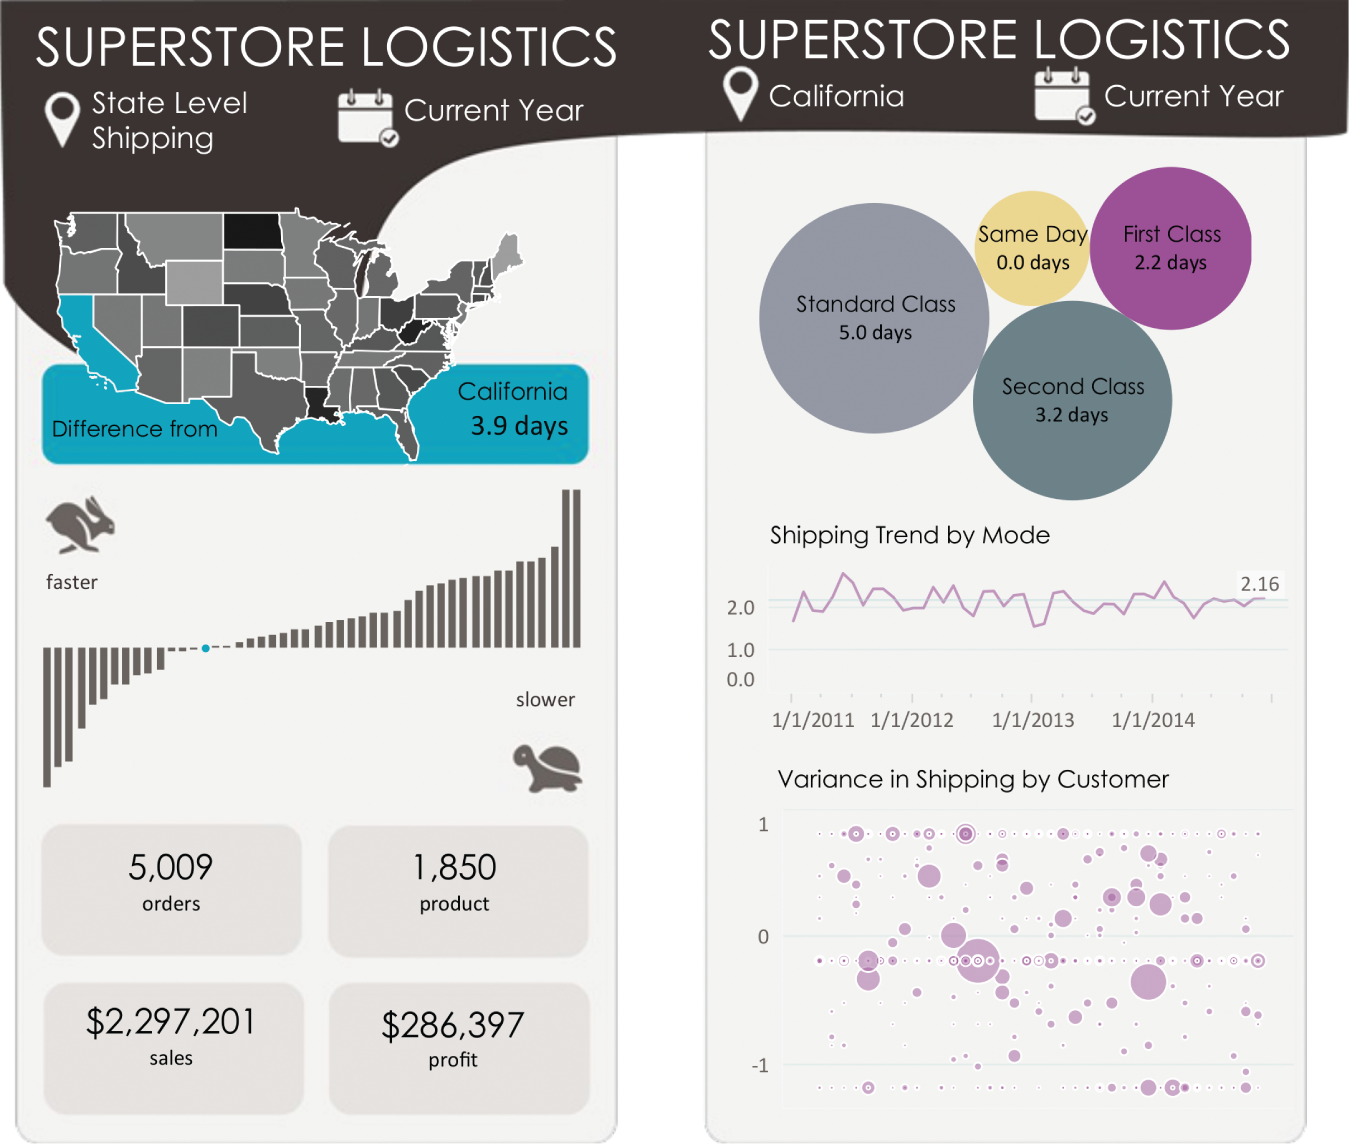
FIGURE 15.10 Side-to-side scrolling
Designing for the phone takes into account the differences in how we interact. In addition to the screen being smaller, the way in which we interact with the pixels is far less precise. Not only have we learned to become more precise with how we click with a mouse or trackpad, the operating system allows us to adjust its range, speed, and sensitivity. We can optimize how the mouse interacts with the pixels on our screen. We have a range of controls with the mouse. The cursor also helps identify—nearly down to the pixel—where exactly we're clicking. Now press a control on your smartphone or tablet. Where did you touch, and how did it identify that interaction? The preciseness of touch screen devices is still highly variable and much harder to correct as your finger is in the way of seeing the cursor. Some operating systems allow magnification slightly ajar from your finger for precise tasks.
Figure 15.11 shows interactions using the same device (Microsoft Surface) using both a mouse (top) and contact with the screen (bottom). With the mouse, the click points are closely packed within the very small circle. With the touch screen, not only do most contact points miss both the smaller and larger dot, the majority of touches land outside the data ink. The touch algorithm may address this, but finer-range tasks like selecting dots that are closer together are easy with a mouse and hard through touch. The mode requires adaptation for this chart to be useful for selection. Zoom, gestures, and even secondary charts can help increase precision.
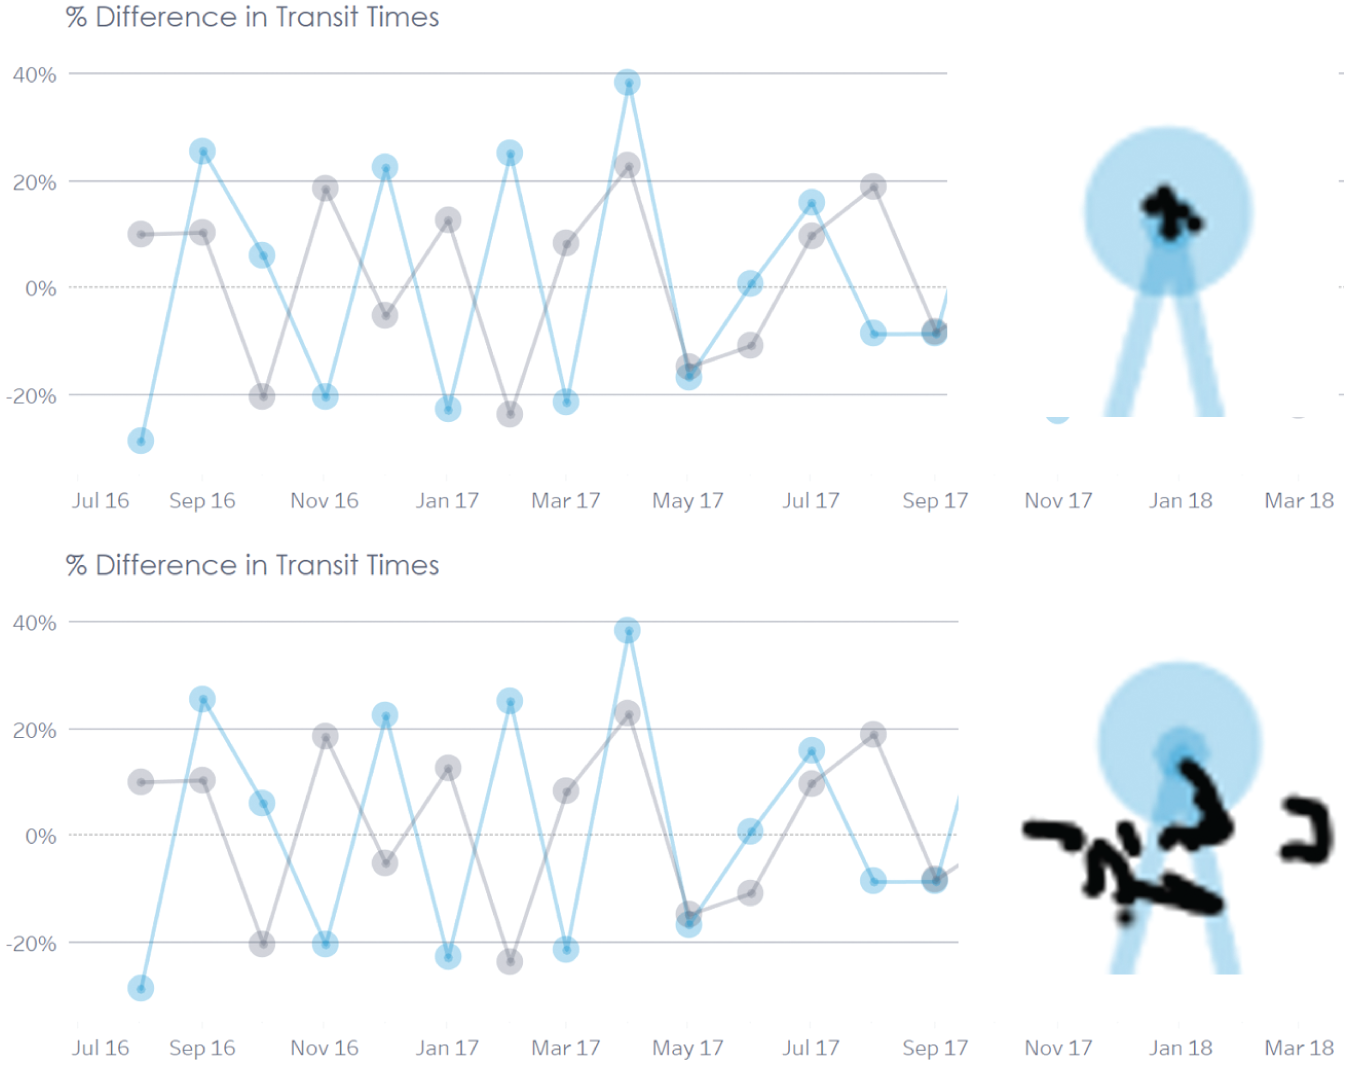
FIGURE 15.11 Mouse clicking vs. touching on points (Microsoft Surface)
Mobile screens enable greater functionality through gestures. Users can zoom into a part of the screen by drawing their thumbs and index fingers out from a C to an L. Other gestures may rotate, slide to another pane, or draw up a menu option. The semantics of gestures expands the capabilities of the medium (the smartphone) to allow the mode (mobile interactive visualization) to be more powerful.
Shrinking down isn't the only complicator. Large screens also demand a shift in how data is presented. Demographer and storyteller extraordinaire Hans Rosling is famous not only for how Gapminder (www.gapminder.org) showed data but how it was presented on the stage. Rosling would expand data points by swiping them on the screen, the bubble for the selected continent exploding into a variety of countries that dramatically moved to various places on the scatterplot. His verbal storytelling accompanied the visual, providing clarity to how the data moved. His body moved with the data as he darted from one side of the visualization to another, the distance in outcomes clearly felt in the movement.
Storytelling in literate societies demands a different narrative style than in those without literacy (as discussed in Chapter 6). Rosling allowed the visualization to be seen, then used the visual to add clarity. His audience had to see the chart to understand the nuances of his message. The audience felt the gap when Rwanda broke starkly from the median of Africa. Secondary data orality relies on an understanding of the graphicacy, of the ability to parse in Rosling's case the scatterplot for the heart of the story. Visually, his movements showcased the wide distribution patterns of income and life span. Modern data visualization competitions rely on secondary orality to clinch titles. Tool matchups like the BI Bake-Off hosted by Gartner or software-specific competitions like IronViz held during the Tableau Conference rely on contestants weaving powerful stories around the visualizations they showcase.
Future Forward
As we move toward further digitization of data visualization, the mode allows expansion into new ways of interacting with data. Going beyond the desktop to smartphones, tablets, or large displays opens new challenges that include device discovery, interaction sharing, and view management. What may start as an edge use case of one mode may quickly transform into its own mode.
Research is constantly evolving to figure out new ways to support visual sensemaking. One such technique is Visfer, which enables the sharing of visualizations using QR codes (Badam & Elmqvist, 2019). Other work explores network graph visualization and interaction between personal mobile devices in combination with a large wall display (Kister et al., 2017). Researchers developed an experience called GRaSp to allow mobile devices to quickly zoom in and provide details—a second layer of interaction made possible by AR. This allows interacting with much larger displays and moving around while exploring the data. Individuals looking at the data can use their phones and cross-compare while in a meeting easily. However, what's exciting is that these novel ways of exploring mode are making their presence known among practitioners.
Presentations involving visual displays of information are now mainstream in journalism and news outlets. Election coverage and the COVID-19 pandemic normalized the use of charts. A person often stands in front of a large touch screen using words and gestures to emote their story through data. Presenters of data cite Hans Rosling as an inspiring role model for a new generation of analysts. His performances deftly used the semantics of motion and gesture to guide the audience through data storytelling. Here are some guidelines he followed:
- Using the full screen to maximize the visualization
- Explaining the axes and the marks, including what their color and size meant
- Hovering over marks on the screen to pay special attention to certain aspects of the data
- Applying animation to show temporal changes in the data
- Describing the movement in the charts as it's happening
AR makes use of the digital screen paradigm but is rapidly becoming its own mode of interaction. The AR mode allows blending the interactivity and storytelling as demonstrated by Rosling. With AR, the visualization takes on depth and leverages metaphor in a whole new way by allowing size comparisons against real-world objects. For example, Google added support for 3D objects in its search where a medical student can search a 3D human anatomy model (https://arvr.google.com/ar). AR can provide a sense of scale and detail, with users able to see and interact with objects in a 3D view. It's one thing to read that a blue whale can be 100 feet long, but another thing to see it up close in relation to the things around you. With technology advancements and a better understanding of supporting new experiences, functionally aesthetic visualization will take new forms of display and interaction in the coming years.
Summary
Mode determines how we interact with a medium. Navigation is key, and providing landmarks and visual breadcrumbs helps guide the user. Functionally aesthetic visualization goes beyond the traditional desktop paradigm with the plethora of new platforms and devices. These new experiences provide opportunities to innovate and get the community excited about data-driven thinking. We wrap up this chapter and Part C by discussing how communicating and interacting through data can only be effective when we understand both the intent of the author and the audience. As we step into Part D, the last section of the book, we'll discuss how perception, semantics, and intent come together as a whole. After all, the sky's the limit.