CHAPTER 11
Enforcing Quality
This chapter covers the following topics:
• Defining quality
• Viewing quality management as a process
• Committing to phases of project management
• Implementing continuous quality management
• Communicating project progress
• Strategizing quality
• Ensuring quality through phases
Picture this: You are having a romantic dinner at a wonderful Italian restaurant. You’re seated at an elegant table with white tablecloth, shining utensils, and crystal glasses. The warm glow of the candlelight makes everyone look great. There’s Puccini on a distant speaker and the scents of sizzling vegetables, steamy pasta, and crushed garlic drift from the hidden kitchen.
Everything is perfect: The server is attentive, but not overbearing. Warm bread is followed by a crisp salad, and a delicious dinner that looks as good as it tastes. All in all, it’s a magnificent evening out. You’re feeling swell, so you order two cappuccinos and Italy’s classic dessert: tiramisu.
Dessert arrives, you each take a bite, and ... it tastes like wet cardboard! Just awful! The worst taste you’ve ever had in your life. Now no matter how excellent the evening had been, this one bite has ruined it all.
Hopefully this will never happen to you, at least the dessert part. But what happened? How did such a wonderful experience go from excellent to horrible? Someone, likely the pastry chef, didn’t do their job. Now the hard work of the chef, the wait staff, and the proprietors is all ruined, or at least tainted, by a let-down in quality management.
Quality management is the process of ensuring that the entire experience, the entire process for the management and for the customers, is excellent.

VIDEO For a more detailed explanation, watch the Managing Project Quality video now.
Defining Quality
Quality. How many times a day do you hear that word? Reports of it come from all around you: upper management, television commercials, salespeople, and the news. At every turn someone is spouting off about their quality carwashes, their process of quality management, the benefits of purchasing their quality products.
But what is quality and how does it relate to project management? Quality, according to A Guide to the Project Management Body of Knowledge from the Project Management Institute, is “the degree to which a set of inherent characteristics fulfills requirements.” Quality, according to Webster’s New World Dictionary, is “the degree of excellence of a thing.” Hmm…. To a project manager, then, quality could mean many things—and it does. To a project manager, quality falls into two areas:
• The quality of the deliverable
• The quality of the processes to produce the deliverable
In this chapter, both areas will be examined, though the focus will be on the quality processes to produce the deliverable. Arguably, to produce a quality product, there must be a controlled, organized process to get to the end result. Not often can a project full of chaos, disorganization, and pandemonium create an excellent deliverable. Both adaptive and predictive projects follow processes in an orderly, anticipated approach to deliver on the project scope.
Quality of the Deliverables
Every project must produce a deliverable to finish. A project to create a new application must, obviously, produce the application. A project to create a new network must result in planning, designing, and producing the expected environment. No project manager would set out to create a new application and end with a print server—it just doesn’t make sense. Every project must have clearly stated objectives as to what the project will produce. The objectives help formulate the project requirements. The project requirements evolve, through progressive elaboration, into the project scope baseline. Quality, then, is achieved by satisfying the project scope baseline and satisfying the project objectives.
Producing a Service
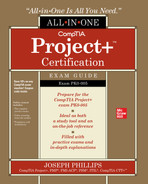
Imagine a project that is designed to establish a virtual private network (VPN) for the company’s employees. The goal of the project is to allow users from the field to connect to resources on the office network. Resources could include e-mail, printers, file servers, and databases. To remote users, the experience must be just like it is when they are accessing the LAN in the office.
The project manager and the team complete the research, create a plan of action, and implement the new service. Of course, it’s a bit more complex than this, but you see the big picture: conceive, plan, and achieve. The users, from home or anywhere in the world, connect to the resources within the LAN through a VPN, as shown in Figure 11-1, which allows users to connect to company resources through an Internet connection.
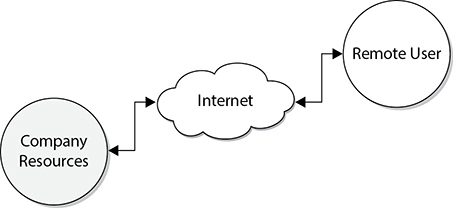
Figure 11-1 A project can deliver a product or a service such as a VPN.
To produce this service, the project manager had to see, and know, what the end results should be. The project manager worked with the project team and the project stakeholders to determine the exact requirements of the project deliverable. Research allowed the project manager to create the vision of the project, leadership allowed the project manager to transfer the vision, and dedication to the project allowed the project team to implement the plan.
The totality of the service is measured in value by several factors:
• Value of the implementation What did it cost the company to create the VPN solution, and what are the measurable results? There is a benefit/cost ratio for the project: the cost of the project, let’s say $75,000, relative to the benefits of secure, remote access. An ongoing process, through the project’s monitoring and controlling, must be used to see the true costs and benefits of the implementation.
• Value of the service After the project, there must be a process to measure the value of the service. Metrics are needed to measure the value to the organization before and after the project. The measurement of the service value can be accomplished through tools to log the service’s usage. From the logged data, calculations can be used to see the amount of activity over a set period and the cost of each session. For example, the number of users accessing the LAN through the VPN connection over a six-month period will reveal the usability, while an increase in productivity through the VPN connection can show the profitability of the implementation.
• Value of the experience How well do the deliverables work? If the project manager has over-promised the deliverables and the speed, reliability, or convenience of the service, then the value of the experience will diminish. For example, if the project manager has stated that the VPN connections will be just as fast as they’d be if the user were on the LAN and this does not prove true, users will consider the service less than excellent. People may use the new ability to connect to the LAN, access resources, and retrieve their e-mail, but their focus will be on the slight delay through the Internet connection. The experience needs to be quantified to measure customer satisfaction and quality.
• Value of the longevity How long will the service stay implemented? If the project manager and the project team have failed to research the service adequately and it is replaced within a year by faster, more reliable, and less expensive methods, the value of the service’s longevity may be slim. In some instances, the service may be adequate for the time it is in place; in others, the service may offer little or no ROI. For example, if the project manager had offered the VPN service through analog dial-up connections and offered no support for broadband connectivity, the thrill of the VPN would be diminished by the availability of broadband connections versus outdated analog dial-up connections.
• Value of the reliability How reliable is the implemented service? If the project is declared finished but the service consistently fails or is unavailable, the reliability of the deliverable is lacking. The service implemented must be reliable, and the underlying process of the service, whether it is hardware related or it depends on the skill sets of the individuals operating the service, must be reliable and able to fulfill the demands the service requires. For example, if the VPN server is consistently unavailable because the hardware the VPN software is installed on is weak and cannot handle the workload, then the hardware was not addressed properly in the planning phase and must be upgraded. The upgrade in hardware may cause delays in the service availability and incur additional costs to the organization.
Projects that produce services must be planned and implemented toward the end result of the service. A service deliverable must live up to the promises of the project manager, and the project team must have the skill sets and funding available to install the service for reliability, availability, and in proportion to the expected longevity of the service. As Figure 11-2 illustrates, a balance between the reliability and the cost of the implementation must be obtained.
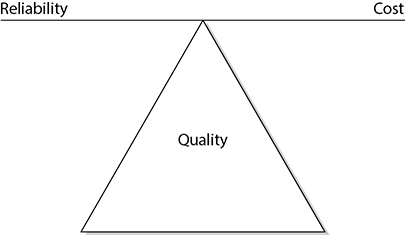
Figure 11-2 Project managers must balance cost and reliability to obtain quality.
Project managers must work to ensure that the proposed service is not going to be replaced with faster, stronger, and better services within a timeframe that would squelch any ROI on the service. This is derived from the research and planning phases conducted by the project manager rather than the demand from management for an immediate solution.

EXAM TIP The ultimate test of quality is the acceptability and validation of the product by the project customers. Quality is a conformance to requirements and a fitness for use.
Producing Goods
A project that requires deliverables to be a tangible object, such as a network, an application, a database, or an application server, has traits similar to those of a project creating a service. A project that creates a product, however, has different measurements to gauge the quality of the product.
For example, imagine a project that involves creating software to allow customers to design a landscaping scheme. The application will walk users through a wizard that will build an ideal garden based on their climate, the amount of sunlight their yard receives, the amount of color they’d like, the care of the plants, and other factors.
The software will be sold and used online. The interface of the software is not a typical web browser, but it does take advantage of the Internet connection to retrieve plant names, photos, and nursery information in the customer’s ZIP code or through a phone app to locate the customer by GPS. This application’s quality will be judged differently from that of a service, though it may have similar attributes.
Values used to judge a product are dependent on what the product is. For example, an application will have some characteristics of a service, whereas a laptop, a physical piece of hardware, will have different attributes of quality. For any goods, however, there are measurable values:
• Value of the product Is the product worth the cost? A product that must be created, such as an application, has to give the customer some level of satisfaction, enjoyment, or benefit that has a perceived or measurable level of worth. For example, a computer game that sells for $39 must be, to the consumer, worth that money in enjoyment. The $39 investment is measured in the ability of the application to deliver fun in this instance. In other words, does the product deliver on its promises in relation to the cost of the product?
• Value of the usability Is the product usable? A product must deliver on its promises to be usable. The usability factor stems from the need for the product to exist. For example, users need a laptop to complete certain duties—in particular, mobile computing. A project manager who manages a project to install and configure laptops for the sales team must know the level of usability the sales team anticipates from the hardware. The product itself is not the deliverable of the project—the satisfaction of the usability is the deliverable.
• Value of the reliability Is the product reliable? A product must be reliable, functioning, and usable by the customer. A project manager who implements a device, such as a new drawing tablet, is responsible for the quality of the device implemented. A tablet that has batteries that burn out too quickly, that doesn’t synch properly with a workstation’s software, or that is difficult to use is not a reliable product. The project failed not because of the hardware—but because either the requirements of the stakeholders were not established or there was inadequate planning to meet the stated requirements.
• Value of the longevity What is the product’s life cycle? Like the process of delivering a service, a product must also have a life cycle in proportion to its cost. A project that aims to create and sell Software as a Service (SaaS), for example, must have reliable enterprise resource planning (ERP), scalable architecture, documentation, and the ability to grow the SaaS model over time. Today’s technology is outdated as soon as it’s purchased, or so it seems. A project manager, however, must be able to judge the life cycle of a product in relation to the ROI of the product. The project manager often must calculate the cost of the product and how long the product must be used before it becomes profitable.
Quality vs. Grade
Quality, within a project, is the capability of the project to meet the requirements of the project customer. Grade, however, is the ranking or classification of a thing or service. For example, suppose you’re managing a project for the art department within your organization. The project requires six new printers for the artists. Two of the printers are inexpensive color inkjet printers, two of the printers are moderately priced color laser printers, and the remaining two printers are high-end image setters that print directly to film.
You have six different printers ranging in price and capability. All of the printers deliver on what they promise, but do they differ in quality? No. The printers differ in grade. Each printer is capable of printing under the specifications its manufacturer states. While the inexpensive inkjet printers are of a lower grade, they can still deliver the quality that they promise.
Consider also the grade of paper you may use with the printers. You can buy slick, photo-ready paper or cheap copy paper. Paper is paper, but the grade of paper can differ.
Low grade may not be a problem, but low quality is always a problem. Say one of your new printers consistently jams the paper, fails to print, produces smoke, or has other defects—that’s a quality problem. Low-quality resources affect the overall quality of the project. A low-quality resource, such as a person who’s incompetent in their job, will affect the quality of the project. Low quality is poor quality and that will pull the entire project down.
Quality of the Process
Whether you are creating a product or a service, you will follow a process to arrive at the deliverables. Predictive and adaptive projects have an approach that the project team and stakeholders must follow. As you’ve read in all of the earlier chapters, there is a set process, a logical and discrete order of getting any project from start to finish. The project management framework, both for adaptive and predictive projects, is guarded and led by the demand for quality.
No doubt, a project manager who is unorganized, lacks leadership abilities, and fails to motivate the project team will most likely create a project deliverable that is short of excellent. An agile team that doesn’t follow the rules, skips the required ceremonies, and constantly shifts from requirement to requirement isn’t following a quality approach to the project. As Figure 11-3 demonstrates, a project manager who is organized, follows a proven process of getting to the deliverables, has established the project requirements, and inspires the team to success will most likely create a deliverable that is solid, efficient, and valuable to the organization.
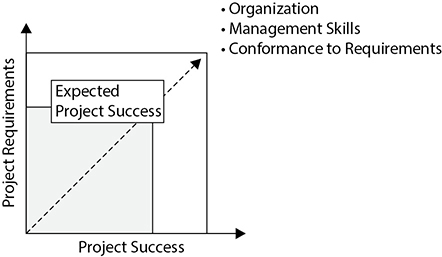
Figure 11-3 The project manager who is organized will generate success.
The quality of the management process is measured by several factors:
• Results The deliverables are a reflection of the ability of the project manager to manage and complete a project. The project team may be doing the actual implementation, but it is the responsibility of the project manager, scrum master, or XP coach to lead the project team throughout the entire process, not just at the beginning and the end. A deliverable that does not meet the expectations of the project’s scope represents a project manager who failed to do their job.
• Experience The experience of completing the research, the planning, and the implementation of the project should be rewarding and educational for all roles in the project. Not all projects are exciting and thrilling, but the experience of working with an excited project manager who is dedicated to the success of the project is contagious. At the end of the project, all parties involved should possess a sense of pride and satisfaction with the experience of being a part of and contributing to a successful project. The quarterback of the team, the project manager, has to call plays from the line, analyze defense, and discipline the team when it’s necessary. Agile teams, which are self-led and self-organizing, can take pride in delivering results in each iteration of the project. Organization, communication, and a desire to achieve are all factors in the sense of accomplishment.
• Project team The project team members will measure you by your ability to lead them to finish. They will look to you from day one to inspire, lead, and encourage them. They need you to be decisive, fair, and responsive to their needs. How you work with, talk to, and interact with the individuals on the team will determine their opinion of you. They won’t keep their opinion of you a secret, either; news of your ability, or lack thereof, will be shared with their peers and their supervisors throughout your organization.
EXAM TIP Don’t take shortcuts in the project management processes. This is for the project manager and all roles in the project. Follow and trust the process.
Managing the Quality
An IT project manager must have the keen sense to manage both the expectations of the deliverable and their own process to obtain the deliverables. The quality of the process is directly related to the quality of the deliverables. Simply put, the greater the project manager’s ability to lead the process, the greater the quality of the project deliverables (see Figure 11-4).
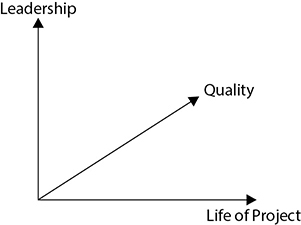
Figure 11-4 A project manager’s ability to lead impacts the project quality.
A project manager can use numerous tactics to ensure that the project management process is excellent and superior to projects that may be anchored with delays and cost overruns. There are several key managerial skills a project manager needs to have to manage a project successfully:
• Finance and accounting skills While the project manager doesn’t have to be a certified public accountant, they should have some fundamental accounting experience or training.
• Planning skills The project manager must know how to plan for the project implementation. A clear understanding of the project requirements is a fundamental precursor to project planning.
• Leadership skills Leadership is the ability to establish direction, align people, motivate, and inspire.
• Management skills A project manager must have the management skills to produce the results the project stakeholders are expecting from the project team.
• Communication skills Ninety percent of a project manager’s time is spent communicating. It’s a fundamental skill for a quality project manager.
• Problem-solving skills It’s key that a project manager has the ability to “figure stuff out.” They recognize the problem, find a way to solve it, and then make the decisions necessary to implement the solution.
• Negotiating skills A project manager must balance stakeholders’ interests, keep peace and harmony on the project team, and use the appropriate give-and-take when it’s needed.
• Achievement orientation A good project manager has to have a drive to get things done.
• Agility A project manager must be able to see the big picture, coordinate all of the moving parts of the project, and decompose the project end results into manageable components. Agility isn’t just for adaptive projects. Agility also means that you’ll timely respond to changes and opportunities.
• Service-oriented A project manager works for their manager and the project customers. For projects to be successful, the project manager must serve the project—this includes serving customers, stakeholders, management, and even the project team. This is the concept of servant leadership that is fundamental to adaptive projects.
• Emotional intelligence Emotional intelligence is the ability to understand and influence the emotions of others, and the ability to control self-awareness and self-emotions. A project manager won’t successfully manage projects if they can’t manage themselves. This includes control, temper, flexibility, time management, and so on. A project manager must be personally well organized and forward thinking.
• Organization This trait is probably the talent all successful IT project managers have in common. If you are not an organized person, learn how to become organized. Not only will your ability to manage projects increase, but your quality of life will improve.
Project Information Center
One approach of project organization is to create a project information center (also called “the war room”). The size of your project and the available real estate within your office building will determine your ability to create a project information center. This centralized room is a collection of all materials related to the project. Co-located teams are ideal for adaptive and predictive projects, but it’s no surprise that more and more teams are not centrally located. Virtual chats, web conferences, and virtual meetings are the new norm for projects.
The project manager, project team, vendors, consultants, and whoever else is involved in the project can drop by the center, virtually or physically, to retrieve information, learn the project status, and review work related to the project. In addition, you can, and should, create a map of the entire PND on a wall to gauge where the project is at any time. If you’re using an agile approach, this is where you’ll also display your project information radiators to share information quickly about the project work.
Project resources and access to data must conform to organizational requirements for security. This means physical security, such as physical access to servers and network components, but also digital security. Digital security begins with access permissions, multifactor authentication tools, and security policies. Because so much of today’s business relies on technology, you’ll need to always consider the data security, intellectual property, trade secrets, and even national and government regulations for securing data.
Resources needed by the team can be centrally stored in the project information center, along with books, videos, and magazines related to the technology being implemented. Tools and equipment connected to the implementation are stored here. Finally, the project information center is an excellent location to hold team meetings, as resources are a footstep away.
EXAM TIP Project information centers, or war rooms, are becoming less and less common as employees work remotely. Web solutions, such as web conferencing and chat, are more common in today’s work environment.
Web Solutions
Another excellent resource, especially for long-term projects and geographically dispersed teams, is the creation of an intranet solution for the project team. A central web page should be secured for the project team, the project manager, and relevant management. The web solution should offer the same features as the project information center and can be designed to allow for milestone completion, project updates, and a method to communicate with other team members. There are lots of web collaboration tools to move your project information center online. Through these tools you can quickly create links to project resources, status reports, activity lists, budgets, charts, calendars, and just about anything project-related you need to organize and share with the project team and stakeholders.
A web solution for your project may be applicable to the entire organization. Some organizations have a central project management office that coordinates all activities of projects through a web solution. In other words, the process is uniform, with some flexibility, across all projects through the web solution. Projects are kept separated, but costs are streamlined as resources may be used across projects. A web solution allows projects that are dependent on each other to interact, and it allows project managers to see the status of a successor or dependent project to judge the completion of tasks.
Software Solutions
There are many different project management information systems (PMISs) available to assist a project manager. With a PMIS, a project manager can organize, track, complete estimates, and schedule events to happen. A project manager can use traditional project management techniques with the PMIS as the catalyst for reaching the project’s end. PMISs all have features that can be designed to track tasks; project flow; and the surge of e-mails, documents, and information. Whichever method you choose, a solid foundation on how to use the application is required to gain the full benefits.
Quality Management as a Process
Quality project management is an activity you need to perform from the concept of the deliverable to the release of the deliverable to ensure quality in all your activities. It is a belief that the process a project manager follows to ensure quality from the start of a project will propagate to the activities of the project team throughout the life span of the project.
Several concepts claim to be the “secret potion” for guaranteed successful projects every time. However, the one weakness and common theme in all project management processes is the reliability and willingness of the project manager and the project team to participate. This situation is comparable to joining a gym to get in shape—you actually have to go to the gym and work out to get the desired results. The same holds true with these concepts: you have to use and follow their principles for them to work.
Quality Phases of Project Management
There are five process groups within a predictive project, as Figure 11-5 demonstrates. Each process group keeps an eye toward the quality of the deliverable or ensures that quality exists within the creation of the deliverable. These are not phases of a project, but groups of processes that bring about a result. Adaptive projects utilize these process groups in each iteration, while predictive projects follow these processes throughout the entire project or in each phase of a longer project.
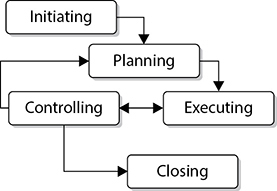
Figure 11-5 Quality is an objective in each of the five process groups of project management.
Within each of the following areas, a project manager must work to implement quality and quality management checkpoints:
• Initiating The origin of the project results from a reaction to a need or an opportunity. This realization of the need or opportunity is the concept of the project. The business needs of the organization are addressed to ensure that the project will satisfy these needs first. Once the project charter has been written to authorize the project manager, the project can move into planning. Quality is affected from the start. If the expectations of the quality aren’t set, aren’t planned for, or aren’t quantified, the project’s success is doomed.
• Planning The cornerstone of a successful project is the planning. The project manager and project team must identify the required activities and estimate the time necessary to complete the activities in order to reach the project goal. Through the research, project managers can identify the necessary resources, funding, and skills required to achieve success. Armed with this information, the project manager can create the project plan. Quality doesn’t happen by accident. During the planning processes, the project management and project team must plan how the quality demands will be met. The product owner is responsible for identifying and prioritizing the requirements based on business value, which is ultimately what constitutes quality in the finished product. Agile teams use the Definition of Done to plan the quality required in each of the product’s components.
• Executing Once the project plan has been approved, the project work can begin. The project manager will rely on the work authorization system to record task completion and allow new project assignments to begin. Adaptive project teams take chunks of requirements from the product backlog and work on those items in each iteration of the project. In either case, quality must be executed as part of the work. The project team must follow the specifics to meet quality demands as defined in the project plan.
• Controlling This phase of project management is a continuous cycle to oversee the project. In this phase, more than any other, the project manager ensures quality through quality control. Scope verification is also done here to ensure that the project is delivering what was promised. Project managers also control projects through cost control, schedule control, and risk management. The process of managing the project must be of quality as well. Quality control is inspection driven. Quality control in an adaptive project happens through the testing and demonstrations the development team provides in each iteration.
• Closing This portion of project management is the sigh of relief. It requires proof of the project deliverables, approval from management, and satisfaction from the customers or end users. This final stage moves the project from a work in progress to a component of the business. The final reports are submitted and archived, and the lessons learned documentation is completed. Quality also happens in the closing phase. A complete and final review of the project, including whether it met the quality objectives, and the quality of the project management experience, is required.
These five phases of project management contribute not only to the success or failure of the project, but also to the quality of the deliverables. A dedication to doing the required activities properly and with confidence in each phase leads to quality. Any one phase that is lacking a commitment to the success of the project can cause the entire project to be off balance and ultimately fail.
EXAM TIP The CompTIA Project+ exam content outline refers to the five process groups as phases. These aren’t phases of the project in most project management circles, but are groups of processes. However, for purposes of achieving the exam passing score, just acknowledge that CompTIA calls them phases, pass the exam, and move forward.
Ensuring Quality Throughout the Project
As your project moves along through each process group, over hurdles and through barriers, you’ll need a proven system to check the quality of your progress. You may subscribe to any one of multiple theories in the world of project management to test the quality of your project. All of these theories, however, have one common thread: work completed must be proven to be in alignment with the project deliverables. This is scope verification—the process of ensuring that the project is creating what the customer has asked for.
For example, a project to create a new application for an organization will have several milestones in its path to completion. The desired deliverable of this project is that the application will allow users to submit HR forms through a company website. The project manager can check the work in progress to verify that it is in alignment with the project deliverable. Should the work be out of alignment, the project manager must take immediate corrective actions to nudge the work back on track. Demonstrations in an adaptive project provide opportunities for the customer to see the work results and give immediate feedback to the team for improvements, approval, or changes.
Planning for Quality
Quality planning is a process to determine which quality standards are relevant to the project and how they can be implemented. Planning for quality is a fundamental exercise in the planning phase—each deliverable must have metrics that prove its quality. In IT, this can be bandwidth, latency, database accuracy, the speed of an application, and more. Every predictive project needs a quality management plan that defines the project’s approach for quality. This plan may be organization-wide, and it usually addresses the quality metrics, control limits, and how often you’ll need to measure the results of the project to ensure that quality exists.
The quality management plan also defines how you’ll adhere to the quality assurance requirements. Quality assurance in your organization may be known as a quality policy that dictates the expectations of a project in regard to quality, how the expectations are measured, and what the outcomes of those measurements should be. This quality policy is considered and applied to the project scope, which is important because the project scope contains all of the work your project will undertake. What good is a quality policy if it’s not implemented with the project work?
Depending on your organization, you may also have relevant standards and regulations that will serve as input to your quality planning. A regulation is a law or practice that is not optional in your industry. For example, the health care industry must abide by the Health Insurance Portability and Accountability Act (HIPAA) regulations as well as other regulations. A standard, on the other hand, is a rule or generally accepted practice within an industry. For example, most software application windows close using some button in the upper-right corner. While there’s no law that says this is a must, it’s a generally accepted standard regardless of the application or operating system.
The quality management plan will also define how you’ll implement quality control to prove the existence of quality within the project work. When you’re planning for quality, there are five major approaches you can rely on:
• Benefit-cost analysis Within every project, there will be a demand for quality—and a cost to reach that demand. A benefit-cost analysis considers the cost to reach the level of quality in relation to the benefits of obtaining the quality. For example, a customer may demand that a series of databases provide 100 percent accuracy 24/7. While this seems good, the synchronization of multiple databases after each change may result in a very costly solution. Instead of the expensive 100 percent solution, a better solution, for example, may be a less costly approach that ensures 98 percent accuracy. There will be a balance of cost and acceptable quality in every solution. Sometimes fast and good is better than slow and perfect.
• Benchmarking This approach uses other projects as a measure of performance on your current project. It examines the deliverables, the project management processes, and the successes and failures within each project to measure how the current project is performing. The problem with the approach, however, especially in IT projects, is that unless the nature of the IT projects is the same, it’s difficult to use. You can’t measure the performance metrics of a project to develop an application against the metrics of a project to create a new network. Additionally, because technology is changing so rapidly, benchmarks that were applicable 18 months ago are very likely outdated and inappropriate.
• Flowcharting Flowcharting shows how the components within a system are related, as shown in Figure 11-6. This is an ideal approach within any project. Consider an application that follows a client-server model. The front-end and back-end applications must communicate over a network or series of networks. A flowchart can illustrate the various components, how they interact, and their effect on quality. Another example of a flowchart is a cause-and-effect diagram to illustrate the causes that are contributing to quality defects within the project. These diagrams are also called Ishikawa, or fishbone, diagrams.
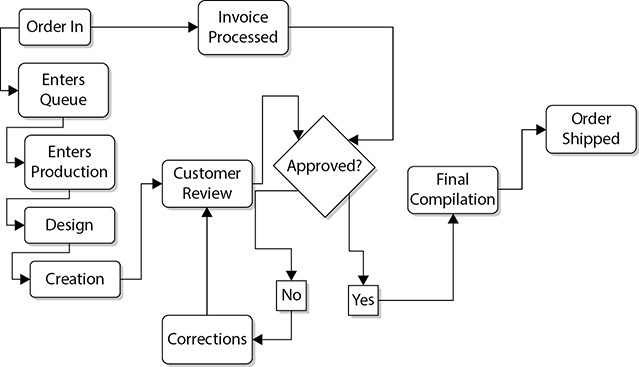
Figure 11-6 Flowcharting shows how the components within a system are related.
• Design of experiments This approach relies on statistical what-if scenarios to determine which variables within a project will result in the best outcome. The design of experiments approach is most often used on the product of the project, rather than the process of the project itself. For example, a project team creating a new network may experiment with the capacity of the network cable, the network switches, the routers, and the number of the network cards on the servers to determine which is the best combination for the best price. Design of experiments is also used as a method to identify which variables within a project, or product, are causing failures or unacceptable results.
• Cost of quality analysis Cost of quality is the sum of all the costs to achieve the expected quality the customer demands in the project deliverables. This includes all of the work to conform to the quality requirements and the expense incurred from nonconformance to the quality requirements. The cost of nonconformance is most evident when work needs to be redone and materials are wasted. Technically, the cost of quality has three costs: prevention costs, appraisal costs, and failure costs. Failure costs are associated with what could happen if the project fails: the lack of sales, loss of customers, product returns, fines and fees, downtime, and so on.
Traditional Quality Assurance
Quality assurance (QA) is a series of actions and requirements to assure the organization that each project will meet the relevant quality standards. QA is typically mandated on an organization-wide or departmental-wide program or quality system. For example, if your company uses Six Sigma or is ISO 9000 certified, your project will have quality standards that it will have to map to these guidelines and regulations. QA is concerned with the systematic activities that are applied to each individual project to ensure that quality exists. QA ensures that quality is planned into the project work. It’s always more cost-effective, more time-effective, and better for the project stakeholders to complete the project work correctly the first time.
To implement quality assurance, you’ll first follow organizational procedures that may be established for your projects. These organizational procedures comprise a form of governance. Governance ensures that all projects operate the same way, with the same rules and adherence, in order to improve the probability of achieving quality within the project for the organization. Governance can include reports, forms, audits, and other quality-assuring activities. Quality assurance is prevention driven, in that the goal is to prevent a lack of quality. The same tools a project manager uses for quality planning can also be applied as part of the QA process:
• Benefit-cost analysis
• Benchmarking
• Flowcharting
• Design of experiments
• Cost of quality analysis
Depending on the nature of your project and organization, your project may also undergo quality audits. A quality audit is a formal review of the quality management activities you have in place within your project. Quality audits can be completed in-house by QA professionals your organization employs or by third-party experts.
Traditional Quality Control
As you now know, quality is measured by the end result of a project. Obviously, you cannot wait until the end of a project to determine if quality exists. Quality control (QC) is concerned with the quality of the actions and deliverables within a project. QC is inspection driven; QC reviews the deliverables to establish that the quality expected by the project stakeholders is present.
QC is also concerned with the root cause of results that are below the quality standards and with eliminating the issues that are causing quality to slip so that quality issues are not repetitive. It focuses not only on the product of a project, but also on the project management process itself. For example, QC is used to determine why cost and schedule variances have occurred and what corrective actions can be enforced to ensure the same mistakes don’t happen again.
QC requires the project manager to have some understanding of statistical analysis, sampling, and probability to track trends, predict quality results, and determine root causes in quality issues. Trend analysis is especially useful in IT projects, as most work within an organization is cyclic. For example, suppose your network servers take a processor hit every morning as users log on to the network, check their e-mail, and open files. In the afternoon the proxy servers may have an increase in Internet traffic as users check the news, the weather, or the traffic for their commutes home. In an IT project, trend analysis can allow the project team to make educated decisions on how to react to conditions within the project.
QC must be managed throughout the project. It’s unacceptable to wait until the project has ended to see if the deliverables are of quality. The project manager must get out, look, listen, and inspect. Throughout the project, there are four fundamental facts about quality control to be aware of:
• Prevention keeps quality errors out of the project. Inspection keeps quality errors away from the customer.
• Attribute sampling means the results meet the expected quality standards or they don’t. Variables sampling tracks the level of acceptability of the results over time.
• Within a project, you have special causes where quality excels or diminishes due to anomalies within the project. Otherwise, you expect the results to vary as part of the project; this typical variance is simply called random causes.
• A tolerance is an acceptable range of quality for the project or deliverable. Control limits are the outer and upper limits that the quality results must fall within. If results are within the limits, the project is in control. If the results are out of the limits, it’s considered to be out of control.
Implementing Quality Control
Know this: quality is planned into a project, never inspected in. A goal for any project is to achieve quality by planning for quality—and then following the plan. But how will you know if quality exists on a project unless there is accountability? Sure, you could wait until your project is complete and then test the deliverables, but that’s a little late. Quality control must happen throughout the project to ensure that quality exists.
The most accessible method to ensure quality is inspection. Once you inspect the work, you can measure and react to the evidence you and your project team have found. There are many different approaches to inspecting the project deliverables. Following are the most common.
Peer Review
One approach to QC throughout an IT project is to use peer review. Peer review, as its name implies, is the process of allowing team members to review each other’s work. It is an excellent method to ensure that each team member is completing their work and doing an excellent job. Peer review provides for many things, including
• Ensuring that each task is checked for quality
• Allowing a team member to show others their work
• Allowing a team member to learn about other areas of the project
• Allowing the project manager to ensure the work is being completed
• Holding the team responsible for the quality of the work completed
The risk involved with peer review QA is that not all team members are up to the challenge of reviewing another’s work or having their work reviewed by an equal. If you use this approach, your team members must have confidence in each other’s ability to review other members’ work fairly, and confidence in their own abilities to complete the assigned tasks. Adaptive projects often use pair programming, where a pair of programmers works together to develop the code. One person writes the code while the other programmer checks the code as it is being written. The goal is to catch mistakes immediately and save time in finding bugs, refactoring, and providing quality code from the start.
Statistical Sampling
Statistical sampling is the process of choosing a percentage of results at random. For example, a project creating a database and website to sell concert tickets may require a measurement of database accuracy, the speed of the website, and the functionality of the overall program. This testing must be completed on a consistent basis throughout the project, rather than on a hit-and-miss basis.
Statistical sampling can reduce the costs of QC, but mixed results can follow if an adequate testing plan and schedule are not followed. The science of statistical sampling, and its requirements to be effective, is an involved process. There are many books, seminars, and professionals devoted to the process.
Management by Walking Around
One of the most successful methods for managing quality is to allow yourself to be seen. Get out of your office and get into the working environment. You don’t have to hover around your team, but let them know you are available, present, and interested in their work. Again, this isn’t always a reality in today’s workforce with so many of us working remotely.
So many IT project managers have a fear of being disliked or being seen as typical management, or they consider themselves too important to speak with their team. These less-than-successful project managers alienate themselves by hiding in their offices, ignoring the opportunity to work with the project team to ensure quality from the get-go. Don’t let this happen to you! Get involved with the project team members and make yourself visible.
Reviews by Outside Experts
Hire an outside expert to review the project as it progresses. This approach allows the project manager, who may not be as skilled as their team on the project’s technology, to ensure that the team is completing the assigned work with care and precision. A consultant can be brought into the project at key milestones to make an unbiased review of the work done to date. The consultant can accomplish many things for a project’s success. This practice
• Ensures quality and accuracy
• Allows for an unbiased review by a third party
• Creates accountability for the team completing the work
• Allows the project manager to know the true status of the work
• Allows the project manager to make any needed adjustments
Test Plans and Testing Cycles
When leading a software development project through a predictive or adaptive life cycle, the team will need to create a test plan and follow predetermined testing cycles. The CompTIA Project+ exam will likely have a few questions on the most common testing approaches, but the goal is the same: don’t allow defects to reach the customer. Defects that are released into production are called escaped defects and are poor quality. The following are common testing approaches to recognize:
• Unit testing The smallest testable chunk of code is tested for accuracy and is usually completed by the development team as they create the code.
• Smoke testing Where there’s smoke, there’s fire. Smoke testing is completed after a software build and before the actual release of the software to production.
• Regression testing The team does this type of testing after each code change to ensure that the code doesn’t break other parts of the software.
• Stress testing As its name implies, stress testing aims to confirm the software is stable, reliable, and operates as expected for the end users.
• Performance testing This approach, similar to stress testing, tests the performance of the software in a prescribed workload. It can also be used to confirm the scalability, computer resource utilization, and effect on the operating system.
• User acceptance testing Commonly called UAT, user acceptance testing is the final test before the software goes live in production. It’s a real-world test to confirm the software works as expected according to the design specifications, contractual obligations, regulatory requirements, and user expectations.
EXAM TIP The project team has the largest effect on quality, as they are the people doing the work. Quality assurance is to do the work correctly the first time. Quality control is to inspect the work to confirm that quality exists in the project. You can’t inspect quality into a project.
Analyzing Quality
Once you’ve completed the inspection of the project and the product deliverables, then what? Of course, you’ll be doing QC inspections on a regular basis, so you’ll need to track and analyze the results. You’ll want to complete root cause analysis to determine why quality issues may be random or repetitive. Since quality is the fulfillment of requirements, you can use the scope baseline, the cost baseline, and the schedule baseline together as the quality baseline. In other words, you must satisfy the project scope while balancing the time and cost to complete the project scope objectives. You can’t achieve quality in the project if you don’t deliver the project scope. There are several approaches to tracking and analyzing quality, as discussed next.
Using Control Charts
A control chart displays the results of your inspections over time. The results of inspections are plotted out against a mean, an upper control limit, and a lower control limit. As you can see in Figure 11-7, the results of inspections are measured and then added to the control chart. When results are over the control limit, they’re out of control; otherwise, the project is acceptable. However, this approach can be a little tricky in many IT projects. Control charts are best when you have projects that are extremely repetitive, such as manufacturing and construction projects. That’s not to say that you can’t use these charts within IT projects—just be aware that the results of your measurements may fluctuate as the nature of the work within the project changes. You can use control charts to track server usage, update network throughput, and more.
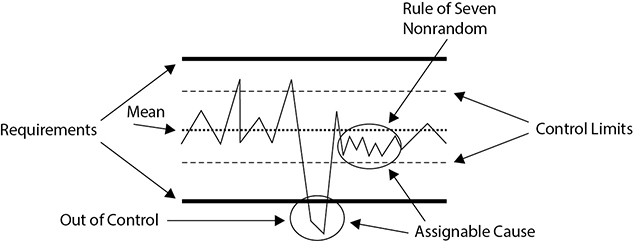
Figure 11-7 Control charts measure results over time.
When results of a measurement fall out of control, this is called an assignable cause. An assignable cause means there is some reason for this event to occur. It could be a hardware error, a different developer, or some other reason. It’s a signal that root cause analysis is needed. In addition, whenever seven results of your testing all fall on one side of the control chart’s mean, it’s called the “Rule of Seven” and is also an assignable cause. There will always be some reason why the quality has stymied on one side of the mean or the other, which means it’s time for root cause analysis.
Using Pareto Diagrams
A Pareto diagram is somewhat related to Pareto’s Law: 80 percent of the problems come from 20 percent of the issues. This is also known as the 80/20 principle. A Pareto diagram illustrates the problems by assigned cause from highest frequency to lowest frequency, as Figure 11-8 shows. The project team should first work on the most frequent problems and then move on to the smaller problems.
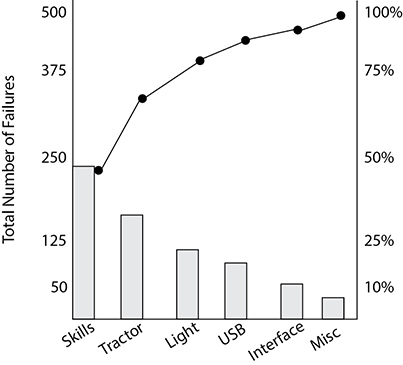
Figure 11-8 A Pareto diagram is a histogram ranking the issues from highest frequency to lowest frequency.
Revisiting Flowcharting
Remember flowcharts? Flowcharting is a method of charting how the different parts of a system operate. Flowcharting is valuable in QC because the process can be evaluated and tested to determine where in the process quality begins to break down. Corrective actions can then be applied to the system to ensure quality continues as planned—and expected.
Applying Trend Analysis
Trend analysis is the science of considering past results to predict future performance. Sports announcers use trend analysis all the time: “The Cubs have never won in Saint Louis, on a Tuesday night, in the month of July, when the temperature at the top of the third inning was above 80 degrees.”
The results of trend analysis allow the project manager to apply corrective action to intervene and prevent unacceptable outcomes. Trend analysis on a project requires adequate records to predict results and set current expectations. Trend analysis can monitor two things:
• Technical performance Trend analysis can ask, how many errors have been experienced by this point in the project schedule, and how many additional errors were encountered?
• Cost and schedule performance Trend analysis can ask, if we are $4,000 over budget now, what is our final cost likely to be?
Relying on Process Diagrams
A process diagram is a type of flowchart that shows the flow of a process. The process can be the flow of information through a system, but it may include how people, called actors, interact with the system. Consider a new network and all of the processes that happen by the users: the user logs in; reads and responds to e-mail; has a chat session with a colleague; browses a website; accesses a report from a server; edits, saves, and prints the report; and so on. All of these interactions could be mapped with a process diagram to set and measure expectations for quality.
Creating a Histogram
A histogram is just a bar chart. It’s nothing too fancy—each bar of the graph represents a different factor. You could make a histogram to show how well each requirement in your project is performing. Or a histogram could show how each vendor is delivering on time or costs. Or it could compare before and after project solutions. A histogram is a great chart for showing multiple requirements and how they’re stacking up against what was planned and what was actually experienced. It’s a quick way to show how well you’re achieving quality among the requirements.
Analyzing a Run Chart
A run chart is a chart that shows how a process is running—and by “running,” I mean how well the process is operating. You’ll often create a run chart near the launch of the project to measure fluctuations in a process that you’re aiming to improve. A run is a series of increasing or decreasing values in a process. You could create a run chart, as shown in Figure 11-9, to show network bandwidth throughout the project day. Early in the morning, there’s not much traffic, but as more and more users log in and use network resources, traffic increases throughout the day. The run chart doesn’t show stability of the process, but it shows peaks and valleys of the process.
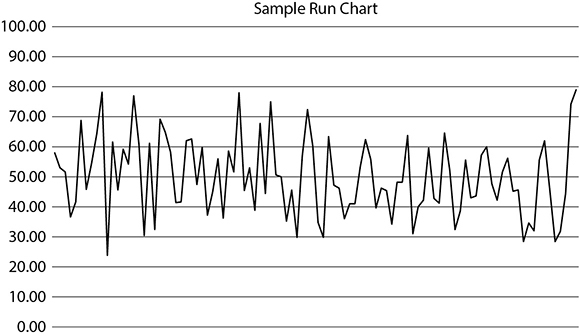
Figure 11-9 A run chart shows how a process is running over time.
Analyzing Scatter Diagrams
A scatter diagram measures two different variables to see if there’s a correlation between the two. For example, in Figure 11-10, on the Y axis is the variable of login timeouts. On the X axis is the number of users logging into the system. As more and more people log in, it’s believed that there are more and more timeout errors on the network. A scatter diagram would test this hypothesis to see if these issues are related. If there is a relationship between these two variables, the tighter the points will be to the line in the scatter diagram. Basically, if the points are close together, there’s a relationship; if the points are scattered about in the chart, a relationship is unlikely.
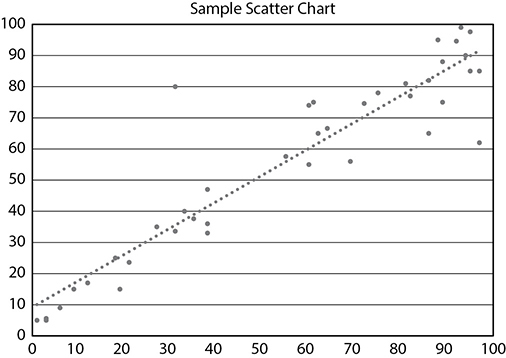
Figure 11-10 A scatter diagram measures variables to determine if there is a relationship between them.
Total Quality Management
No book on project management would be complete without at least a nod to total quality management (TQM). Total quality management is a process that involves all employees within an organization working to fulfill their customers’ needs while also working to increase productivity. TQM stems from Dr. W. Edwards Deming and his management principles, which the Japanese adopted after WWII. In the United States, these principles were readily adopted in the 1980s after proof of their success in Japan.
The leading drive of TQM is a theory called continuous quality improvement. According to this theory, all practices within an organization are processes, and these processes can be infinitely improved, which results in better productivity and, ultimately, higher profitability.
Here’s how this relates to IT project management: the processes a project manager uses to communicate, schedule, and assign resources can be streamlined, improved, and modernized to make the project easier to implement and more profitable as a whole. Examples include Microsoft Project Server and other web solutions for project teams.
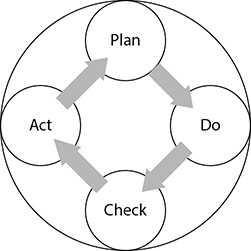
In project management, the customer is the end user of the deliverable, and the concept of streamlining processes is dependent on the project manager and the project team. Scores of books have been written about TQM, though one of the best books, Out of the Crisis (The MIT Press), was written by Deming himself. Many project managers adapt Deming’s “quality circle” of plan, do, check, act (PDCA) as a cycle for quality improvement. The cyclic nature of an adaptive project is not unlike the PDCA cycle.
TQM as a process is not a magical formula, an equation you can map out in Excel, or a dissertation from a business professor at Harvard. It is a simple thing to describe, but fairly difficult to implement. TQM comes from the dedication of the project manager and the project team to completing, with gusto, the required activities in each phase to produce an excellent deliverable. Anything less should be unacceptable.
Creating a Strategy for Quality
As with any area of project management, you won’t be successful without a plan. Quality control requires a plan, a process, and a strategy to implement and enforce it. You can attack quality enforcement in many ways; the best, however, is to lead by example. You should be the focal point of quality for your team, as Figure 11-11 depicts, in all that you do. Leading by example shows your team your own level of dedication to the project and that you expect your team to follow.
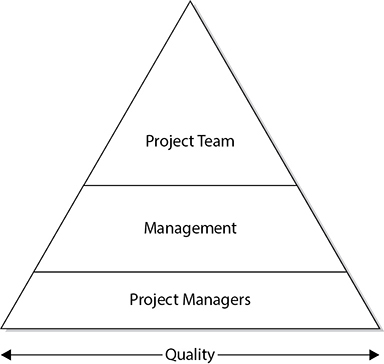
Figure 11-11 Project managers are the foundation for quality.
Revisiting the Iron Triangle
The second best method of implementing quality, regardless of the project, is a balance of time, cost, and scope. As you can see in Figure 11-12, the quality of the project is dependent on your management of the allotted time, the assigned budget, and the expected scope. Of course, there’s leadership, managerial skills, and more—but without balance, the project will fail. Adaptive projects use an inverted triangle, where time and cost are fixed and the scope of the project is expected to change throughout the project.
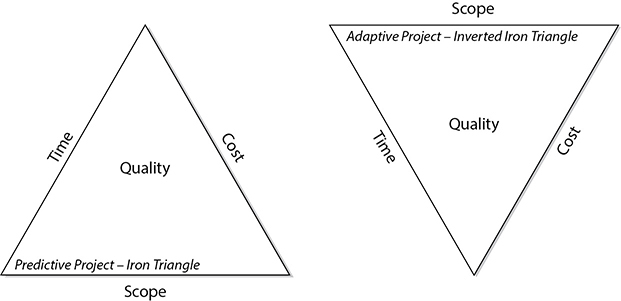
Figure 11-12 Quality can be achieved with a realistic balance of time, cost, and scope.
The one element that you should already have a strong handle on is time. Some projects will have more freedom with time than others. During the planning phase of your predictive project, you should be able to predict what the required time is to complete the project and meet the assigned objectives. Projects that are constrained on time will, no doubt, require you and the team to work diligently and quickly to achieve the objectives. When time becomes an issue, the quality of the project will reflect that.
The budget for the project is approved by management and will be yours to manage—most likely under management’s watchful eye. Your planning and implementation of the plan will help determine the budget of the project. Should your plan be full of holes, underdeveloped, and not comprehensive enough to counter foreseeable problems, your budget will be blown and the quality will suffer.
Finally, the scope of the project must be protected from unnecessary change. A change control system must be in place, backed by management, and used. When the scope begins to creep, the project’s time and budget must match the changes to the scope. Most often, however, when unapproved changes come into the project, quality begins to diminish because time and funds that should be allotted to complete approved project activities are spent on unapproved activities.
Communicating Project Progress
One method to implement quality is to use progress reports. A progress report is simply a formal, informative method of summarizing the status of work completed. Typically, on longer projects, progress reports are essential for keeping a record of the work completed, and they make for handy references in the end phase of the project.
You’ll generally use progress reports, or status reports, in a predictive project. Adaptive projects demonstrate progress in the iteration’s demo or sprint review. The daily standup meeting, or daily scrum, is a ceremony for the development team to share progress each day of the iteration—another ongoing progress reporting activity. At the end of the iteration, after the sprint review, the sprint team moves into the sprint retrospective. Recall that this is a type of lessons learned meeting to share what has and hasn’t worked in the project and to create a plan of how the team can perform better in the next iteration of the project. While adaptive projects don’t use a traditional progress report, adaptive projects do share progress through burndown and burnup charts with the project stakeholders through the information radiator.
In regard to quality, the process of creating progress reports allows the project manager and the project team to ascertain where the team is on the project and the amount of work yet to do. It’s a great way to visualize the progress the team has made so far and determine if the project is on track with the project vision.
Project sponsors and your project team’s functional managers will typically want to see the progress reports, as this allows them to keep in tune with your ability to lead the team and manage the project. Upper management may not want to see these reports, as their time may be limited. These reports can be based on templates that allow you and the project team to complete the progress report quickly and accurately. There are four types of progress reports you’ll use as a predictive project manager.
Current Status Reports
Current status reports are quick news on the work completed, or not, since the last status report. For example, you may determine that status reports should be completed every two weeks. Within each two-week window are tasks that must be completed. This report will focus on the scheduled tasks and their status over the last two weeks.
If scheduled tasks were not completed, the report should clearly state why the work has lagged behind and what solution is offered to get the work back on schedule. Distribute this report to the project team and the project sponsor, and keep a hard copy in the project binder. These reports are excellent for record keeping and nudging the project team back on track.
Cumulative Reports
As their name implies, cumulative reports focus on the work from the beginning of the project until the current date. Cumulative reports are excellent in long-term projects and should be created based on management’s requests, at milestones within the project, or on a regular schedule such as every three months. Use these reports for looking back on the progress accomplished so far on the project. Information in this report should include
• Work completed
• Lagging tasks and plans for recovering lost time
• Significant accomplishments
• Variances
• Budget information
Management Summary Reports
Management summary reports detail the overall status of the project, changes from the original plan, changes in execution, or cost variances within the budget. These reports are created on an as-needed basis and are ideal for upper management, as upper management does not have the time to read detailed reports to discover that everything on the project is going as planned. These reports are quick and to the point—effective when sharing bad news. The purpose of these reports is a fast, honest way to summarize the project status so that management may keep the project in check.
Variance Reports
Variance reports are summaries of any variances within the project, mainly time and cost, but they can also be reports on scope variances. They require the project manager to evaluate the cumulative work against the original project implementation plan. The comparison of the two should indicate where the project is and where it is heading. These detailed, number-oriented reports are an ideal way of enforcing quality and keeping the project on track.
CompTIA Project+ Exam Highlight: Quality
You’ll encounter a few questions about quality on the CompTIA Project+ exam. You’ll need to be familiar with quality assurance: planning quality into the project work. Know that you achieve quality by satisfying the project scope and balancing the Iron Triangle. Finally, be familiar with quality control: the inspection of the project work to ensure that quality exists. Quality control aims to catch mistakes before the customer completes scope verification.
1.7 Compare and contrast quality management concepts and performance management concepts This is the primary objective of this chapter for both adaptive and predictive project management approaches. In a predictive project, the quality management plan defines how you’ll adhere to quality assurance. Recall that QA ensures that the work is done correctly the first time. QA in an organization can be a formal quality program, such as Six Sigma, or it can be a quality policy that all projects must adhere to. Governance of quality ensures a uniform approach to quality management in an organization. The quality management plan also defines the quality control exercises you’ll complete in the project. QC is the inspection of the project work to determine the existence of quality in the project deliverables. Your quality management plan should also define how often you’ll measure for quality, what the quality baseline metrics are, and what types of charts and measurements you’ll be recording.
While it’s true that you plan quality into a project, you must still inspect the project deliverables to prove that the project work has been completed as planned. This is quality control, and its goal is to prevent mistakes from reaching the customer. When you inspect the project work and there are errors, corrective actions must be implemented to fix the errors and to get the project work back into alignment with the project scope and the quality baseline. Errors to project deliverables are variances from the project scope, and they’ll often create cost and schedule variances too, because of the time, materials, and cost of labor to correct the defects. Adaptive software development projects pass through audits, inspections, and testing cycles to confirm the software is of quality and meets the project requirements.
The quality baseline is achieved by adhering to the time, cost, and scope requirements of the project. You can use a Pareto diagram to categorize areas of defects and rank them from highest to lowest. A Pareto diagram is actually a type of histogram that shows categories of defects. A histogram is a bar chart that shows categories of a measurement. The difference between a simple histogram and a Pareto diagram is the latter ranks the categories of defects and directs the project team to attack the highest categories of defects first, and then to move on to the lower categories of defects. It is a type of chart that tracks measurements of project performance over time. A similar chart is a run chart, which shows the time elapsed between measurements in the project. You might also use an Ishikawa diagram, also known as a fishbone diagram or cause-and-effect chart, to facilitate a conversation on quality defects within the project.
2.3 Given a scenario, perform activities during the project planning phase Quality is planned into a project, not inspected in. It’s during the project planning that the quality management plan is created. This plan defines quality assurance for the project and how you and the team will work to ensure that quality is built into the approach and the results of the project. Because quality is a conformance to requirements, the quality management plan directly addresses the customers’ expectations of the features and functionality of the requirements and links to the stakeholders’ expectations for the finished product. Quality assurance also addresses how the finished product is fit for use when it enters production, so references to how the product will be tested and approved are common in the QA plan.
2.5 Explain the importance of activities performed during the closing phase While the majority of quality activities are performed during project planning and project execution, you’ll need to address quality during the closing of the project. Specifically, you’ll need to perform a validation of deliverables and acceptance of the deliverables by the project customer. In a formal project, there will likely be a sign-off process that helps lead the project to closure. The validation of deliverables means the product has passed through the defined testing cycles and the customer approves the work’s quality, stability, and completeness.
3.3 Given a scenario, analyze quality and performance charts to inform project decisions Throughout the project you’ll likely need to create different types of charts to show project performance, progress, and quality in the project. When it comes to quality, you’ll most likely create Pareto charts and histograms to show the distribution of defects. Run charts and control charts show the stability of the process and the results of quality control measurements. Agile projects utilize burnup and burndown charts to show the velocity of the project work, the balance and accumulation of the user stories completed or remaining, and how effective the team is in each iteration.
4.2 Explain relevant information security concepts impacting project management concepts Your overall project management approach must address the security needed for your project and its deliverables. This is directly attached to the quality of the project, as security concepts are requirements. You’ll need to address the physical security of the hardware, access to software and data, operational security, and any operational security practices of the organization. This can include trade secrets, intellectual property, and national security information, depending on the type of project work you’re managing.
4.3 Explain relevant compliance and privacy considerations impacting project management Like the security of the data and physical assets, your project may also need to address compliance and regulatory requirements. When you’re dealing with healthcare projects, financial data, or collecting personal customer information, for example, you’ll have regulatory compliance concerns that must be planned for and implemented in the project. No one wants a data breach, loose security, or unauthorized access to your systems—these are all poor quality and will affect the acceptability of the project by the customer. In addition, there can be fines and penalties for being out of compliance. You may need to consult with your organization’s legal counsel to address the requirements for compliance in your country, state, or province for your industry and type of software solution.
Chapter Review
Quality, quality, quality. Everyone talks about quality, but what is it? Quality is the capability of the project to meet the expected requirements of the project customer. Quality is the good, the worth, the profitability gained from and during the implementation. Quality is also the level of excellence within the project process. An IT project that produces quality results will have quality at its core—which is accomplished through planning, guidance, and leadership. Quality is a conformance to requirements and creating a solution that is fit for use.
The trick to ensuring quality deliverables is to make sure that quality is designed into the project itself. Quality management is a process that ensures quality is a central point of each work unit of a project. As the project moves through its different phases, you must sample and readjust the work to be in alignment with the project deliverables to ensure quality. Quality assurance is prevention driven and aims to ensure that quality is built into the project. Quality control is inspection driven and confirms that quality exists within the deliverables.
Progress reports are used in predictive projects and allow the project team, the project manager, and management to be aware of the status of the project at any given time. The reports can be simple one-page summaries or lengthy, detailed accounts of problems encountered and solutions discovered. Reports designed for management typically are quick and to the point—good news or bad. Management doesn’t have the time, or desire, to read a lengthy report only to discover everything is great.
Adaptive projects report on progress through burnup and burndown charts to show how many user stories are remaining in the project and the velocity of the development team in each iteration. An information radiator is an excellent method to publicly share the progress, performance, and quality of the project. Adaptive projects use testing cycles, such as unit testing, smoke testing, and user acceptance testing, to confirm the software is of quality and meets the requirements of the project.
As the project progresses, you must implement a process to ensure quality through each phase of the work. You can use leverage with your team members to ensure quality within their work by implementing peer review, sampling the project, and hiring an outside consultant to review the work.
Ultimately, the quality of a project is measured not by the project manager, the project team, or management, but by the end users of the product. Adaptive projects demonstrate the quality of the work completed in sprint reviews or demos for the stakeholders. Before completed work is released to production, there is validation of the completed work to confirm its acceptability and quality. Stakeholders’ experience and the productivity gained by the technology will be the true measure of the worth of the project.
Exercises
These exercises allow you to apply the knowledge you have learned in this chapter and are followed by possible solutions. In these exercises, you will evaluate three different IT projects that are experiencing problems with quality. For each scenario, you will offer a solution to ensure quality.
Exercise Solutions
The following offer possible solutions for the chapter exercises.
Questions
1. In order to achieve quality in the project, you must balance the Iron Triangle of Project Management. Which one of the following is not a component of the Iron Triangle of Project Management?
A. Scope
B. Schedule
C. Risks
D. Costs
2. You are the project manager for your organization and you’re working to ensure that quality is maintained throughout the project execution. What must every project have to ensure the work in the project sticks to a standard of quality?
A. A commitment from management
B. A project manager experienced with the technology
C. Clearly defined requirements
D. A budget with plenty of cash reserve
3. Complete the sentence: Research allows the project manager to create the vision of the project. ________________ allows the project manager to transfer the vision.
A. Dedication
B. Inspiration
C. Commitment
D. Leadership
4. You are coaching a junior project manager on quality and grade. What is the difference between quality and grade?
A. Quality is the conformance to requirements, while grade is the ranking of the quality.
B. Quality is the conformance to requirements, while grade is a ranking assigned to a material or service.
C. There is essentially no difference between quality and grade when it comes to project management.
D. Quality is the end result of the project, while grade is the ranking of the quality as the project moves toward completion.
5. How are the value of a project deliverable measured?
A. A service is measured by the initial usage.
B. A product is measured by the initial usage, and then its worth declines with each usage.
C. A service is measured with each usage; goods are measured only on the first usage.
D. Services and goods are measured with each usage. The more often each is used for productivity, the more worthy the deliverable.
6. Management has asked that you include the details of quality assurance in your project management plan. What is quality assurance?
A. It is the measured value of the goods or service over a set period of time.
B. It is the measured value of the goods or service for the duration of its usage.
C. It is an organization-wide approach to preventing quality defects.
D. It is an organization-wide approach to ensure that the project managers are applying corrective actions on a regular basis.
7. Every predictive project must plan for quality as part of the project’s planning processes. What is the purpose of quality planning?
A. It determines which quality standards are relevant to the project.
B. It is not needed on every project, because smaller projects are easier to manage.
C. It ensures that the project manager and the project team are completing the work.
D. It is needed only if the organization is using Six Sigma, TQM, or ISO-certified programs.
8. Of the following, which is a factor that measures the quality of the management process?
A. Project plan
B. Results
C. Project team
D. Budget management
9. All of the following do not describe QC except for which one?
A. Prevention
B. Assurance
C. Inspection
D. Quality standards
10. What is the purpose of a project information center?
A. To centrally organize the resources, planning, and research phases of a project
B. To centrally organize the resources, planning, research, and implementation phases of a project
C. To centrally organize the project team, resolve disputes, and provide additional resources for all projects within an organization
D. To centrally organize all projects within an organization
11. What value determines that when seven consecutive results of testing are on one side of the mean this is an assignable cause?
A. Six Sigma
B. Control Limits
C. Rule of Seven
D. Pareto’s Law
12. What is the purpose of a Pareto chart?
A. It tracks trends over time.
B. It plots the results of sampling to determine the root cause of each problem.
C. It ranks the quality of each component within a project.
D. It ranks the quality problems within a project from highest frequency to lowest frequency.
13. Which software testing approach is the final type of testing before the product goes live?
A. Smoke testing
B. Unit testing
C. Regression testing
D. User acceptance testing
14. What is the definition of total quality management?
A. It is a process that all employees within an organization work to fulfill customers’ needs while also working to improve profitability.
B. It is a process that all employees within an organization work to fulfill customers’ needs while also working to improve productivity.
C. It is a process that upper management leads by enforcing quality in all of their work. The quality implementation will trickle down through the organization.
D. It is a process that a project manager must implement quality by leadership and a series of risk/reward principles.
15. What is continuous quality improvement?
A. It is the theory that all practices within an organization are processes and that processes can be infinitely improved.
B. It is the theory that all practices within an organization can be infinitely improved.
C. It is the theory that all practices within an organization are projects and that all projects can be infinitely improved throughout the life span of the implementation.
D. It is the theory that all organizations provide services and that these services can be continuously improved.
Answers
1. C. Risks are not part of the Iron Triangle of Project Management. While risks can have an adverse effect on the project, the Iron Triangle of Project Management is actually composed of time, cost, and scope.
2. C. Clearly defined requirements are necessary for the project manager to check the status of the project’s work. Should the project be moving away from the project’s objective, the project manager must take corrective actions to nudge the project back on track.
3. D. Leadership allows the project manager to transfer the vision of the project from a personal concept to a goal for the project team.
4. B. Quality is the capability of a project to conform to the requirements as expected by the customer. Quality is planned into a project, not inspected into it. Grade is the ranking of a material or service, such as paper, metal, or first-class versus coach.
5. D. Goods and services are measured with each usage. The more often the goods and services are used productively, the greater their value. An expensive project that creates a deliverable that is rarely used has a small ROI.
6. C. QA is an organization-wide approach to ensuring the prevention of defects within the project. QA is prevention driven, while QC is inspection driven.
7. A. Quality planning is the process of determining which quality standards are relevant to a project and then determining how the project work will achieve these quality requirements.
8. B. The results of a project are always the ultimate barometer of quality for a project. The planning, the project team, and budget management, among other attributes, must all work in harmony to create quality results.
9. C. Inspection is a key activity within QC.
10. B. A project information center is useful for organizing all facets of a project. It is typically a room dedicated to the project where resources, testing, and documentation can take place.
11. C. The Rule of Seven is a guideline that states when seven consecutive results of testing fall on one side of the mean in a control chart, there is some purpose for the event. This is an assignable cause.
12. D. A Pareto chart is a type of histogram, or bar chart, that categorizes quality problems from highest frequency to lowest frequency. The chart helps the project team determine which problems to attack first through corrective actions.
13. D. User acceptance testing is the final round of testing to confirm quality and acceptability before the product is released into production.
14. B. TQM is the belief that all employees within an organization are consistently working to fulfill customers’ needs and at the same time working toward improving productivity by refining processes.
15. A. Continuous quality improvement is the theory that all practices within an organization are processes. These processes then can be infinitely improved to streamline the business and better the quality of the organization regardless of its deliverable.