How to improve your data fluency: Overcome your analytics anxiety
What you’ll learn
In this short chapter we will introduce the notion of analytics anxiety as a major barrier to talking about data in a constructive way in organisations. You will learn about the main components of analytics anxiety and how to overcome it. This prepares the ground for the following chapters.
Data conversation
Josh: Shall we ask your new data analyst, Eric, to come in and brief us about our risk exposure?
Steve:Uhm, this guy speaks gibberish, I’m sorry. Why don’t we connect him with my assistant Gill and let her report to me the essentials then?
Josh: But Steve, I think you can really gain more insights by interacting directly with him. There are some nuances regarding our risk constellation that his cluster analysis has brought to light.
Steve:Yeah but I’m not really a quant. Let Gill crunch the numbers with him and get me the so-what, okay?
Josh: As you wish Steve, but eventually you will need to ramp up your game, you know. Even the CEO said we’re on our way to a data culture in our company.
Steve:So, Gill did you have a chance to talk to that Eric guy about our risk exposure?
Gill: Yes, I did, and he really had amazing insights for us on where we are exposed to risks, and more importantly, how to reduce our risk exposure. We have to be mindful of the assumptions underlying the cluster analysis that he did though.
Steve:What do you mean?
Gill: Well, the way he grouped our risks is one way, but I think we need a less granular approach for our context to keep it efficient for decision making.
Steve:So, the cluster analysis did not reveal a clear-cut risk grouping?
Gill: Of course not, it gives us just the similarity metrics among all of our documented risks and various ways of grouping them. But you know that’s how clustering works, right?
Steve:Ehem, sorta.
Gill: Here’s the dendrogram, where would you cut off the groups (shows him a complex looking chart)?
Steve:Um, I have no clue.
Gill: I thought you could provide some input based on your strategic outlook on risks. Combined with this data-driven chart, that would really be the ideal combination and help us devise a risk segmentation and corresponding measures.
Steve:I guess I’ll have a look at this cluster analysis thing first and then get back to you.
Gill: Let’s do that, why not have Eric on board for that discussion, I think it will help combine all of our insights together.
Steve:Okay, let’s try this.
Gill: In fact, why don’t we let him walk us step-by-step through the cluster analysis. This way we can combine learning the method and learning about our risk data.
Steve:Okay, deal.
A new era of analytics has dawned and every manager and professional is now expected to be able to make evidence-based decisions, using the latest analytics tools and techniques.
Whether you work in sales and marketing, communication, controlling, strategy, HR, risk management, R&D or project management, data has become the new oil and no one can afford to ignore it or use it inadequately.
There’s just one problem: not everybody is a rocket scientist.
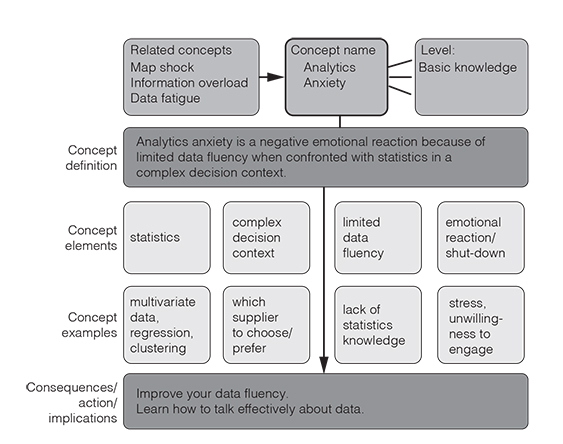
We are not all highly data literate or well versed in sophisticated statistical procedures. Consequently, we may suffer from what we call analytics anxiety. In the following, we would like to introduce you to this crucial and timely concept, show why it matters, how it comes about and what you can do to reduce it when working with data in organisations (see Figure 1.1 for an overview on what’s to come in this chapter).
What is analytics anxiety?
We define analytics anxiety as feelings of fear, distress or uncertainty associated with the collection, analysis, presentation, interpretation and use of quantitative data in organisations. Analytics anxiety hence includes any feeling of distress during the process of data collection, analysis and especially communication in presentations, reports or dashboards.
Why should you care?
Analytics anxiety can severely hurt the quality of decision making and negatively influence job satisfaction. It can contribute to burnout and may cause unnecessary conflicts in management teams.
Managers and professionals who experience analytics anxiety are less likely to engage with complex data and may rely too much on their prior experiences, biases, fake news or on anecdotal evidence.
So, if you care about decision quality, and making evidence-based instead of eminence- or eloquence-based decisions, then you should care about analytics anxiety.
You should care about this phenomenon if you’re a professional relying on data for decision making. If you want others to learn from your data and analyses, then you should know about analytics anxiety and what causes it, as well as effective remedies. Which brings us to our next section . . .
What causes and what reduces analytics anxiety?
Having conducted dozens of courses and training on analytics for both managers and analysts, here’s what we have come to learn about the root causes and about effective solutions to this challenge.
In terms of underlying drivers of analytics anxiety affecting professionals and managers, we have identified the following seven motives for shying away from data or short-cutting one’s own analytic reasoning and data deep dives:
- 1. Stat phobia – the fear of not being able to understand or interpret data correctly because of a lack of statistical understanding.
- 2. Chart shock – being cognitively and motivationally overwhelmed by the visual complexity inherent in interactive dashboards and visual analytics.
- 3. Data quality paranoia – an uneasy feeling regarding the data quality (i.e., reliability, timeliness, consistency) on which the analytics is based.
- 4. Data scepticism – the feeling that the data on its own is an insufficient base for taking a decision and that intuition and experiences should be taken into account as well.
- 5. Black box allergy – distrust in the opaque inference processes associated with data analysis, whether human-assisted or artificial-intelligence based.
- 6. Incompetence compensation competence – the reluctance to admit (in front of others) that one does not fully grasp the presented analytics. Consequently, managers only address the part of the data that they understand and neglect more difficult analytics elements.
- 7. Data fatigue – the state of being cognitively or emotionally overloaded when being presented with too much data to process in a given time period.
To address these important issues, both decision makers and data presenters have a job to do. In a nutshell, we suggest the following remedies to the analytics anxiety pandemic:
For decision makers:
- 1. Invest in your data fluency. Read this book carefully. Pay special attention to the chapter on analytics Q&A, but also try to understand the key take-aways from the chapters on understanding data and statistics.
- 2. Get reverse mentoring from younger or more well-versed colleagues who can give you a tour through analytics applications such as Tableau, RapidMiner, SAS or Power BI.
- 3. Oblige your analysts to pre-structure their results in categories that you’re familiar with. Also, ask them to focus their analysis on the data that is really crucial for your decisions (to avoid chart shock or data fatigue). Tell them about proven data communication practices, such as those in the chapter on data visualisation and design and the one on the five magic ingredients of data storytelling.
- 4. Admit when you don’t understand a data set or statistical procedure. You’re setting an example for others and hence helping steer conversations away from pseudo understanding to greater clarity.
For those of you who are presenting data:
- 1. Boost your analytics communication skills and learn which mistakes analysts and data scientists are most likely to make and should avoid (such as providing details without overview or focusing on methodology first instead of why and for whom the data matters).
- 2. Respect the key visualisation guidelines when showing your analytics results graphically (such as never using pie charts or stacked bar charts as they are perceptually inefficient). Check out the data visualisation and design chapter in this book.
- 3. Combine big data with big knowledge by representing your numeric analyses side-by-side with knowledge visualisations which illustrate qualitative insights in overview.
- 4. Use the power of data storytelling to make your data more easily understandable and engaging. Use our data storytelling chapter to prepare and design your data presentations. In doing so, pay attention to first achieve common ground with your audience (front-load examples) and then clarify the situation, complications and resolution through your data. Close your data presentation with a concise call to action – if possible.
Key take-aways
If an organisation wants to profit from the data it gathers for better decision making and opportunity detection, then it must address the issue of analytics anxiety. Simply hoping that people will interact seamlessly around data is naïve.
Real efforts need to be undertaken on both sides to improve this important interface between in-depth data expertise and managerial decision power. Academic research has an important role to play in this optimisation effort. HR professionals should study to what extent analytics anxiety exists, what its main drivers are, and which measures best reduce it. They can then transform their findings into management, consultant and analyst training. Together, these groups can take the anxiety out of analytics.
 Traps
Traps
The key risks regarding analytics anxiety are:
- ●Making decisions based on an inadequate understanding of relevant data.
- ●Shying away from important in-depth discussion with data scientists about essential business opportunities.
- ●Making people look foolish when they ask honest questions about analytics procedures.
- ●Establishing a confrontational relationship among data analysts and business professionals instead of a collaborative one.
Further resources
To quiz yourself on your current data fluency, use one of these websites and their short tests:
https://quizlet.com/435307132/data-fluency-quizzes-flash-cards/