
![]()
Power View is built from the ground up to enable you, the user, to sift through mounds of facts and figures so that you can deliver meaningful insights. Consequently, what matters is being able to delve into data and display the information it contains quickly and accurately. This way, you can always follow up on a new idea or simply follow your intuitions without needing either to apply complex processes or to struggle with an impenetrable interface. After all, Power View is there to help you come up with new analyses that could give your business an edge on the competition.
Filtering the potentially vast amounts of data that stand between you and the insights that could make all the difference to your business is profoundly important. The people who developed Power View recognized this, which is why you can filter on any field or set of fields in the underlying data model. This is not only intuitive and easy, it is also extremely fast, which ensures that you almost never have to wait for results to be returned.
You can add filters before, after, or during the creation of a Power View report. If you add filters before creating a table, say, then your table will only display the data that the filter allows through. If you add a filter to an existing report, then the data visualization will alter before your eyes to reflect the new filter. If you modify a filter when you have visualizations on a Power View report, then (as you probably guessed by now), all the visualizations will also be updated to reflect the new filter criteria—instantaneously.
You can filter any type of data:
- Text
- Numeric values
- Dates
Each data type has its own ways of selecting elements and setting (where possible) ranges of values that can be included—or excluded. This chapter will explain the various techniques for isolating only the data that you want to display. You will then be able to create Power View reports based only on the data that you want them to show.
This chapter, like the previous one, will presume that you have downloaded the file CarSales.xlsx into the folder C:HighImpactDataVisualizationWithPowerBI, assuming you want to try out the filtering techniques for yourself.
Filters
Subsetting data in Power View is based on the correct application of filters. Consequently, the first thing that you need to know about filters is that they work at two levels. You have
- View-level filters
- Visualization-level filters
The characteristics of these two kinds of filter are described in Table 3-1.
Table 3-1. Power View Filters
|
Filter Type |
Application |
Comments |
|---|---|---|
|
View-level |
Applies to every visualization in the current report |
This kind of filter will filter data for every visualization in the current view. |
|
Visualization-level |
Only applies to the selected visualization |
This kind of filter will apply only to the selected visualization (table, chart, etc.). |
Hiding and Displaying the Filters Area
When you first open Power View you will probably see the Filters Area displayed to the immediate right of the Power View report; it looks like a narrow empty sheet of paper. There could be times when you will not be filtering data, and so you may prefer to hide the Filters Area to increase the available screen space you need to hone your report. So, if you wish to remove the Filters Area from view
- Activate the Power View ribbon (if it is not already active).
- Click the Filters Area button and the Filters Area will slide out of view.
To Display the Filters Area
- Activate the Power View ribbon (if it is not already active).
- Click the Filters Area button and the Filters Area will reappear.
Alternatively, to hide the Filters Area, you can click on the Close Filters Area button (the small X in the top right-hand corner of the Filters Area) and it will obligingly remove itself from view.
If you prefer to collapse the Filters Area while leaving a thin strip visible to the immediate right of the Power View report, you can click the Minimize icon (a lesser-than symbol in the top right-hand corner of the Filters Area) and the Filters Area will collapse nearly completely out of sight. You can make it reappear at any time by clicking the Expand icon (a greater-than symbol) in the top right-hand corner of the slimmed-down Filters Area. The elements of a typical Filters Area are set out in Figure 3-1.

Figure 3-1. The essential parts of the Filters Area
View Filters
Saying that there are two types of filter available in Power View is a purely descriptive distinction. For Power View, any filter is a filter, and all filters work in the same way. However, as there is a clear hierarchy in their application, I will begin with view filters and then move on to their descendants—the visualization filters. Given the general similarity between the two, it is probably worth noting that it is important that you check that you are creating or modifying the appropriate filter. As this is not always obvious, at least when you are starting out with Power View, you need to look out for the word View, which is at the top of the view area. If it is not grayed out, this will tell you that you are working on a view filter. To be really sure that you are creating or modifying a view filter, a good trick is to ensure that no visualizations are selected in the Power View report—or even to click on a blank part of the report canvas to be extra sure that you are dealing with a view filter. In this case, only the word View will be displayed at the top of the view area.
Adding Filters
The Filters Area helpfully advises you To Filter The View, Drag Fields From The Fields List. And yes, it really is that simple. Here is how to add a filter to select only a couple of countries from those available in the source data. In this case, we will add the filter before creating a Power View table:
- In the Power View Field List, expand the table containing the field that will be a filter criterion (Countries in this example).
- Drag the CountryName field into the Filters Area. The Filters Area will display all the unique elements in the source table; in this case it will be a list of countries.
- Select two or three elements by clicking on the appropriate check boxes (France, Germany, and Spain, in this example). The Filters Area will look like Figure 3-2.

Figure 3-2. A simple filter to select specific countries
![]() Note The filter will include the number of elements in the data table for each filter element. For a reference-style table such as this one for countries, this will probably always be “1.” For a table containing metrics, the figures will be much larger.
Note The filter will include the number of elements in the data table for each filter element. For a reference-style table such as this one for countries, this will probably always be “1.” For a table containing metrics, the figures will be much larger.
To see the filter working, I suggest creating a table using the following fields:
- CountryName (from the Country table)
- Colour (from the Colours table)
- SalePrice (from the SalesData table)
You will see that data is only displayed for the countries that were selected in the filter. Of course, you do not need to display the CountryName field in the table just because it is used to filter the data. In a real-world Power View report, you will probably not display a field in a table or chart if it is being used to filter data. However, if you want to confirm to yourself that filters work, then you can always display them in a table or chart, and once you are happy that the results are what you expect, you can remove the filtering field from the table. The resulting table should look like Figure 3-3.

Figure 3-3. A simple filtered table
You will have noticed that when the filter was first applied, every check box was empty, including the (All) check box. The default is (fairly logically) to set up a filter ready for tweaking, but not actually to filter any data until the user has decided what filters to apply. Once you start adding filter elements, they will be displayed in the Filters Area just above the name of the field that is being used to filter data. Well, as many filters as will fit on one line will be displayed to indicate that filters are active.
![]() Tip There is a subtle difference that you need to watch out for when selecting filter elements. If you click on the check box, then an element is added to filter (or removed if the check box was already checked). If, however, you click on the name of an element, then all currently selected elements are deselected, and only the element that you clicked on is active in filtering the data.
Tip There is a subtle difference that you need to watch out for when selecting filter elements. If you click on the check box, then an element is added to filter (or removed if the check box was already checked). If, however, you click on the name of an element, then all currently selected elements are deselected, and only the element that you clicked on is active in filtering the data.
You modify filters the same way you apply them. All you have to do to remove a selected filter element is to click on the check box with a check mark to clear it. Conversely, to add a supplementary filter element, just click on a blank check box.
The only subtlety concerning simple filters is that you also have the (All) check box. This acts as a global on/off switch to select, or deselect, all the available filter elements for a given filter field. The (All) filter field has three states:
- Blank—No filters are selected for this field.
- Checked—All filters are selected for this field.
- Filled-in—Some (but not all) filters are selected for this field.
Clicking a filled-in (All) filter field will deselect all filter elements for this field, in effect rendering the filter inactive. Checking the (All) filter field will select all filter elements for this field, also rendering the filter inactive. Removing the check mark from the (All) filter field will deselect all filter elements for this field, also rendering the filter inactive. Clicking multiple times on the (All) filter field will cycle through the available options.
The (All) filter field is particularly useful when you want not only to remove multiple filter selections in order to start over but also want to select all elements in order to deselect certain elements individually (and avoid manually selecting reams of elements).
![]() Note When selecting multiple elements in lists, you may be tempted to apply the classic Windows keyboard shortcuts that you may be in the habit of using in, for instance, Excel or other Windows applications. Unfortunately Control- or Shift-clicking to select a subset of elements will simply not work. In addition, although you can select and deselect a check box using the spacebar, it is not possible to use the cursor keys to pass from one element to another in a filter list.
Note When selecting multiple elements in lists, you may be tempted to apply the classic Windows keyboard shortcuts that you may be in the habit of using in, for instance, Excel or other Windows applications. Unfortunately Control- or Shift-clicking to select a subset of elements will simply not work. In addition, although you can select and deselect a check box using the spacebar, it is not possible to use the cursor keys to pass from one element to another in a filter list.
Setting up a finely honed filter so that you are drilling through the noise in your data to the core information can take some practice. Fortunately, the virtually instantaneous application of filters means that you can see almost immediately if you are heading down the right path in your analysis. However, there are frequent occasions when you want to start over and remove any settings for a particular filter. This can be done as follows:
- Click the Clear Filter icon to the right of the selected filter. This icon is shown in Figure 3-4.

Figure 3-4. Clearing a filter
Once a filter has been cleared the only way to get it back to its previous state is to click Undo (or press Ctrl-Z) immediately. Otherwise you will have to rebuild it from the ground up.
![]() Tip An interesting trick to note is that if you click on the filter field in the Filters Area, you can expand and collapse the filter.
Tip An interesting trick to note is that if you click on the filter field in the Filters Area, you can expand and collapse the filter.
When working with filters, at times you may want to clear the decks and start over. The fastest way to do this is to delete a filter; once a filter is deleted, it produces no effect on the data in the Power View report. This can be done as follows:
- Click the Delete Filter icon to the right of the selected filter. This icon is shown in Figure 3-5.

Figure 3-5. Deleting a filter
Once a filter has been deleted the only way to get it back is to click Undo (or press Ctrl-Z) immediately. Otherwise you will have to rebuild it from scratch. Interestingly, although you can add filters by dragging elements into the Filters Area, you cannot drag them out of the Filters Area to remove them.
Expanding and Collapsing Filters
When you only have a few filters active in a Power View report, and when those filters only contain a few elements, then having all the filter elements visible at the same time is no real problem. However, when you are using multiple filters and/or are employing filters that contain dozens, or hundreds, of elements, then managing filters may require a little attention.
To give a more uncluttered aspect to the Filters Area, the simplest thing to do is to collapse any filters once you have defined them. To do this
- Click the Collapse icon (a filled triangle facing down and to the right situated to the left of the filter title). The filter elements will disappear, leaving only the filter title and the list of selected elements.
Note that if no elements are selected for a filter, then (All) will be displayed under the filter title. A collapsed filter is shown (with some selected elements) in Figure 3-6.

Figure 3-6. Collapsing a filter
To expand a filter and continue refining the selection
- Click the Expand icon (an empty triangle facing right, situated to the left of the filter title). The filter elements will reappear, as you saw previously in Figure 3-2.
Depending on the source data that you are using, you could have only a few elements making up each filter. If so, then you should probably consider yourself lucky, because many data sets can contain dozens, or hundreds of filter elements. If this is the case, then you will probably need to know a few simple techniques for handling long lists of filter elements.
First, we need to specify what exactly a “large” filter list is. Fortunately Power View helps us here, as it will start helping to manage lists once there are more than 10 (or so) elements in the list. If more than 20 elements are in a filter (this will depend on several factors including your screen resolution and how many filters you have placed in the Filters Area), then Power View will limit the number of elements displayed and will display a vertical scroll bar. This way you can scroll through the available filter elements.
Searching for Specific Elements in a Filter
So, assuming you have a large list of filter elements, just how can Power View help you?
Very simply, you can search for any text inside a list of elements. For instance, assuming you have added a filter on ClientName (by dragging the ClientName field from the Clients table into the Filters Area), you will see immediately that for Power View, this is a large set of filter elements, because it adds a Search box between the filter name and the filter detail (this is the box with a magnifying glass to the right). To search for a specific element
- Click inside the Search box.
- Enter the (hopefully few) characters that are enough to isolate the element that you are looking for. I suggest entering the word England.
- Click the magnifying glass to the right of the Search box (or press Enter).
Power View will return only a subset of the filter elements that contain the characters that you have searched on. The characters that you entered will be highlighted inside each of the filter elements that is returned. It is worth noting that the character string you entered will be found anywhere inside the filter elements. An example of this search facility is shown in Figure 3-7.

Figure 3-7. Searching inside a filter
Once you have returned the subset of filter elements, you can select the ones you want as described earlier. Do remember that when searching in a filter, you can only find elements that are available. So, if there are other active filters, you might not get all the results you were expecting.
To clear the filter on a filter that you created using the Search box, all you have to do is
- Click the small X to the right of the Search box. This X replaced the magnifying glass once you activated the filter search.
The search string will be removed, as will the filter on the filter elements. All the filter elements (or at least, as many as can be displayed) will reappear in the filter. Be aware that just deleting the contents of the Search box might not produce the result you were expecting!
When searching through a large and varied set of filter elements, you might want to bring back elements based not on a specific search string, but on a string containing certain letters or combinations of letters. This is called a wildcard search. For instance, when searching car colors, you could indicate to Power View that you want all filter elements that contain the letter “a” followed anywhere further in the element by the letter “e.” So, if you take this as an example of a subset of filter elements that you want to isolate, this is what you have to do:
- Add the Colours field to the Filters Area (unless you have already done so).
- Enter the search string a*e in the search box, as show in Figure 3-8.

Figure 3-8. Wildcard filter search
- Click the magnifying glass to the right of the Search box (or press Enter).
- Select the elements from the filter subset to which you want to apply the filter. Only cars of the selected colors will appear in any visualization.
As you can see, the wildcard search returned only the following colors in the filter:
- British Racing Green
- Canary Yellow
- Dark Purple
All of these colors contain the letter “a” followed further in the element by the letter “e.” Of course, this example is not necessarily very practical, but it shows how you can extend the search facility for filter elements to widen a search by using the asterisk wildcard. This will return any number of characters in the place of the asterisk.
Finally, if you want a slightly narrower search—for just one character—you can use the question mark (?) character. Entering the search string g?e in the search box will return
- British Racing Green
- Green
Using the question mark wildcard character will force Power View to find a character; for instance, entering ?r will find several colors, but not Red, because the search string states “any r preceded by a single character.” As the initial R in Red is not preceded by any character, it is consequently not found. However, searching for *r will find Red, as the asterisk implies zero or more characters.
![]() Note This search facility is not case sensitive.
Note This search facility is not case sensitive.
Clearing a Filter Element Search
To cancel a filter element search (and remove the search string from the Search box), click the X (which replaces the magnifying glass when a Filter element search is active). The search string will be removed and the subset of filter elements will be replaced with the available filter elements—or at least by as many elements as Power View can display.
Filtering Different Data Types
So far we have only seen how Power View can filter text elements in a view. Although text-based elements are a major part of many data filters, they are far from the only available type. There are also
- Numeric Data
- Date and Time Data
You can filter on numeric elements just as you can filter on text-based elements in Power View. However, although the core principles are the same, there are some interface differences and tricks that you probably need to know.
The first trick worth knowing is that, when filtering on numeric data, you do not only have the choice of selecting elements from a list. You also have a range selector, which is the default filter for numeric filters. The range selector is a slider, which allows you to set the lower and upper limits of the range of numbers that you want to display in a Power View report.
To set the range of figures for which data will be displayed
- Drag a numeric field into the Filters Area (CostPrice in this example). The field title and a blue range slider bar appear in the Filters Area. The initial range filter is given in Figure 3-9. You can see that the range filter starts with the lowest available value and ends with the highest available value.

Figure 3-9. A range filter for numeric values
- Place the mouse pointer over the left-hand (lower) extremity of the blue range slider bar for the selected filter. The mouse pointer becomes a two-headed arrow.
- Slide the left-hand range limiter to the right. You will see the constituent elements of the field appear above the slider and below the field title, preceded by Is Greater Than Or Equal To X, where X is the figure from the source data. The figures will increase from smaller to larger the further to the right you slide the range boundary. Stop when you have reached a suitable lower bound for the data. This is shown in Figure 3-10.

Figure 3-10. Setting a range filter
- Place the mouse pointer over the right-hand (upper) extremity of the blue range slider bar for the selected filter. The mouse pointer becomes a two-headed arrow.
- Slide the upper range limiter to the left. You will see the constituent elements of the field appear above the slider and below the field title, preceded by Is Between lower range boundary And X, where X is the figure from the source data. Stop when you have reached a suitable upper bound for the data.
That is it; you have set a range for all data in the Power View report corresponding to the selected field. It should look like Figure 3-11.

Figure 3-11. A filter range
When selecting a range of numeric data you do not, of course, have to set both upper and lower bounds. You may set one, the other, or both. Also you will have noticed that the figures that are displayed as you alter the boundaries are not in any regular progression. This is because they are extrapolated from the actual data, as it is in the data source.
![]() Note Numeric filters seem to support 400-plus increments—less if the data has a smaller range.
Note Numeric filters seem to support 400-plus increments—less if the data has a smaller range.
In some cases you may prefer to select real values to filter numeric data. This is, in my experience, more rarely required, but it can be useful when you wish to exclude outliers at either end of the data spectrum.
To switch a numeric list to List Filter Mode (I will use the CostPrice filter, which we just set up)
- Hover the mouse pointer over the filter title (the field name you selected when you created the filter). The filter title will turn blue.
- Click on the Filter Mode icon to the right of the filter title. This is the first of the three icons at the top right of the filter. You should see something like Figure 3-12.
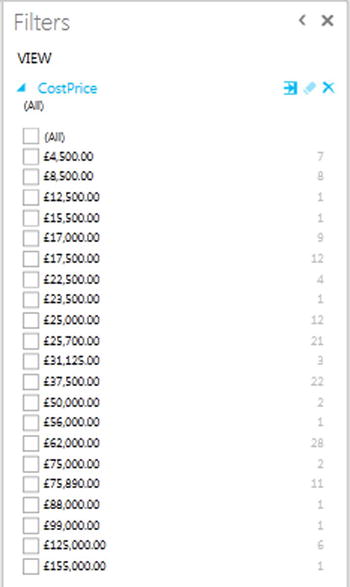
Figure 3-12. A list filter
That is it; you will now see the numeric data in list mode, and you can select specific values.
![]() Tip Be warned, however, that it is not because no values are selected that the filter is inactive. You need to be careful and check the filter title, which could still say Is Between value And value. This indicates that a filter is active. To reset the filter so that the range filter is deactivated, you need to click the (All) filter field, twice, preferably. This will select, then clear, all the check boxes for all the elements in the list.
Tip Be warned, however, that it is not because no values are selected that the filter is inactive. You need to be careful and check the filter title, which could still say Is Between value And value. This indicates that a filter is active. To reset the filter so that the range filter is deactivated, you need to click the (All) filter field, twice, preferably. This will select, then clear, all the check boxes for all the elements in the list.
You can then select, or exclude, any specific elements, as you did earlier in the chapter for colors. In practice, you may want to exclude any values that are suspiciously high or low and presume that they are outliers that need to be filtered out of the dataset. Alternatively, you may want to select any suspicious-looking values in order to take a closer look at them.
To flip back to Range Filter mode
- Hover the mouse pointer over the filter title (the field name you selected when you created the filter). The filter title will turn blue.
- Click twice on the Filter Mode icon to the right of the filter title. This is the first of the three icons at the top right of the filter.
You will see that the list filter disappears, and in its place the range filter reappears.
When cycling through the filter modes (by clicking on the Filter Mode icon to the right of the filter title) you will see that there is also an Advanced Filter mode. As this will be described very shortly, I will not describe it here. Power View is also very helpful in providing a tooltip when you hover the mouse pointer over the Filter Mode icon that tells you what the next filter mode will be if you click on the icon.
Quickly Excluding Outliers
A few paragraphs ago I mentioned the possibility of excluding outliers. There is a quick trick to getting this done efficiently that you may find useful:
- Drag the filter for the field containing the outlier value to the Filters Area.
- Click on the Filter Mode button to switch to List Filter mode.
- Click (All) to select all the values in the list filter.
- Uncheck the values that are at the upper and lower limits of the filter elements and that you consider to be outliers.
By definition, there should only be a few outliers, so this process should only take a few seconds.
At its simplest, date and time data is merely list data, like the List Filter mode for numeric data. Consequently, dragging a Date, Time, or DateTime field into the Filters Area will add a list of discrete elements from the data source. You can then select all, none, or a chosen subset of elements from the list as was described for text-based data. If your data has a Date table (or as datawarehousing people would call it, a Date Dimension), then you could well be using this to select date filter criteria. What you need to know here is that dragging a date hierarchy (or any other hierarchy for that matter) to the Filters Area will add every element in the hierarchy as a separate filter. Let’s see this in action.
- Expand the Date table in the Field List.
- Drag the Year hierarchy to the Filters Area. Figure 3-13 demonstrates this.

Figure 3-13. A date filter based on a hierarchy
What you are looking at is, in essence, multiple filters, where you can select elements from each of the different filters: Year, Quarter, and/or Month. Alternatively, if you will be filtering on successive elements in a date hierarchy (Year, followed by Month, for instance) you may find it more intuitive to drag the filter elements from the date hierarchy to the Filters Area in the temporal order in which you will be using them (that is, Year followed by Month, and probably not even Quarter). This way, you can proceed in a logical manner, from top to bottom in the Filters Area, to apply the date criteria that interest you.
![]() Note If, or when, you want to delete filters that were added as a hierarchy, you will have to delete them individually, as you cannot remove all the fields that make up the hierarchy together. Fortunately this only takes a few seconds.
Note If, or when, you want to delete filters that were added as a hierarchy, you will have to delete them individually, as you cannot remove all the fields that make up the hierarchy together. Fortunately this only takes a few seconds.
However, if you are faced with multiple dates that are taken directly from source data, and you do not have a time table in your PowerPivot data, it is frequently easier to set ranges for dates. This is best dealt with by using the advanced filters for all the available data types. These kinds of filters are explained in a following section.
Other Data Types
There are, of course, other data types in the source data that you are likely to be handling. You might have boolean (True or False) data, for instance. However, for Power View, this is considered, for all intents and purposes, to be a text-based filter. So if you filter on boolean data, Power View will display True and False in the expanded filter for this data type. You can see this if you expand the Client table and drag IsCreditWorthy to the Filters Area. On the other hand, there are some data types that you cannot use to filter on, and that will not even appear in the Filters Area. Binary data (such as images) is a case in point.
So far we have treated filters as if only one was ever going to be applied at a time. Believe me, when dealing with large and intricate data sets, it is unlikely that this will be the case. As a matter of course, Power View will let you add multiple filters to a report. This entails some careful consideration of the following possible repercussions:
- All filters will be active at once (unless you have cleared a filter), and their effect is cumulative. That is, data will only be returned if the data matches all the criteria set by all the active filters. So, for example, if you have requested data between a specified date range and above a certain sales figure, you will not get any data back where the sale figure is lower than the figure that you specified or the sales date is before or after the dates that you set.
- It is easy to forget that filters can be active. Remember that all active filters in the Filters Area will remain operational whether the Filters Area itself is expanded or collapsed. If you are going to collapse filters to make better use of the available space on the screen, then it is worth getting into the habit of looking at the second line below any filter title that will give you a description of the current filter state. It will display something like Contains Rolls. Of course, the exact text will vary according to the filter that you have applied.
- Filters can interact in the Filters Area. The time hierarchy is a case in point. If you select Quarter 3, for instance, you will only see the months for that quarter in the Months filter.
Advanced Filters
In many cases, when you are delving into your data, merely selecting a “simple” filter will be enough to highlight the information that interests both you and your audience. There will, however, inevitably be cases when you will need to filter your data more finely in order to return the kinds of results that sort the wheat from the chaff. This is where Power View’s advanced filters come to the fore. Advanced filtering lets you search inside field data with much greater precision, and it is of particular use when you need to include, or exclude, data based on parts of a field (if it is text) or a precise range (if it is a number or a date).
Advanced filters, just like standard filters, are adapted to the three main data types that Power View handles, namely
- Text
- Numbers
- Dates
so it is best to look at each of these separately. However, before going through all the details, you first need to know how to switch to Advanced Filter mode in Power View.
Let’s begin with a simple example of how to apply an advanced filter to a text field. You have to
- Add a field on which you want to filter to the Filters Area (unless, of course, the filter is already in place). In this example, it will be the ClientName field.
- Expand the filter field (you can see a list of individual data elements from the field) unless it has already been done.
- Click on the Advanced Filter Mode icon to the right of the filter header. The body of the filter switches to show the Advanced Filter boxes, and the text under the filter title now reads Show Items For Which The Value. This is shown in Figure 3-14.

Figure 3-14. Advanced filters
- Click inside the filter text box (under the box displaying Contains) and enter the text to filter on (Aldo in this example).
- Click Apply Filter, or press the Enter key, and all objects in the Power View report will only display data where the client contains the text Aldo. The result (a sample table) is shown in Figure 3-15; the advanced filter used to produce it is also shown.

Figure 3-15. The results of applying an advanced filter
Here are several comments that it is important to make at this stage:
- Advanced filtering is not case sensitive. You can enter uppercase or lowercase characters in the filter box; the result will be the same.
- Spaces and punctuation are important, as they are taken literally. If you enter, for instance “A ” (without the quotes, but note the space after the A), then you will only find elements containing an A (uppercase or lowercase) followed by a space.
- Advanced filters, just like standard filters, are cumulative in their effect. So, if you have applied a filter and do not get the results you were expecting, be sure to check that no other filter is active that might be narrowing the data returned beyond what you want.
- If your filter excludes all data from the result set, then any tables in the Power View report will display This Table Contains No Rows.
- Similarly, if your filter excludes all data, charts will be empty, and multiple charts will display Contains No Small Multiples To Display.
In any case, if you end up displaying no data, or data that does not correspond to what you wanted to show, just clear the filter and start over!
Inevitably you will also need to know how to remove an advanced filter. The process is the same as for a standard filter; all you have to do is
- Click the Clear Filter icon (the middle icon of the three to the right of the filter field name). The filter elements are removed for this filter.
You can, of course, if you have no further need for the entire filter, delete the filter by clicking the Delete Filter icon (the right-hand one of the three to the right of the filter field name). This will not only clear the filter settings, but it will delete the entire filter.
A few pages previously we saw how to use wildcards to create a subset of filter elements that would then be used to select specific values. Well, you can also use wildcards directly to filter data using the Advanced Filter mode. To apply a wildcard filter to your data
- Add a field on which you want to apply a wildcard filter to the Filters Area (unless, of course, the filter is already in place). I suggest using the ClientName field.
- Expand the filter field (you can see a list of individual data elements from the field) unless this has already been done.
- Click on the Advanced Filter Mode icon to the right of the filter header. The body of the filter switches to show the Advanced Filter boxes, and the text under the filter title now reads Show Items For Which The Value.
- Click inside the filter text box (under the box displaying Contains) and enter the filter text containing one or more wildcards. In this example it will be u*e.
- Click Apply Filter, or press the Enter (Return) key, and all visualizations in the Power View report will only display data where the Client contains the character “u” followed anywhere by the character “e.”
As you can see in Figure 3-16, the result is that the Power View report only displays clients containing a “u” followed by an “e.”

Figure 3-16. Applying an advanced wildcard filter
The wildcard variations that you can apply are described in Table 3-2.
Table 3-2. Wildcard Filter Options
|
Wildcard Character |
Description |
Comments |
|---|---|---|
|
* |
Asterisk |
Searches for zero or more characters in the data |
|
? |
Question mark |
Searches for a single character in the data |
Note that using the question mark wildcard character will force Power View to find at least one character. Also, using wildcards in advanced filtering is not case sensitive.
Setting an advanced filter for a numeric value is, if anything, easier than when instantiating a filter for a text-based value—and it is very similar. Here is the process to filter Gross Margin so that only sales for makes of car with a gross margin value above £50,000 are displayed in the report.
- Create a new Power View report (this way we know that no other filters are active).
- Create a table based on the ClientName and SalePrice fields.
- Drag the field GrossMargin to the Filters Area.
- Click on the Advanced Filter Mode icon to the right of the filter header. The body of the filter switches to show the Advanced Filter boxes, and the text under the filter title now reads: Show Items For Which The Value. The filter option is Greater Than Or Equal To. Do not change this as it suits our requirements as is.
- Click inside the box under the filter option text and enter the figure 50000. Do not add formatting elements to this figure.
- Click Apply Filter (or press the Enter [Return] key).
The report, including the Filters Area, looks like the one in Figure 3-17. The filter title now says Gross Margin Is Greater Than Or Equal To 50,000.00. As you can see, the filter title adopts the formatting used in the source data.

Figure 3-17. Using numeric filters
When you have added a numeric filter, you can increase and decrease the value by clicking on the tiny up and down triangles that appear to the right of the value box. This saves you from having to reenter figures. It will, however, only change by single increments.
If you are filtering on a Date or DateTime field, then you will quickly notice that Power View adds a couple of popup elements to the advanced filter to help you select dates and times more easily. These additions are
- A calendar popup, which lets you click on a day of the month (and scroll through the months of the year, forward and backward)
- A time series popup, which lets you select times preset to every five minutes throughout the day
The calendar popup is shown in Figure 3-18.

Figure 3-18. The calendar popup
There are a couple of tricks that may save you time when you are selecting dates from the calendar popup (you may be used to these techniques already in other desktop packages, so forgive me if I add them anyway in the interests of completeness):
- When using the calendar popup, clicking on the right-facing triangle to the right of the month and year will display the following month.
- When using the calendar popup, clicking on the left-facing triangle to the left of the month and year will display the previous month.
- When using the calendar popup, clicking on the month and year will display a Year popup, in which you can click on the right-facing triangle to the right of the year to display the following year, and then you can select the month from those displayed.
- When using the calendar popup, clicking on the month and year will display a Year popup, in which you can click on the left-facing triangle to the left of the year to display the previous year, and then you can select the month from those displayed.
- When using the time popup, clicking inside any constituent part of the time (hour, minute, or second) and then clicking on the up and down scroll triangles to the right of the time field allows you to scroll rapidly through the available options.
- Clicking on the clock icon to the right of the time box lets you scroll through the time of the day in five-minute intervals.
If you do not want to select a date using the calendar popup, then you can enter a date directly in the date box of the advanced filter for a Date (or DateTime) field. Just remember that you must enter the date in the date format corresponding to the environment that you are using. That is to say, it must be formatted exactly as a Date field appears in a Date column in any Power View table.
![]() Note If you enter a date where the format does not correspond to the system format, or if the date is purely and simply invalid (the 30th of February, for instance), then Power View will not let you apply the filter. In this case the Apply Filter link will remain grayed out, and pressing the Enter (Return) key will not apply the filter. To correct this, merely select a correct date using the calendar popup. Similarly, if you enter a nonexistent time, the Power View will refuse to accept it and will revert to the previous (acceptable) time that was chosen.
Note If you enter a date where the format does not correspond to the system format, or if the date is purely and simply invalid (the 30th of February, for instance), then Power View will not let you apply the filter. In this case the Apply Filter link will remain grayed out, and pressing the Enter (Return) key will not apply the filter. To correct this, merely select a correct date using the calendar popup. Similarly, if you enter a nonexistent time, the Power View will refuse to accept it and will revert to the previous (acceptable) time that was chosen.
All the examples I’ve given so far in this chapter have used a single filter criterion for each filter that was applied, even if multiple filters were used. You can, however, add a second criterion to a single filter (using the Advanced Filter mode) if you want to extend or limit the effect of the filter. Each filter that you apply can contain two possible criteria at most. This is how it can be done:
- Add an advanced filter as described in steps 1–4 of the “Applying an Advanced Filter” section earlier. Enter only an A in the upper filter text box. Do not apply the filter.
- Click And under the filter text box.
- Select Does Not Contain from the lower filter type popup.
- Enter O in the lower filter text box.
- Click Apply Filter, or press the Enter (Return) key, and all objects in the Power View report will display data only where the Client’s name contains an “A” but not an “O.”
This filter should look like the one given in Figure 3-19.

Figure 3-19. A complex filter
In this past example, you selected an And filter. In fact, as you can see from the Power View screen, you have two choices of complex filter. They are explained in Table 3-3.
Table 3-3. Complex Filter Options
|
Filter Type |
Comments |
|---|---|
|
And |
Applies both filter elements to reduce the amount of data allowed through the filter |
|
Or |
Applies either of the filter elements separately to increase the amount of data allowed through the filter |
When filtering on the text contained in a data field, you can applied the string you are filtering on to the underlying data in several ways. These are the same for both the upper and lower of the two advanced filter options for a text field. They are described in Table 3-4.
Table 3-4. Advanced Text Filter Options
|
Filter Option |
Description |
|---|---|
|
Contains |
The selected field contains the search text anywhere in the field data. |
|
Does Not Contain |
The selected field does not contain the search text anywhere in the field data. |
|
Starts With |
The selected field begins with the search text, followed by any data. |
|
Does Not Start With |
The selected field does not begin with the search text, followed by any data. |
|
Is |
The selected field matches the search text exactly. |
|
Is Not |
The selected field does not match the search text exactly. |
|
Is Blank |
The selected field is blank. |
|
Is Not Blank |
The selected field is not blank. |
Advanced Numeric Filter Options
Numbers cannot be filtered in exactly the same ways as text. Consequently, the advanced filtering options are slightly different from those you use when filtering text. They are described in Table 3-5.
Table 3-5. Advanced Numeric Filter Options
|
Filter Option |
Description |
|---|---|
|
Is Less Than |
The selected field is less than the number you are searching for. |
|
Is Less Than Or Equal To |
The selected field is less than or equal to the number you are searching for. |
|
Is Greater Than |
The selected field is greater than the number you are searching for. |
|
Is Greater Than Or Equal To |
The selected field is greater than or equal to the number you are searching for. |
|
Is |
The selected field matches exactly the number you are searching for. |
|
Is Not |
The selected field does not exactly match the number you are searching for. |
|
Is Blank |
The selected field is blank. |
|
Is Not Blank |
The selected field is not blank. |
When applying a numeric filter you must—not altogether surprisingly—enter a numeric value. If you enter text by mistake, you will get the following message:
- The value is not valid. Enter a valid number between -Infinity and Infinity.
In this case you will have to delete the characters that you entered and enter a numeric value in the place of the erroneous text. You can, if you really want, format numbers (by adding a thousands separator, for instance), but Power View will remove all number formatting.
Dates also cannot be filtered in exactly the same ways as text or numbers. Consequently, the advanced filtering options for date filters are slightly different from those used when filtering other data types. They are described in Table 3-6.
Table 3-6. Advanced Date Filter Options
|
Filter Option |
Description |
|---|---|
|
Is |
The selected field contains the date that you are searching for. |
|
Is Not |
The selected field does not contain the date that you are searching for. |
|
Is After |
The selected field contains dates after the date that you entered, that is, later dates that do not include the date you entered. |
|
Is On Or After |
The selected field contains dates beginning with the date that you entered or later. |
|
Is Before |
The selected field contains dates before the date that you entered, that is, earlier dates, not including the date you entered. |
|
Is On Or Before |
The selected field contains dates on or before the date that you entered, that is, earlier dates, up to and including the date you entered. |
|
Is Blank |
The selected field is blank. |
|
Is Not Blank |
The selected field is not blank. |
Visualization-Level Filters
So far in this chapter we have looked at View filters, that is, filters that will be applied to the entire view and every visualization it contains. Although filtering the source data at a global level will certainly ensure coherence among the tables, charts, and other visualizations that you are using, there will inevitably be times when you want to filter a specific visualization at a finer level. This is where visualization-level filters come in.
Fortunately, visualization-level filters are virtually identical to view filters. The essential thing to remember is that you must select (or click inside) a visualization to apply a visualization-level filter. You will see when this option is available, as the word Table or Chart will appear at the top right of the Filters Area to the immediate right of the word View.
As with nearly everything in Power View, this is probably best experienced in practice, so, to apply a visualization-level filter
- Return to an existing Power View report.
- Display the Filters Area (unless it is already visible).
- Click on an existing visualization. In this example, I will be using the initial table created in this chapter, which you can see in Figure 3-3.
- Click on the word Table, which has appeared at the top right of the Filters Area to the immediate right of the word View in the View area. You will see that all the fields that are used by the selected table appear in the View area.
- Expand any filter fields that you wish to use, or add any further fields from the Power View Field List, and apply any filters that you require, as described previously in this chapter. I suggest selecting a couple of the colors for this example. This is shown in Figure 3-20.

Figure 3-20. A visualisation-level filter
You will notice right away that the filter(s) that you have applied only affect the selected visualization (the table in this example). When you create more complex reports that contain several visualizations, you will see that no other visualizations in the report have their underlying data modified in any way.
You can clear any filter at the visualization level just as you can at the view level—by clicking the Clear icon at the top right of the filter name. You can also delete any filter that you have added to the Filters Area for a visualization (but not those that are based on the fields used by the visualization) by clicking the Delete icon at the top right of the filter name. Adding and removing fields from a visualization will automatically add and remove the corresponding filters from the Filters Area for the visualization. This will include any filters that you added manually before you add them to the list of fields used by the visualization.
As I mentioned previously, a hierarchy of filters is applied in Power View:
- First, at the data level, any selections or choices you apply to the underlying data will restrict the data set that Power View can use to visualize your information.
- Second, at the report or view level, any view-level filters that you apply will affect all visualizations in the view, using the (possibly limited) available source data.
- Finally, for each visualization, any visualization-level filters that you apply will further limit the data that is allowed through the view-level filter—but only for the specific visualization.
As a quick example of this you could
- Apply a country filter to the view (which means you would either deselect any selected visualization, or, alternatively, click on the word View at the top of the view area).
- Drag the CountryName field into the Filters Area and select all countries except the UK. You will see that all current visualizations are updated to reflect the new filter.
- Click on the table for which you added a table filter earlier. Click on the Table indicator at the top of the Filters Area.
- Now expand the CountryName filter in the Filters Area. You will see that the UK is not available to filter on, as shown in Figure 3-21.

Figure 3-21. The filter hierarchy
It is worth noting the following points:
- You have no way to apply a selection to a visualization filter if it has been filtered out at view level. Clicking (All) will only select from the subset of previously filtered elements.
- If you apply a filter at visualization level and then reapply the same filter at view level, but with different elements selected, you will still be excluding all non-selected elements from the filter at visualization level. I stress this because Power View will remember the previously selected elements at visualization level, and leave them visible even if they cannot be used in a filter, because they have already been excluded from the visualization-level filter by being ruled out at view level. This, in my opinion, adds a certain visual confusion, even if the hierarchical selection logic is applied.
Hopefully this shows you that Power View is rigorous in applying its hierarchy of filters. Should you need to apply a filter at visualization level when the filter choice is excluded at view level, you have no choice but to remove the filter at view level and then reapply visualization-level filters to all necessary visualizations to apply the view filter individually to each visualization.
Power View makes it incredibly easy to filter data, and to exclude any and all data that you feel is not helpful in your data analysis. However, like many powerful tools, this ability to apply filters so quickly and easily can be something of a double-edged sword. So here are a few words of advice and caution when applying filters to your data.
Don’t Filter Too Soon
As an initial point, I would say that a key ground rule is “Don’t filter too soon.” By this, I mean that if you are examining data for trends, anomalies, and insights, you have to be careful not to exclude data that could contain the very insights that can be game-changing.
The problem is, of course, that when you first delve into a haystack of data in search of needles of informational value, you have no idea what you could be looking for. So I can only suggest the following approaches:
- Begin with no filters at all, and see what the data has to say in its most elemental form.
- Apply filters one at a time, and remember to delete a filter before trying out another one.
- Try to think in terms of “layers” of filters. So, once you have defined an initial set of filters, add further filters sequentially.
- Go slowly. The temptation is to reach a discovery in order to shout about it from the rooftops. This can lead to inaccurate analysis.
- Always remove any filters that are not absolutely necessary.
- Be careful when hiding the Filters Area. It is too easy to forget that there are active filters.
- Remember that you can have filters specific to a visualization that cannot be visible in the Filters Area. So always check if any visualization filters are active for each table and chart in a report.
In Chapter 2 we saw how to drill down in a matrix table. In the following chapter, you will see how to drill down into charts. In either case, you need to know that performing a drill-down operation (or indeed a drill-up) will have a subtle effect on the Filters Area.
What happens is that the Filters Area for the visualization will reflect the selected drill-down element. As an example, you could try out the following (I will not give all the details for all the steps as a bit of revision for you):
- Create a matrix based on the following fields, in the following order:
- Colour
- ClientType
- CountryName
- CostPrice
- Remove the totals.
- Set the matrix to be a drill-down table (by rows).
- Drill down to the second level by double-clicking Night Blue and then Dealer.
- Expand the Filters Area (if necessary) and click on Matrix to see the visualization-level filters.
- Expand the Colour and ClientType filters.
The table, and the Filters Area, will look like Figure 3-22.

Figure 3-22. Drill-down and filters
As you can see, the filters indicate the drill-down elements, both by indicating the selected elements and selecting the appropriate check boxes. So drilling down is essentially a filter operation.
If you are presenting a key finding based on a data set, then it can save a lot of embarrassment if you make it clear in every case what the data does, and does not, contain. You could, for instance, be so pleased with the revelatory sales trend that you have discovered that you forget to note an important exclusion in the underlying data. Now, no one is suggesting that you are doing anything other than making a point, but your audience needs to know what has been excluded, and possibly why—just in case it makes a difference. After all, you don’t want a rival using this point to try and invalidate your findings in the middle of a vital meeting, do you?
Annotation techniques are described in Chapter 7 if you need to jump ahead to check this out now.
Conclusion
This chapter has shown you how to apply and fine tune a series of techniques to enable you to select the data that will appear in your Power View reports. The main thing to take away is that you can filter data at two levels: the overall report and each individual visualization.
You have also seen a variety of selection techniques that allow you to subset data. These range from the avowedly simple selection of a few elements to the specification of a more complex spread of dates or values. Finally it is worth remembering that you can filter data using any fields in the underlying dataset, whether the field is displayed in a report or not.