
CHAPTER 4 Dependability Analysis
Learning objectives of this chapter are to understand:
• The technology of fault tree analysis.
• The technology of failure modes, effects, and criticality analysis.
• The technology of hazard and operability analysis.
• The technologies that can be used to determine the faults to which a system is subject.
• The consequences for a system of critical-component failures.
• The requirements for a system related to component failures.
4.1 Anticipating Faults
The concept of anticipated faults was introduced in Section 3.10. Anticipating faults is important because, in almost all circumstances, provided we know that a certain fault is present or might arise, we can do something to at least mitigate the ensuing effects of the fault. Much of the time, we can mask the effects. For example, knowing that a disk might fail leads us to take a variety of measures to deal with such failures. We might back up the disk regularly or incrementally, or we might operate two disks in parallel with identical content in what is referred to as a mirrored-disk configuration. Similarly, knowing that software might fail leads us to try to discover as many of the faults in the software as possible by testing or using some other form of analysis. We will discuss how to cope with faults in a comprehensive, systematic way in later chapters.
The faults that we do not know about, the unanticipated faults, are the ones that tend to cause failures. Not knowing about a fault means that we will not employ any techniques to cope with the effects of the fault, and, of course, those effects could be extensive. Imagine (or perhaps remember) a situation in which you were unaware that a disk could fail, but the disk did fail. Most likely, you lost all your data. Had you known about the possibility of the fault, things would be very different. This point seems rather obvious, but ignoring the point has resulted in a lot of unexpected and sometimes disastrous system failures.
Importantly, this simple observation is one of the keys to making dependability into a systematic engineering activity rather than an ad hoc practice. The reason for this transition is that it forces engineers to seek ways of identifying, i.e., anticipating, the faults to which their systems are subject.
In practice many engineers follow an engineering path that is based entirely on their experience. They know that disks fail, that power fails, that software fails, and so on, and so they make provision for these situations. The ensuing system failures then almost always are from other, previously unidentified faults. This leads to statements after failures of the form: “Oh, I did not think of that.”
Seeking out faults to which a system is subject is a crucial step, and the more successful that step is, the fewer the number of unexpected failures the system will experience. The criticality of this step leads to the following observations:
The identification of faults has to be as comprehensive and systematic as possible. Never rely on personal experience or ad hoc methods alone for the identification of faults.
Given this observation, our next engineering step is to try to identify all the faults that might manifest themselves in a system along with details of their effects. To do so, a variety of analysis techniques have been developed of which we can only cover the most important in this chapter. Specifically, we will discuss Fault Tree Analysis (usually abbreviated FTA), Failure Modes, Effects, and Criticality Analysis (usually abbreviated FMECA), and Hazard and Operability Analysis (usually abbreviated HazOp).
4.2 Generalizing the Notion of Hazard
As discussed in Section 3.11.3, we are going to use the notion of hazard in a broad way. The concept is used most commonly in dealing with safety. Safety makes reference explicitly to serious consequences of failure, and so does “hazard” as defined in Chapter 3. However, using the notion of hazard to refer to any state that we want to avoid is convenient. This is quite satisfactory, because all we are really doing is deciding what will be considered “serious” consequences of failure, and that is subjective.
As an example, consider a system that displays flight information at an airport. This is an important information system, but, if the display fails so that it can no longer provide service, the failure is unlikely to lead to a loss of life or equipment, or cause environmental damage. But to the system’s stakeholders, including the flying public, such a failure is serious, and the owners of the system will want to avoid this.
A convenient way to proceed is to use the notion of a hazard even in this case, and, in fact, to do so universally. We can then exploit the techniques for dependability analysis that arose initially in the field of safety-critical systems to help meet the goals of any system with well-defined dependability requirements. We will examine these techniques in the rest of this chapter.
4.3 Fault Tree Analysis
Fault tree analysis is a technique for determining the events that can lead to a hazard. The technique was developed in 1962 by Bell Laboratories in order to analyze the systems associated with the Minuteman missile program [43].
The name, fault tree analysis, is somewhat misleading. The analysis results in a structure called a fault tree yet, in practice, the structure need not be a tree and the nodes are not faults, they are events. Nevertheless, the term is in common use, and so we will use it. Be careful to keep a proper understanding of the term “fault” when discussing, building, or analyzing fault trees.
Fault tree analysis is a backward search technique. The starting point in performing the analysis is the hazard of interest, and the goal is to determine all of the events that could lead to that state. The events are then used to identify the faults that could cause them in a manner that is as comprehensive as possible. Getting a comprehensive set of faults for a system is extremely difficult, and documenting them in a fault tree is a sophisticated and complex process. We will restrict our discussion of fault tree analysis to an elementary level, because a comprehensive treatment of the topic is beyond the scope of the book.
4.3.1 Basic Concept of a Fault Tree
Informally, a fault tree is a structure that is used to help answer the question:
How can a given hazard arise?
The answer to this question is a collection of events, specifically, the events that would cause the system to enter a hazardous state if they arose.
In well-engineered systems, hazards do not usually arise because of just a single event, even with our extended notion of hazard. In such systems, hazards arise because several events occur, none of which would cause the hazard alone. In fact, many accidents occur because of complex and rare combinations of events where the combination was unexpected, not the specific events. By contrast, in poorly engineered systems, hazards can arise when one event, perhaps one of several, occurs.
4.3.2 Basic and Compound Events
Fault trees help us to document all the events that can lead to a hazard. To do so, we need the notions of basic and compound events. A basic event is something that happens to a system which we can treat as an indivisible action, and a compound event is a logical combination of basic events. The important difference is determined by whether we need to refine an event in order to identify possible events that are associated with faults in subcomponents.
Notice here that the issue is whether we need to refine a specific event. We always can refine an event, because we can always examine the internal design of a system component. Failure of the component itself is sometimes sufficient, but on other occasions we need to examine the component’s design. Once we are convinced that we have sufficient detail to cover all the faults of interest, the events we have identified can be considered basic.
As an example of a basic event, consider a disk drive. In preparing a fault tree for a system that incorporates a disk drive, we will have an event labeled: “Disk drive fails.” If the disk drive is built with proper failure semantics, then the interface that the disk presents on failure will always be the same and will be properly defined. The interface might be that the disk no longer responds to read or write requests and is essentially inert. If this behavior is adequate for our purposes, then the failure of the disk drive can be treated as a basic event.
However, we might be interested in what goes wrong with the disk itself, in which case we need to look at its design. This level of interest is only likely to occur at the device’s manufacturer. Events that might occur in a disk include failure of the drive motor, failure of the head movement mechanism, failure of the head itself, various failures of the drive electronics, and failure of the disk surface. If we need to deal with faults that might lead to these events, then clearly we need to analyze the design of the disk drive, and the event “Disk drive fails” cannot be treated as basic. Note that for our purposes as computer engineers or software engineers, the internal workings of a disk drive are not relevant to our activities, and so failure of a disk drive is a basic event.
The combinations of basic events to form compound events are documented using logical expressions. These expressions are built in various ways using logical operators, most commonly logical and and logical or. This formalizes statements such as:
• Compound event H will arise if basic event I or basic event J occurs.
• Compound event E will arise if compound event F and basic event G occur.
• The hazard will arise if event C and event D occur.
• The hazard will arise if event A or event B occurs.

FIGURE 4.1 A fault tree fragment for a disk-drive failure.
A simple example fault tree fragment for the disk drive example above is shown in Figure 4.1. The hazard is the state in which the disk has failed, and this state is presented in the node at the top of the tree. Three separate events might cause this hazard: (1) the drive motor fails, (2) the disk read/write head mechanism fails, and (3) the disk surface fails. The fact that any one of these three events could lead to the hazard means that they are combined with a logical or, shown in the diagram using the usual symbol for inclusive or.
For purposes of this example, we assume that two of the three events in the second level in Figure 4.1 are basic and illustrated as circles. We need to elaborate the third node until the leaves of the fault tree are basic events. In the example, one extra level of refinement is shown for the event of the read/write head mechanism failing, and the resulting events are assumed to be basic.
Various standards have been developed for documenting fault trees. Some of these standards use a textual representation, some a graphic notation, and some both. Some place the root of the tree at the top of the structure and some to the side. A common standard is IEC 61025 [65]. In this standard, the logical operators are represented as logic gates, compound events as labeled rectangles, and basic events as labeled circles. Where a fault tree will not fit on a single page (as is usually the case) or where analysis is best served with multiple interconnected trees, triangles are used to indicate the links.
4.3.3 Inspection of Fault Trees
Fault trees provide a compact and elegant representation of important system information. That they are largely informal means that there is no way to establish completeness or correctness properties by analytic means. Inspection is essentially the only alternative.
Inspection of fault trees has to be systematic and thorough. Since fault trees are descriptions of systems, all of the relevant engineering expertise has to be represented in the inspection process. This requirement means that experts in the design of every subsystem must be involved so as to ascertain the details of every event, including the precise form of the event, the associated component failure semantics, the completeness of the failure event descriptions, the probabilities of the various events (if available), and so on.
Although they are informal, inspections of fault trees must be rigorous. Some of the techniques developed for software inspections (see Section 10.2) can be adapted to the inspection of fault trees. For example, checklists can be developed, the inspection process can include the same basic steps as are used in software inspection, such as preparation, inspection, and rework, a reader can be used to guide the systematic elaboration of the structure, and innovations such as Active Reviews can be adopted.
4.3.4 Probabilistic Fault Tree Analysis
Although a fault tree is an essential tool in the determination of the faults to which a system is subject, fault trees as we have discussed them so far have no quantitative role. If the fault tree for a system is developed carefully, there is a good chance that most of the faults to which the system is subject will have been identified. If the fault tree is inspected carefully by knowledgeable inspectors, the chances that the fault determination is complete are increased.
This is a desirable situation, but it leads to two intriguing questions:
• Are some faults more critical than others, and, if so, could the faults to which we should pay attention first be identified?
• Could the probability of occurrence of the hazard be estimated from the fault tree?
Both of these questions require quantitative analysis. The obvious way to answer the first question is to look for the faults most likely to cause the hazard. Faults that might cause events that lead to the hazard with high probability should be examined first.
The answer to the second question is related. If probabilities of occurrence can be determined for basic events, then various forms of quantitative analysis are possible. For basic events that are statistically independent, the most elementary form of quantitative analysis is to add the probabilities of basic events that are inputs to an or gate and to multiply the probabilities of basic events that are inputs to an and gate. This allows the calculation of probabilities for the associated compound events, and this analysis can be continued up the fault tree until a probability estimate for the hazard is obtained. Where dependability requirements are stated quantitatively, e.g., R(ten hours) > 0.999999, then the quantitative goal can be restated in terms of the probabilities of the associated hazards, and the system’s probability of entering those hazards can be estimated from the fault tree.
4.3.5 Software and Fault Trees
Software Failure Events
Events corresponding to failures of software components will appear in fault trees. The failure of a software component is an event that needs to be included in the determination of the faults to which a system is subject. Since the primary purpose of a fault tree is to document the events that can lead to a hazard, inclusion of events relating to software is essential.
Figure 4.3 (page 112) shows the design for the airport information display system example introduced in Section 4.2, and Figure 4.4 (page 114) shows part of the system’s fault tree. In the fault tree, there is a compound event labeled “Data Computer System Fails”. If that compound event were elaborated in detail, software failures in the data computer would be very likely to occur as basic events.
Such nodes point out clearly how significant software failures will be for the system being analyzed. If the hazard can be brought about by a software failure, then this will be clear in the fault tree. With insight about how the system is affected by software failures, specific dependability requirements can be set for software.
Software and Interlocks
Software is one of the most complex if not the most complex component in many crucial systems, and software is a common cause of failure. An approach that can help to protect systems from software failure is to examine the fault tree for each hazard and to make sure that software failure by itself cannot lead to the hazard. The basic structure that this implies is an interlock. An interlock is a design in which an alternate technology is used for a system component that stops the system from transitioning to a hazardous state irrespective of what the software does. The hazard can only occur if both the software and the alternate technology fail. Thus, in the fault tree, the software failure event and the failure of the alternate technology event will be inputs to an and gate in the tree for which the hazard is the root. Since both events are required for the hazard to occur, the probability of the hazard occurring is considerably reduced.
As an example of an interlock, consider the hazard that arises if the door of a microwave oven is opened with the microwave generator operating. A software check for this would be a normal approach, but an electro-mechanical interlock is a common addition. The interlock would consist of a mechanical switch in the door connected in series with the power to the microwave generator. Only if both the interlock and the software failed could the hazard arise. The fault tree fragment corresponding to this element of a hypothetical system is shown in Figure 4.2.
Such structures provide a very effective means for protecting users of systems from software failures. Relying completely upon software is undesirable, because software is so difficult to get right. An interlock is a special case of a design that includes defense in depth (see Section 4.3.7).
Software and Probabilities
Probabilistic analysis is an important but secondary purpose of a fault tree. Even with the most basic form of probabilistic analysis described in Section 4.3.4, the occurrence of software failure events is problematic. The problem arises because software faults are design faults, and there are no simple probabilistic models of software failure. In practice, probabilistic analysis of fault trees for systems that include software typically uses one of three approaches:
Assume the probability of software failure is zero. This approach limits the analysis to the non-software components of the system. The software failure events are documented in the fault tree so that their effects can be examined, but the probabilistic analysis of the system ignores them.
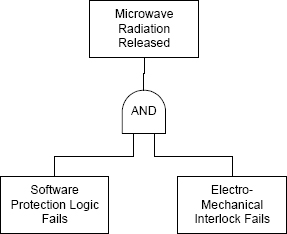
FIGURE 4.2 Fault tree fragment for interlock on microwave oven door.
Assume the probability of software failure is one. This approach is realistic but pessimistic. In practice, almost all real software systems do fail at some point, and so assuming that the probability of software failure is one is entirely reasonable. However, software that is developed carefully and considered suitable for use in systems that have to be dependable will not fail every time that it is used. Thus, making this assumption will provide unrealistically pessimistic probabilities at the system level.
Separate the analysis of the software. Since the quantitative analysis of software failures is so difficult, a reasonable approach is to separate it from analysis of other parts of the system. Quantitative analysis of the platform upon which software will run and the system within which it operates can be conducted quite successfully, and the resulting hazard probabilities stated as conditional upon the proper operation of the software.
4.3.6 An Example Fault Tree
Returning to the airport flight information display example introduced in Section 4.2, a hypothetical architecture for such a system is shown in Figure 4.3. In this architecture, two large displays are used for “Arrival” and “Departure” flight information. These displays are driven by a local, client-display computer. At a central location, two application servers, each formed from four single computers, provide the system’s main functionality, and a database server that is replicated supplies the various items of data. An operator’s console is provided at the central location for operators to control the system, and both the database servers and the application servers are connected to a wide-area network from which the flight data is supplied by the various airlines.
There are various hazards that might arise, but the most obvious one is:
The display is blank.
The display is merely an output device, and the actual data displayed is produced by a sophisticated computer system. We can see how the notion of a fault tree operates by asking how the hazard could arise, i.e., by trying to answer the question:
How could the display go blank?
For convenience, we will refer to the display going blank as hazard1, but note that there are other hazards for which we would have to develop fault trees in practice. The most important additional hazard is the display of erroneous information. We will refer to this hazard as hazard2. Arguably, hazard2 is more important than hazard1, the loss of the display, because at least in the case of hazard1 we will know that the system has failed. With hazard2, subtle errors in the display might easily go unnoticed and lead to a lot of difficulty.
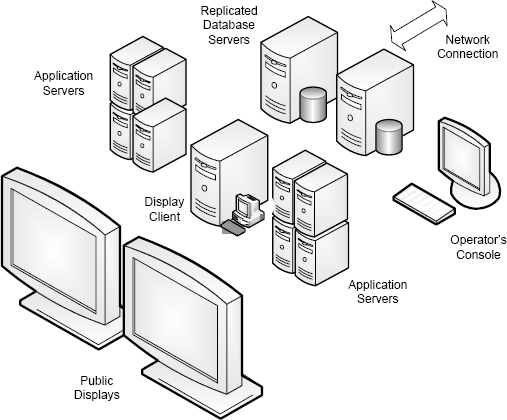
FIGURE 4.3 Hypothetical structure of an airport flight-information display.
| The display device fails. |
| The data computer system fails. |
| The link between the computer system and the display fails. |
| The operators disable the display. |
TABLE 4.1. Events that could cause hazard1.
The answers to the question about hazard1 might include those shown in Table 4.1. We might be wrong, but this list seems to be exhaustive. This conclusion reminds us of another important point about determining the events in a fault tree, namely, that this determination is largely informal. Recall that there is no generally applicable algorithmic technique that can be used to identify the events that can cause a hazard. The process requires insight about a system and experience. Also, although the syntax and types in a fault tree can be checked mechanically, there is no algorithmic approach to verifying the contents of a fault tree either, and so the standard technique is to conduct human inspections.
A partial fault tree for the airport information system is shown in Figure 4.4. Hazard1 is at the root of the tree, and the four events that could cause the hazard are shown as nodes on the level below the root of the tree. Any one of the events could cause the hazard by itself, and so the graph structure shows the associated logical expression with the graphic for an or gate.
The four events we have identified are compound events. We cannot associate any specific fault with any of them, and so we have to refine each by identifying the events that could lead to each of them.
Here, we will only develop the leftmost event in the fault tree, “The Display Device Fails”. The events that could cause this event are shown in Table 4.2 and in the third row of Figure 4.4.
| Physical damage to the display. |
| Power to the display fails. |
| Electronics within the display device fail. |
TABLE 4.2. Events that could cause the compound event “The Display Device Fails”.
To complete the fault tree for this example, we would apply the same process we have just followed to each of these compound events and thereby document the logical structure of these compound events until we have only basic events as leaf nodes. Again, for purposes of illustration, we will look at a single event.
The second compound event, “Power fails to the display” is more complex than it looks. For this example, we assume that there is a supplementary, backup power source. A fairly complete elaboration of this subtree is shown in the lower left of Figure 4.4. In this elaboration, the power to the display might fail if both the primary source of power fails and the backup power source fails. In the fault tree, this is indicated with an and gate.
The size of real fault trees requires that they usually cover several pages of documentation. Even for what seem to be simple systems, the refinement of compound events down to the basic events that we need can be very time consuming and can lead to large subtrees. They have been omitted for convenience in this example.
4.3.7 Defense in Depth
An important notion in dependability engineering is defense in depth. The basic idea is to have more than one barrier between normal operation and the hazardous states. By having more than one barrier, perfect operation of a single barrier is not required. If there are several barriers, hazards will be avoided if at least one barrier holds.
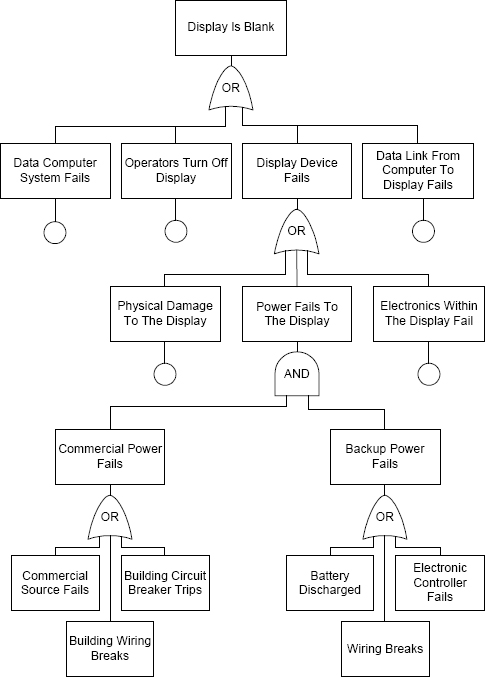
FIGURE 4.4 Fault tree fragment for airport information display.
Each barrier might be imperfect, but their combination is probably more likely to be effective than any single barrier. Defense in depth is the generalization of the concept of an interlock introduced in Section 4.3.5. As we noted with interlocks, defense in depth is important to software engineers, because a system designed using defense in depth can reduce the importance of software in achieving system dependability.
The intuition behind defense in depth is sometimes explained with what is referred to as the swiss cheese system model. The model is shown in Figure 4.5. If each barrier is thought of as being like a slice of swiss cheese with the holes representing faults, then defense in depth is like having a pile of swiss cheese slices. Provided the holes in the cheese slices do not line up, then there is no way to get through the stack of slices.
Intuition is helpful, but we need to have a rigorous understanding of defense in depth if we are going to be able to build real systems using the idea. We gain part of that understanding with a fault tree, as shown in Figure 4.6. The essence of defense in depth is the logic and whose output is connected to the hazard. The hazard cannot arise unless all of the events connected to the input of the logic and occur, where each of the events corresponds to failure of one of the barriers.

FIGURE 4.5 Swiss cheese model of defense in depth.
The swiss-cheese model is helpful, but the underlying approach of defense in depth is more complicated than it looks. The model and the associated fault tree fragment are only valid if two critical conditions hold:
• The faults in the barriers are not correlated. Clearly, a system could be built in which several barriers were present but one or more faults were common.
• The failure of a barrier does not cause a failure of or functional change to one or more other barriers. The worst possible situation is that a failure within one barrier somehow disables the others, thereby removing all protection.
4.3.8 Other Applications of Fault Trees
Software Fault Trees
The fault tree concept can be used to explore the logic structure of software. Suppose that we consider a particular output from software to be especially undesirable. Using the microwave-oven door as an example again (Section 4.3.5), even with an interlock the software should not turn on the microwave generator with the door open.
The issue is to answer the question:
Could the software turn on the microwave generator when not required, i.e., could the undesirable output occur?
We can test the software extensively to see whether the output ever arises, but we might discover that the level of assurance we need cannot be obtained with reasonable levels of testing.
An alternative approach suggested by Leveson and Harvey [85] is called Software Fault Tree Analysis. In this technique, the occurrence of the undesired output is treated as a hazard and a fault tree is developed corresponding to the logic of the program. The highest-level compound event would correspond to the condition that caused the output to be generated. That event would then be broken down into its constituent events, until the basic events corresponding to the original statements are reached.

FIGURE 4.6 Fault tree model of defense in depth.
System fault trees and software fault trees are different from each other, and the difference is important. The former is a technique used to analyze system designs so as to elaborate the events and event combinations that could lead to a hazard. Along with several other techniques, fault tree analysis is carried out before a system is built in order to predict whether the system dependability requirements will be met. Software fault tree analysis is a software verification technique that can be applied after software is built to determine the software states that might lead to an undesirable output.
Attack Trees
Attack trees have been proposed by Schneier [125] as a means of analyzing systems to determine how security attacks might be perpetrated. The idea is the same as a fault tree, with a successful attack being the hazard and actions taken by an attacker as the events. Attack trees provide a lot of insight into how an attacker might succeed just as fault trees provide a lot of insight into how a system might fail.
4.4 Failure Modes, Effects, and Criticality Analysis
4.4.1 FMECA Concept
Failure Modes, Effects, and Criticality Analysis (FMECA) is a technique that helps to answer the question:
What are the consequences that would result from the failure of a component within a system?
FMECA is a forward analysis technique, and the name of the technique sums up the approach quite well:
• Determine the failure modes for the various systems components.
• Determine the effects of these component failures on the system as a whole.
• Assess the criticality of the failures in the operating context of the system.
Using FMECA, a lot can be learned about the specific causes and effects of component failures, and insight can be gained about how important the various component failures would be. FMECA can be used as part of designing a system to evaluate the design. Thus, the design can be enhanced if the analysis shows that the effects of a component failure would be unacceptable.
An important by-product of this process is to focus attention on the need for complete and accurate failure semantics for all the components of the system. If a component failure will not cause a lot of harm, no special attention needs to be paid to that component. In particular, if the failure of a component leads to a benign loss of service by a system, then there might be no need to address that possible failure further.
The FMECA process begins with an elaboration of all the components of interest. For each component, all of the failures to which the component is subject are identified. Applying FMECA requires engineers to determine the different ways in which a component might fail. For example, a switch might fail with its contacts shorted together so that the switch is permanently “on”. The switch might also fail with its contacts never touching so that the switch is permanently “off”. Finally, the switch might fail by having its contacts “bounce” in such a way that it rapidly changes from “on” to “off” before settling in a single state.
Once the failures of the components are identified, the failure semantics can be carefully elaborated and then the effects of each failure are determined. These effects begin with the effects on connected components and continue with the effects on components connected to those components, and so on.
The effects of the failure end up being a detailed statement about the state of the system following the failure, and thus they define the erroneous state. The importance of the criticality step of FMECA is to identify the component failures with the most serious effects. This is the point at which a decision can be made about each failure to determine whether additional design effort is required.
FMECA details are usually recorded in tabular form, and different organizations use different forms. The forms typically list the components of interest, the various failure modes (failure semantics) for each component, the effects of the failure locally in terms of the local functionality that is lost, the effects on the complete system, and the criticality of these effects.
FMECA and fault tree analysis are complementary in many senses. Fault tree analysis provides a systematic way to explore the design of a system to ascertain the events that can lead to a hazard. In practice, fault trees are often developed with events tied to failure semantics, but this is somewhat awkward because the basic fault tree structure is not ideal for this representation. Fault trees for a set of hazards might contain the same event more than once since the same event is often involved in multiple hazards. Once a fault tree has been used to identify the hazards that can result from a basic event corresponding to the failure of a component, FMECA applied to the component can be used to reveal all of the details associated with that component.
Several organizations have developed standards for both conducting and documenting the results of FMECA [124, 12, 36, 66, 21, 123], and standardized FMECA is required in a number of application domains such as military weapons systems, spacecraft and launch vehicles, and parts of the automobile industry.
4.5 Hazard and Operability Analysis
4.5.1 The Concept of HazOp
Hazard and Operability Analysis, HazOP, was developed initially by the chemical engineering industry in the 1970s as a means of improving the dependability of chemical processes. HazOp is a powerful technique for seeking out process weaknesses that might lead to failures, and the technique has been applied to processes in other fields of engineering and to entities other than industrial processes. HazOp is immediately applicable to computer systems and even to software systems.
The goal of the technique is to present the developers of a system with a series of safety “what if” questions about the system of the form:
“What if <this event occurred>?”
The questions are constructed algorithmically using an approach that forms questions by combining question components from lists. Some questions end up being meaningless, but this is a small price to pay for the coverage that is possible with an algorithmic mechanism. By presenting system designers with questions of this form, the designers are challenged to think through events in a systematic way that they might not have explored otherwise. Developers would be expected to have taken care of all such circumstances in the system’s design, and so the response to the questions is expected to be something like:
“<This set of steps> would be taken, and the plant would
<react in the following way>.”
If the developers did not take care of the issue raised by the question, then a change in the system design could be effected.
The structure of the questions is a form of perturbation analysis. The “<this event occurred>” part of the question is formed by taking a system parameter and hypothesizing a question. In a chemical reactor, for example, a reactant might have to be maintained at a particular temperature and pressure in order for the reaction to run smoothly. Typical questions of interest for such a system would include:
“What if the temperature in tank A
(a) rose above the maximum allowable value?”
(b) fell below the minimum allowable value?”
(c) rose faster than the maximum allowable rate?”
“What if the pressure in tank B fell below the minimum threshold?”
Any of these events could have serious consequences, and determining the consequences is important. The great advantage of HazOp is that it provides an algorithmic (i.e., systematic and methodical) approach to forming (but obviously not answering) these questions.
The algorithmic approach to forming the questions is based on: (a) a list of system components that is derived from a model of the system of interest and (b) a list of domain-specific words. There is a valid expectation that the coverage of unusual events would be more thorough than if the questions were posed in an ad hoc manner. The quality of the coverage can be increased by careful word selection.
4.5.2 The Basic HazOp Process
The basic HazOp process begins with the development of a flow model of the system of interest. For chemical reactors, the system is the plant and the flow is of all the reactants. The items flowing in the flow model are referred to as entities, and they are typically tied to both the actual flowing substance, the plant location, and perhaps time. For example, in a chemical plant flow model, a substance such as nitric acid might be flowing between tanks A and B according to some sort of schedule. Entities of interest might include “nitric acid flowing out of tank A as the main plant reaction is initiated”.
The what-if questions are derived from two lists of words, the attribute list and the guide words. The attribute list is the list of attributes associated with all the various entities. The guide words are adjectives that describe states of interest associated with the entity attributes. For the nitric acid entity described above, the attributes might be “temperature”, “pressure”, and “flow rate”. The guide words might include “high”, “low”, and “absent”.
The what-if questions are formed by taking each attribute, applying each guide word, and keeping the question if the question makes sense. Thus, there will usually be a lot of questions because of the number of combinations of attributes and guide words. But many of the questions will not make sense and so can be eliminated. Note, however, that this approach gives us reasonable confidence that the important questions have been formed. The combinatorial approach ensures that all combinations appear in the list even if some are meaningless.
4.5.3 HazOp and Computer Systems
HazOp and Software Requirements
Why should the computer engineer and the software engineer be concerned about HazOp analysis for a system such as a chemical plant? The answer lies in the software requirements for the chemical plant’s computer system. The software requirements derive in large measure from the need to react to undesirable situations. If any of these situations arises in practice, the software might be the way in which a hazard is avoided. Not knowing about one of these situations could be very serious, so the requirements must document all of them if possible. The completeness of the software requirements can be aided considerably by a systematic HazOp analysis.
Important aspects of HazOp are (a) that HazOp can be applied to a variety of different entities and (b) HazOp’s application tends to cross disciplines and so multiple forms of engineering expertise will become involved. To practice HazOp successfully requires that the overall management approach be systematic and detailed. Computer and software engineers need to understand that their requirements might come from any of the other disciplines involved, and these engineers might have to interact with engineers using a variety of domain-specific terminologies.
Applying HazOp to Computer Systems
As you might expect, we can apply HazOp to computer systems just as we can to things like chemical plants. For example, consider a computer network. The flow model is the set of network nodes and their interconnections, and the flow is the network traffic. For software, the system is the software itself, and the flow might be data being manipulated during execution. For other types of system, a similar model is usually easy to develop.
For a computer network, the entities would include network packets or messages depending on the level of the flow model. The attribute list might include all aspects of network activity such as load, throughput, queue lengths, delays, and latencies. Guide words might include “high”, “low”, “absent”, and “delayed”.
HazOp has been applied to computer systems with great efficacy. For computer systems, the flow model would be based on information. A great deal has been written about HazOp in a wide variety of circumstances. An important reference that includes a discussion of the application on HazOp to software is System Safety: HAZOP and Software HAZOP, by Redmill et. al [116]. HazOp standards have also been developed [67].
Key points in this chapter:
♦ Anticipated faults are the classes of faults that we expect to occur. Since they are anticipated, we can make provision for them. The faults that we do not anticipate will have effects for which most likely no provision has been made.
♦ Fault tree analysis can help us to the anticipate faults that could lead to each hazard.
♦ Developing fault trees is largely informal, and inspection is the primary technique available to help ensure completeness and accuracy.
♦ Including software in fault trees is problematic.
♦ The substantial effectiveness of defense in depth can be seen and analyzed using a system fault tree.
♦ Failure Modes, Effects, and Criticality Analysis (FMECA) is a technique for assessing the effects of certain types of failures.
♦ Hazard and Operability Analysis (HazOp) is a technique for systematically refining the requirements of a complex system.
Exercises
1. Generally, having the input to the top element of a fault tree come from an and gate is considered desirable. Explain why this is the case.
2. Suppose you have been hired by the Bell Computer Corporation to help deal with the least dependable component of a laptop computer, the hard disk drive. In order to improve the dependability of the disk drive systems used in laptops, the goals are to analyze the current designs to see where the likely causes of failure are and to consider ideas like mirrored and solid-state disk designs. What is the most significant hazard associated with the disk that a laptop faces?
3. For the hazard identified in Exercise 2, draw the top three levels of the associated (hypothetical) fault tree.
4. List the nodes in the fault tree in Exercise 3 that would not be present with a disk-drive replacement based on compact-flash technology.
5. Suppose the current laptop disk in Bell Computer Corporation laptops were replaced with a mirrored disk (two drives operating in parallel with identical data). Using the fault tree from Exercise 3, estimate how effective mirroring the disk would be at increasing the MTTF of the disk system.
6. What is the most significant hazard associated with the pharmacy information system described in Exercise 15 in Chapter 2?
7. For the hazard identified in Exercise 6, draw the top three levels of the associated (hypothetical) fault tree.
8. For the most significant hazard associated with the robotic surgery system described in Exercise 9 in Chapter 3, draw the top three levels of the associated (hypothetical) fault tree.
9. Develop an inspection technique for fault trees that would allow you to have increased confidence that the fault tree was accurate and complete. Carefully consider the engineering disciplines that should be involved, the checklists that might be used, and the inspection process that might be followed.
10. The failures of the Therac 25 might have been prevented if the system were designed to include defense in depth. Examine the details of the Therac 25 system and explain how defense in depth was present in earlier Therac designs but eliminated in the Therac 25.
11. If you were to adapt HazOp for use with software, to which phase of software development might you apply it?
12. If you were to adapt HazOp for use with software, what attributes and guide words would you use?