![]()
Planning Your Azure Deployment
Planning Concepts
Chapters 1 and 2 introduced the different Azure services as well as the business drivers for considering Azure as part of an organization’s IT portfolio. As with most IT initiatives, the main business driver is cost, which includes tangible and intangible costs.
Previous chapters focused primarily on intangible costs, such as service-level agreements (SLAs), agility and scalability, disaster recovery (DR), high availability (HA), and security. These are important concepts, and, in some cases, an organization may have a real number associated with such costs. For example, some organizations develop business continuity plans that include the costs associated with per-hour outages in terms of revenue and opportunity losses.
This chapter focuses on the tangible operational costs associated with Azure services and also introduces tools and approaches you can use to evaluate such costs.
The Online Azure Pricing Calculator
In Chapter 1, you worked through an exercise that showed you how to use the online Azure Pricing Calculator. This section provides a brief refresher, because the Pricing Calculator is an integral part of Azure planning. You can choose to skip this section if you are already comfortable with the online Azure Pricing Calculator.
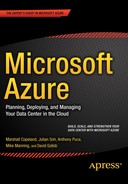
Figure 4-1 shows how to use the slider to determine bandwidth consumption for a web site. The first screen in the figure defines bandwidth utilization, followed by two screens that use the slider to determine the cost associated with various amounts of bandwidth the web site might use.
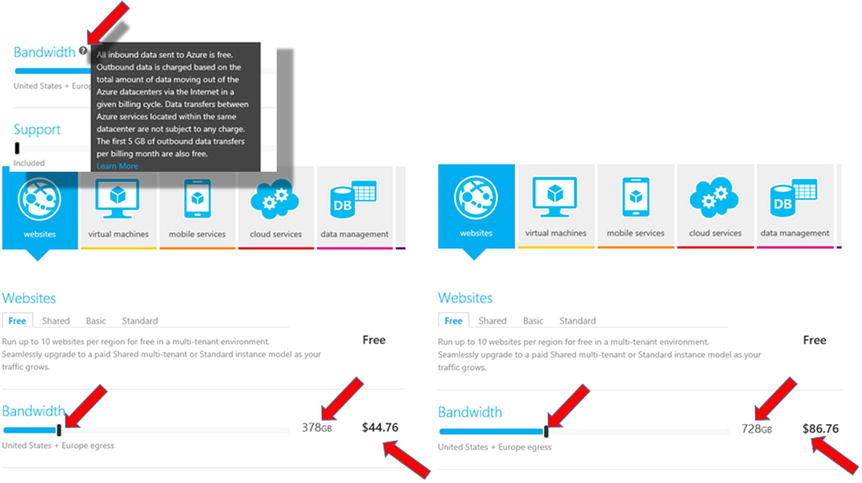
Figure 4-1. Definition of bandwidth, and using the slider to determine the cost associated with the amount of bandwidth used by a web site
![]() Note As a reminder from Chapter 1, it may be easier to click the slider and then use the keyboard’s left and right arrow keys to move it. A mouse may be too sensitive to drag the slider, thus making it more difficult to determine a precise value.
Note As a reminder from Chapter 1, it may be easier to click the slider and then use the keyboard’s left and right arrow keys to move it. A mouse may be too sensitive to drag the slider, thus making it more difficult to determine a precise value.
There are several ways to use the Azure Pricing Calculator. You can obtain pricing for each service or, alternatively, click the full calculator, as shown in Figure 4-2, so that all Azure services are listed and are not broken down by categories. After doing so, you can select all the required Azure services for a project and the quantities you need, and get the total cost by scrolling down to the bottom of the page.

Figure 4-2. The full calculator, and the total shown at the bottom of the page
![]() Note Organizations that have access to a Microsoft Account Team should contact the account executive to assist in cost modeling for Azure. The Microsoft Account Team has other tools available and can develop a more accurate model based on geographical factors and special pricing considerations. The Azure Pricing Calculator is a good starting point for preliminary budget-planning purposes.
Note Organizations that have access to a Microsoft Account Team should contact the account executive to assist in cost modeling for Azure. The Microsoft Account Team has other tools available and can develop a more accurate model based on geographical factors and special pricing considerations. The Azure Pricing Calculator is a good starting point for preliminary budget-planning purposes.
Azure Cost Estimator Tool
The Azure Cost Estimator Tool is an alternative to the online Azure Pricing Calculator; you can download it from www.microsoft.com/en-us/download/details.aspx?id=43376. The primary difference between the online Azure Pricing Calculator and the Azure Cost Estimator Tool is that the latter is a full desktop client and has scenario-based capabilities. Figure 4-3 shows the two options provided by the Azure Cost Estimator Tool.
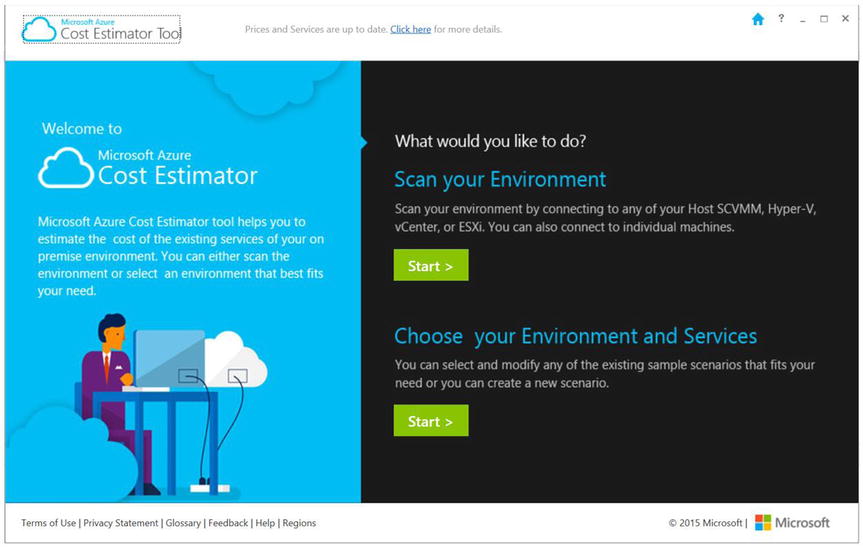
Figure 4-3. Microsoft Azure Cost Estimator Tool’s welcome screen
Scan Your Environment
Clicking the Start button under the Scan Your Environment option launches a wizard that guides you through scanning a physical machine, virtual machine (VM), Hyper-V host server, or vCenter. A report of the scanned machines is then produced.
![]() Note There is no menu or back button in the Azure Cost Estimator Tool. To go back to the previous screen, click the Microsoft Azure Cost Estimator Tool logo in the top-left corner.
Note There is no menu or back button in the Azure Cost Estimator Tool. To go back to the previous screen, click the Microsoft Azure Cost Estimator Tool logo in the top-left corner.
Choose Your Environment and Services
Scenario-based options are an alternative method for using the Azure Cost Estimator Tool. Click the Start button under the Choose Your Environment And Services option to build scenarios. You can create multiple scenarios and add services from the Services tab to a scenario in order to estimate the cost of running that setup in Azure. There are also sample scenarios under the Sample Scenarios tab, as shown in Figure 4-4.
Figure 4-4. Sample scenarios in the Azure Cost Estimator Tool
![]() Note You can find features and release information for the Azure Cost Estimator Tool by clicking the link in the center top of each page within the tool. The tool can and should be updated with the latest Azure pricing information. To do this, go into Choose Your Environment And Services under the My Scenarios tab, create a new scenario, and click the Get Latest Price button.
Note You can find features and release information for the Azure Cost Estimator Tool by clicking the link in the center top of each page within the tool. The tool can and should be updated with the latest Azure pricing information. To do this, go into Choose Your Environment And Services under the My Scenarios tab, create a new scenario, and click the Get Latest Price button.
Geographical Factors Affecting the Cost Model
Microsoft Azure provides services from datacenters located around the world. As such, one of the most important factors to note is that the location from which services are provisioned may affect the cost.
At the time of writing, there are 17 Azure datacenter regions. Each region is served by datacenters within that region. Table 4-1 lists the current regions and their locations. As Azure continues to expand, you can visit http://azure.microsoft.com/en-us/regions/ for updated information.
Table 4-1. Azure Regions and Datacenter Locations as of January 2015
|
Azure Region |
Location | ||
|---|---|---|---|
|
Canada |
Toronto, Quebec City | ||
|
Central US |
Iowa | ||
|
East US |
Virginia | ||
|
East US 2 |
Virginia | ||
|
US Gov Iowa |
Iowa | ||
|
US Gov Virginia |
Virginia | ||
|
North Central US |
Illinois | ||
|
South Central US |
Texas | ||
|
West US |
California | ||
|
North Europe |
Ireland | ||
|
West Europe |
Netherlands | ||
|
East Asia |
Hong Kong | ||
|
Southeast Asia |
Singapore | ||
|
Japan East |
Saitama Prefecture | ||
|
Japan West |
Osaka Prefecture | ||
|
Brazil South |
Sao Paulo State | ||
|
Australia East |
New South Wales | ||
|
Australia Southeast |
Victoria |
It is also important to note that not all Azure services are available in all regions. Furthermore, certain regions are reserved: for example, services in the US Gov regions are reserved for US government entities only; the regions were created in order to address special regulatory compliance issues specific to US government organizations. Additional verification is required for organizations that sign up to use the US Gov regions where Microsoft Azure Government services are being provisioned.
Aside from such restrictions, nothing prevents an organization from provisioning Azure out of any region. Because pricing may be affected based on regions, an organization may not automatically want to choose the closest region and datacenter location. For example, if the majority of an organization’s customers are located in a different region, it may make sense to provision Azure services out of the region that is closest to the customers instead of out of one that is closest to the organization’s corporate headquarters. This should be taken into consideration when planning for DR and HA, or if your organization has a worldwide business model that “follows the sun.”
Microsoft Assessment and Planning (MAP) Toolkit
Microsoft introduced the Microsoft Assessment and Planning (MAP) Toolkit to help customers plan, deploy, and adopt Microsoft technologies. It is designed to be a multi-product toolkit, and Azure was recently added as a MAP Toolkit capability.
The MAP Toolkit for Azure is designed to help organizations plan and migrate to Azure. The latest version of the MAP Toolkit for Azure can be downloaded from https://technet.microsoft.com/en-us/solutionaccelerators/gg581074.aspx.
Installing and Starting MAP
One of the most important capabilities of the MAP Toolkit for Azure is the ability to conduct an in-depth inventory of an organization’s environment. This is carried out through an agentless discovery service that discovers Windows OS platform versions, SQL databases, VMs, and even applications. Data collection and inventory is an important step in any planning process. The MAP Toolkit creates and maintains an inventory database, which is the step of the wizard when the tool is launched, as shown in Figure 4-5.
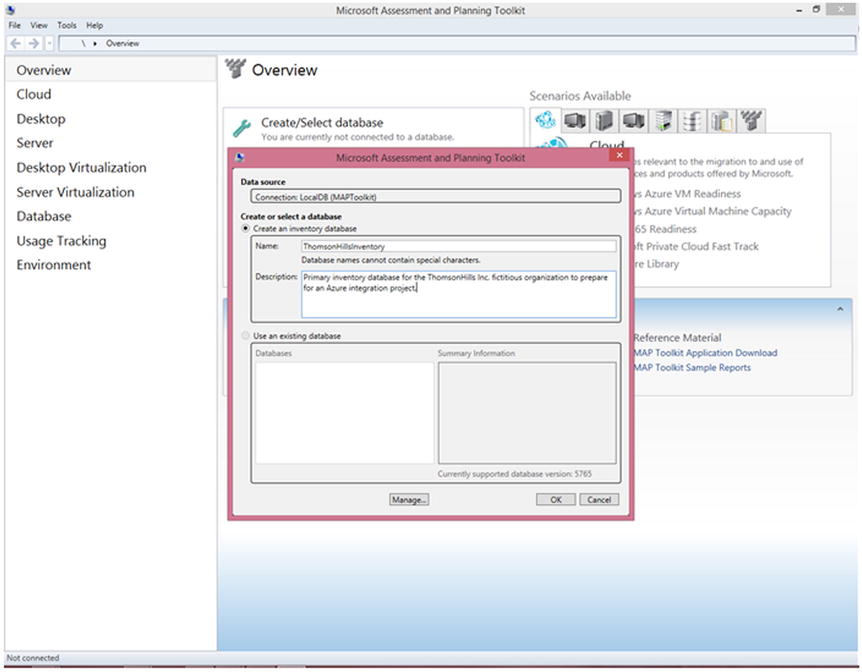
Figure 4-5. MAP Toolkit prompting the user to create a new inventory database or to connect to an existing one
Once the inventory database has been created, the Azure assessment capabilities are located on the Cloud screen, as shown in Figure 4-6. The MAP Toolkit also provides a guided step-by-step process to conduct the assessment.
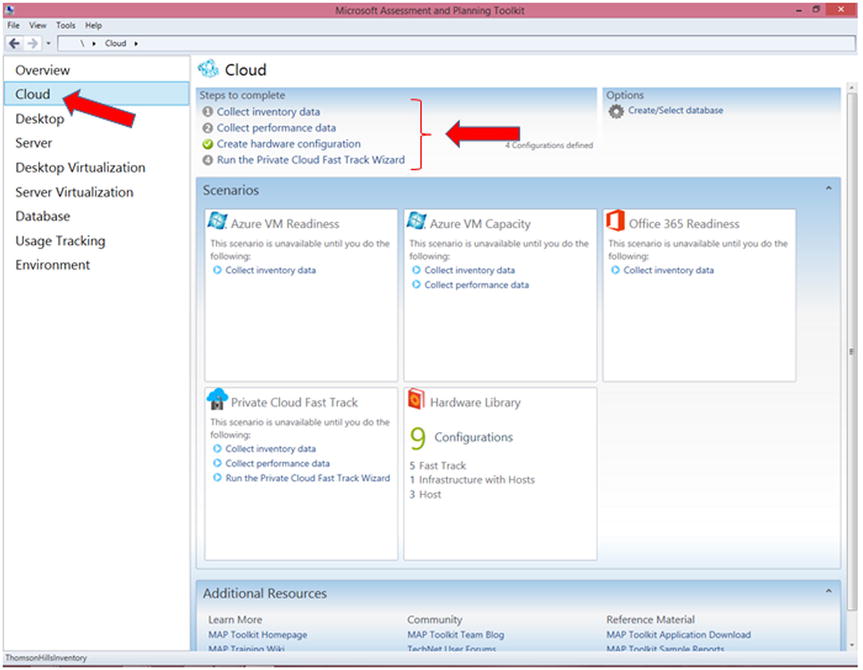
Figure 4-6. MAP Toolkit for Azure and the step-by-step guide
Inventory
With your database set up, follow these steps to inventory your environment.
INVENTORY AND ASSESSMENT WIZARD
Inventorying Your Environment
Start the inventory by launching the Inventory and Assessment Wizard:
- Select Cloud from the MAP Toolkit’s left navigation pane, and click Collect Inventory Data, as shown in Figure 4-6. Doing so launches the Inventory And Assessment Wizard, shown in Figure 4-7.
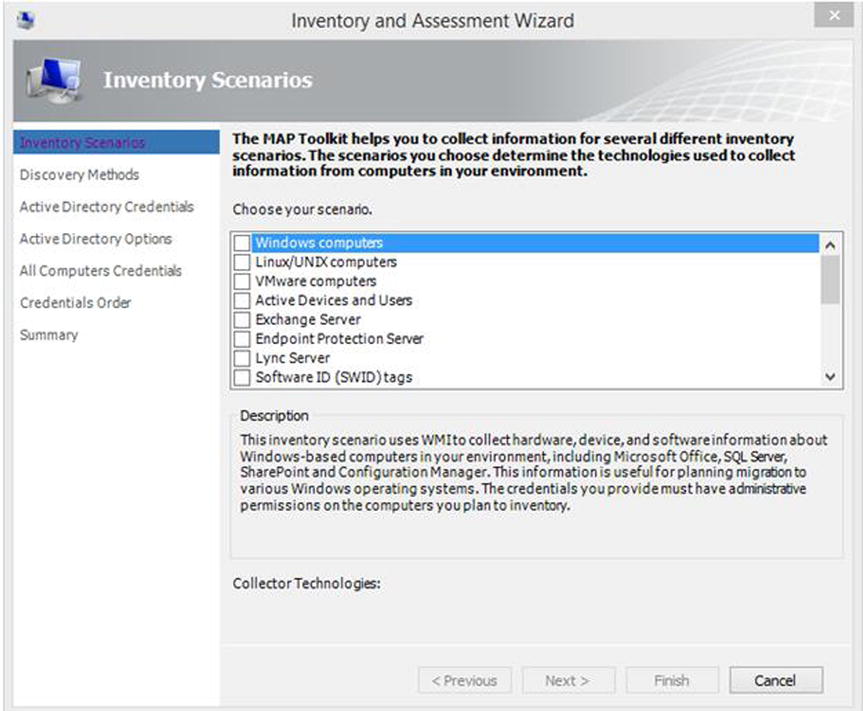
Figure 4-7. Inventory And Assessment Wizard
- Select Inventory Scenarios, and note the description of each scenario. Be sure to select and read the description for the Windows Azure Platform Migration scenario.
- Click Next when all the applicable scenarios have been selected.
- Specify the discovery methods, and click Next.
- Specify your Active Directory credentials, and click Next.
- Specify whether you want to inventory the entire AD or just certain organizational units (OUs), and click Next.
- Click Create, and enter the AD administrator credentials to be used when logging in to computers in the domain, as shown in Figure 4-8. Repeat this step to add other admin credentials if required. Click Next when you’re finished.

Figure 4-8. Enter the administrator credentials to use when logging in to machines
- If you created more than one administrator credential in step 7, you can prioritize the order of credentials that MAP will use to try to log in to machines. Click Next when you’re finished.
- Some methods, like SSH, use ports to connect to a machine. Modify the port if necessary. Click Next.
- On the Summary screen, review the configuration information that the Inventory And Assessment Wizard has collected based on your answers from the previous steps. Click Finish to begin the inventory process.
- As the Inventory And Assessment process is running, click Details to get more information. The inventory process is finished when the status switches from Running to Completed, as shown in Figure 4-9.
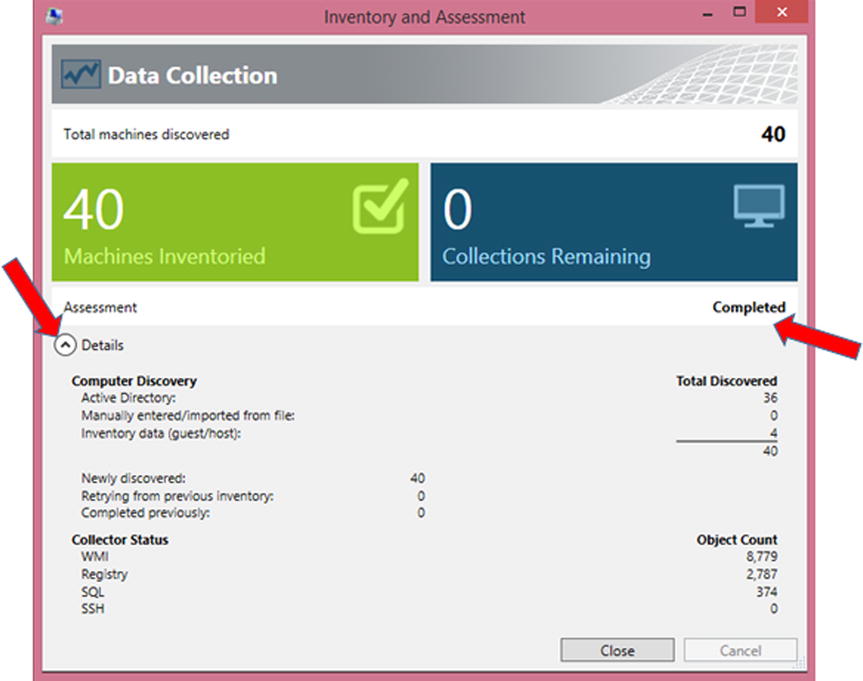
Figure 4-9. The inventory progress report
- Review the information that has been collected, and then click Close.
- On the main page of the MAP Toolkit, note that a scenario that estimates VM capacity is not available until performance data is collected, as shown in Figure 4-10.
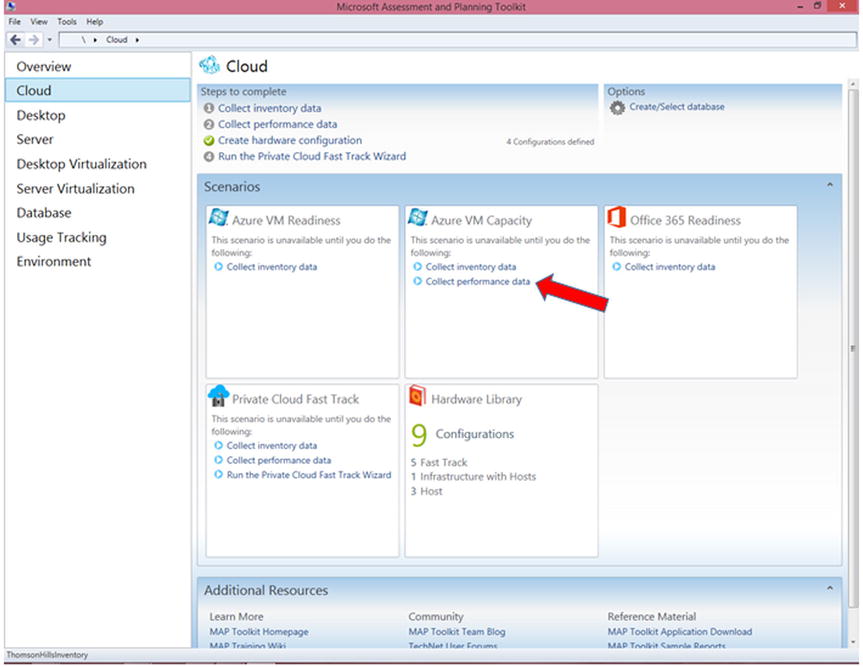
Figure 4-10. Collect performance data to explore VM capacity scenarios
- Under Steps To Complete at the top of the screen, click step 2, Collect Performance Data.
- Follow the prompts in the wizard, select the VMs for which you want to collect performance data, and then start the process. Note that it may take some time for performance data to be collected, especially if you selected a larger timeframe from which to collect that data.
- When MAP is done collecting performance data, as shown in Figure 4-11, click Close.
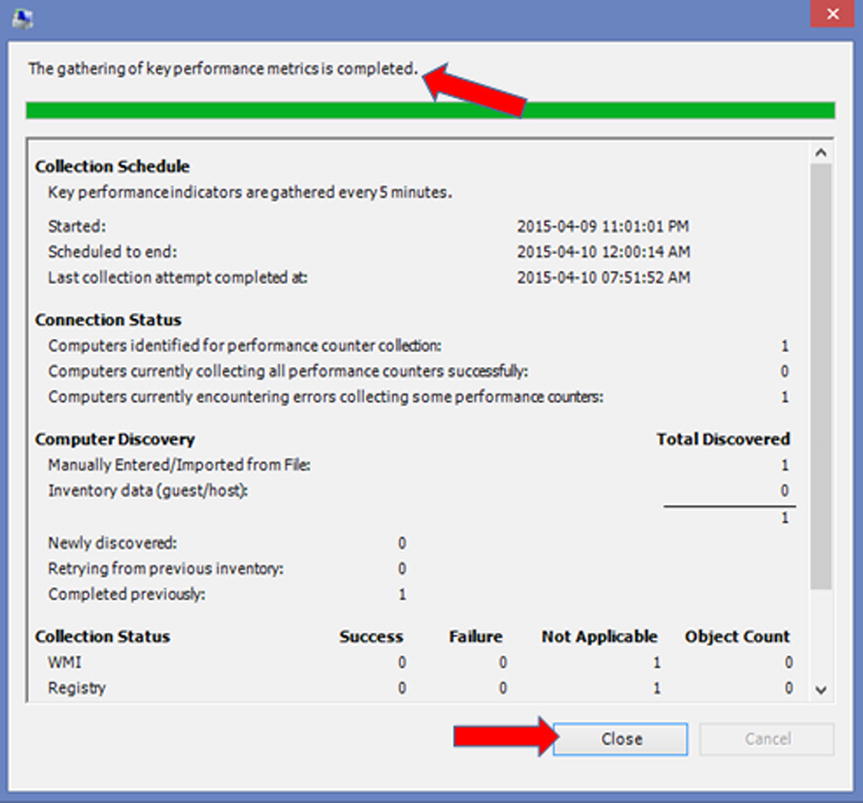
Figure 4-11. MAP has finished gathering performance data
- On the main page of the MAP Toolkit, Azure VM Capacity should now display the number of VMs that have been properly sized, as shown in Figure 4-12.
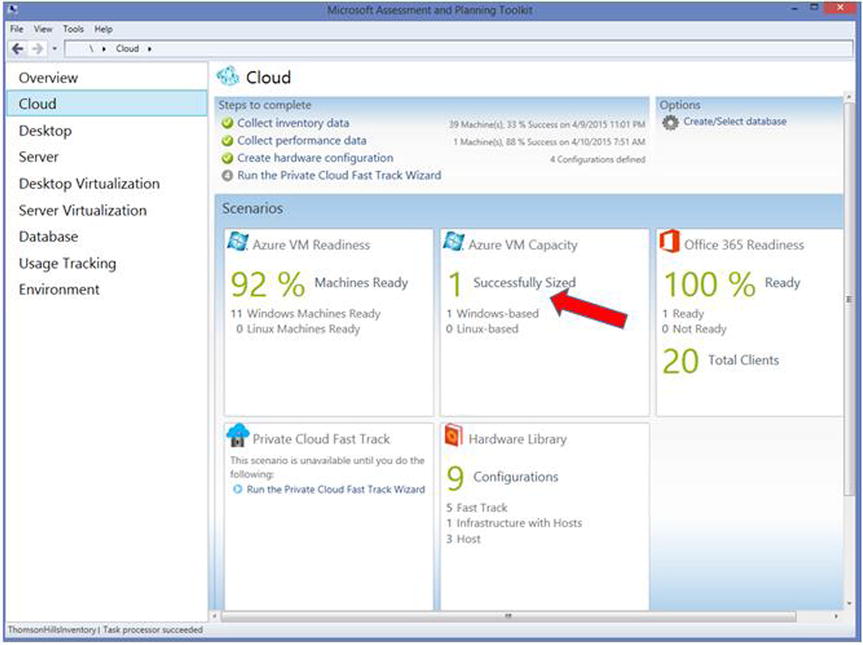
Figure 4-12. Azure VM Capacity tile showing the number of successfully sized VMs
- Click the Azure VM Capacity tile to open the full VM sizing report, as shown in Figure 4-13. The information can also be exported to an Excel workbook.
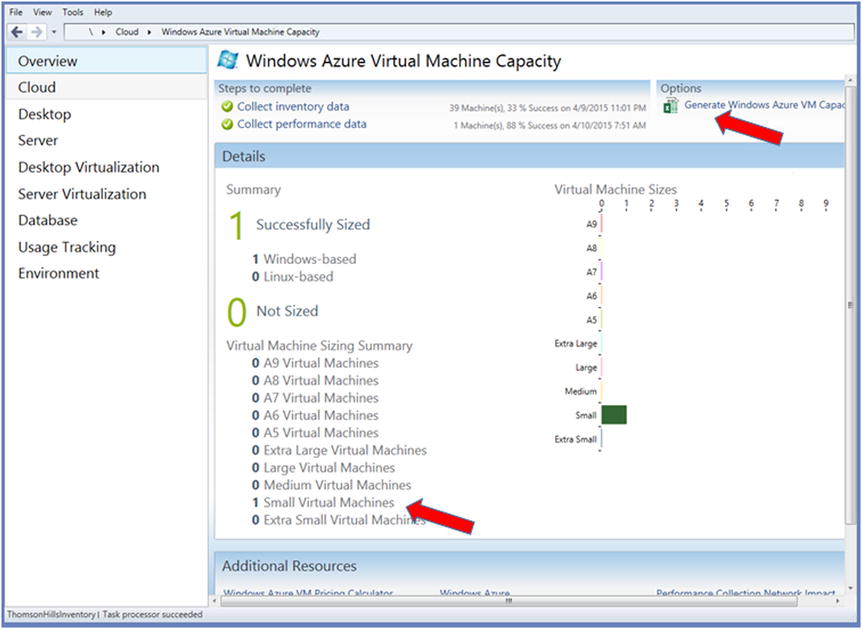
Figure 4-13. Azure VM Capacity report
The MAP Toolkit also provides other types of analysis. You can use the information gathered and interpreted by the MAP Toolkit to estimate the consumption level in Azure and what it will cost.
![]() Note Both the MAP Toolkit and the Azure Online Calculator are provided for analysis and preliminary budgeting purposes. The MAP Toolkit provides information on what types of VMs you will need in Azure. That information should then be fed into the Azure Online Calculator to determine the cost. For the final cost, you should work with a Microsoft Account Representative or a reseller.
Note Both the MAP Toolkit and the Azure Online Calculator are provided for analysis and preliminary budgeting purposes. The MAP Toolkit provides information on what types of VMs you will need in Azure. That information should then be fed into the Azure Online Calculator to determine the cost. For the final cost, you should work with a Microsoft Account Representative or a reseller.
Microsoft Azure Trial
One good approach for a deployment or evaluation plan is to take advantage of a Microsoft Azure trial. A trial provides important insights into the viability of using Azure for specific scenarios.
IMPLEMENTING A MICROSOFT AZURE TRIAL
Recently, a software development company was hired to rewrite a legacy pension-management system. The system required new hardware and software for development, testing, and an eventual move to production. New capabilities would be introduced—for example, the ability for subscribers to access the system and manage their retirement funds through the Internet—but there was no historical data regarding how much traffic the system would generate as a result. In this scenario, the Microsoft Account Team recommended an Azure Trial account to help ensure that the new system could run in Azure and had the capability to scale accordingly.
There are several types of Azure trials, but generally they are free and provide fully functional Azure accounts that are limited only by duration and consumption level. The Azure Enterprise Trial is a one-month trial account with a $200 limit. Any workloads built in this trial account are billed against the $200 credit limit. After the one-month trial, the Microsoft Azure Enterprise Trial account can be converted to a paid production account without having to rebuild the Azure workloads.
Microsoft Azure Enterprise Trial
The easiest way to take Azure on a test drive is to sign up for the Enterprise Trial account at www.microsoft.com/Azure. Click the Try For Free link, as shown in Figure 4-14.

Figure 4-14. Trying Azure for free at www.microsoft.com/azure
![]() Note You can find frequently asked questions (FAQs) regarding the Microsoft Azure Enterprise Trial at http://azure.microsoft.com/en-us/pricing/free-trial-faq/.
Note You can find frequently asked questions (FAQs) regarding the Microsoft Azure Enterprise Trial at http://azure.microsoft.com/en-us/pricing/free-trial-faq/.
Microsoft Azure Government Trial
As mentioned in Chapter 1, several flavors of Azure accounts have unique requirements to meet regulatory and compliance needs. One example is the Microsoft Azure Government account, which is available only to public sector entities in the United States. As such, in order to sign up for a Microsoft Azure Government Trial account, the Microsoft Account Team for the public sector customer must nominate and submit the request. The Microsoft Account Team has the necessary paperwork for the US public sector entity to complete, and the Microsoft representative also submits the paperwork to authorize and provision the Microsoft Azure Government Trial account.
Like the Microsoft Azure Enterprise Trial account, a Microsoft Azure Government Trial account can be migrated to a paid production account without having to rebuild the Azure workloads that were deployed during the trial period. At the time of this writing, a Microsoft Azure Government Trial program provides a 90-day trial account with a $200 credit limit per month.
The credit limit for most trials applies to Azure workloads that are based on consumption, such as VMs and storage. However, some Azure services are not based on consumption, such as Azure Active Directory Premium (AADP). These services are based on Client Access Licenses (CALs) and, as such, cannot use the monetary amount (credit or paid) available in an Azure account. Trials for services such as AADP can be activated in the Azure Portal, as shown in Figure 4-15.
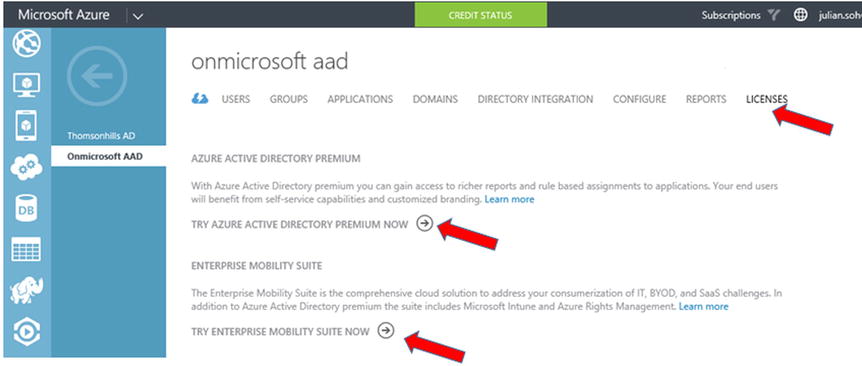
Figure 4-15. Activating the Azure Active Directory Premium and EMS trial
![]() Note AADP can provide single sign-on (SSO) for third-party SaaS apps. Chapter 10 explores this in detail. As part of the planning process, if you need to discover what types of SaaS apps your organization uses, you can use a free Cloud App Discovery tool provided by Microsoft. Visit https://appdiscovery.azure.com to download and learn more about this tool.
Note AADP can provide single sign-on (SSO) for third-party SaaS apps. Chapter 10 explores this in detail. As part of the planning process, if you need to discover what types of SaaS apps your organization uses, you can use a free Cloud App Discovery tool provided by Microsoft. Visit https://appdiscovery.azure.com to download and learn more about this tool.
Microsoft Developer Network (MSDN)
As mentioned in Chapter 1, MSDN subscribers get a $150 per month credit subscription in a Microsoft Azure account. Unlike the other Azure trial accounts, MSDN Azure accounts do not have an expiration date. The $150 credit renews every month for as long as the MSDN subscription is valid. However, the $150 does not roll over from month to month; if any part of the $150 is not used, it is lost, and a new $150 is allotted at the start of the next month.
If the $150 limit is exceeded, workloads in the MSDN Azure account are suspended. MSDN subscribers can choose to remove this restriction and keep a credit card on file to support workloads so they continue to work after the $150 credit is used up.
Planning for Network Performance
Microsoft Azure is the datacenter in the cloud, and the idea is that computing and storage resources will eventually migrate there, so the importance of network reliability, bandwidth, and latency cannot be overstated. As such, planning for Azure—or any cloud provider, for that matter—should include an analysis of the current location’s network performance as compared to Azure datacenters.
Azure Throughput Analyzer
Microsoft Research provides a desktop utility that measures the upload and download throughput achievable from an on-premises client machine to Azure storage.
USING THE AZURE THROUGHPUT ANALYZER
Analyzing Upload and Download Throughput to Azure Storage
Follow these steps to run a test to determine the network throughput level from an on-premises client machine to Azure storage:
- Download the Azure Throughput Analyzer tool at http://research.microsoft.com/en-us/downloads/5c8189b9-53aa-4d6a-a086-013d927e15a7/default.aspx.
- Install the Azure Throughput Analyzer tool, and then launch it.
- Go to the Azure Management Portal at https://manage.windowsazure.com, create a new storage account or access an existing storage account, and then select keys, as shown in Figure 4-16.
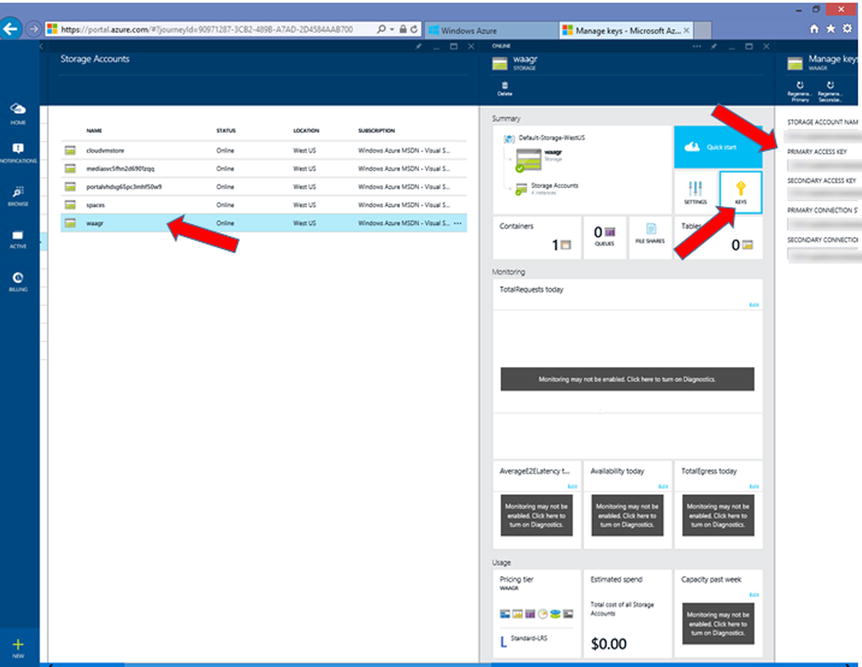
Figure 4-16. Getting the keys for an Azure storage account
- Copy the Primary Access Key to the clipboard.
- Go to the Azure Throughput Analyzer tool, and select Tools
 Storage Settings, as shown in Figure 4-17.
 - Provide a Name to describe the storage settings (we used “Test” in this exercise), and paste the Account Key information and the Account Name from the Azure Portal, also shown in Figure 4-17.
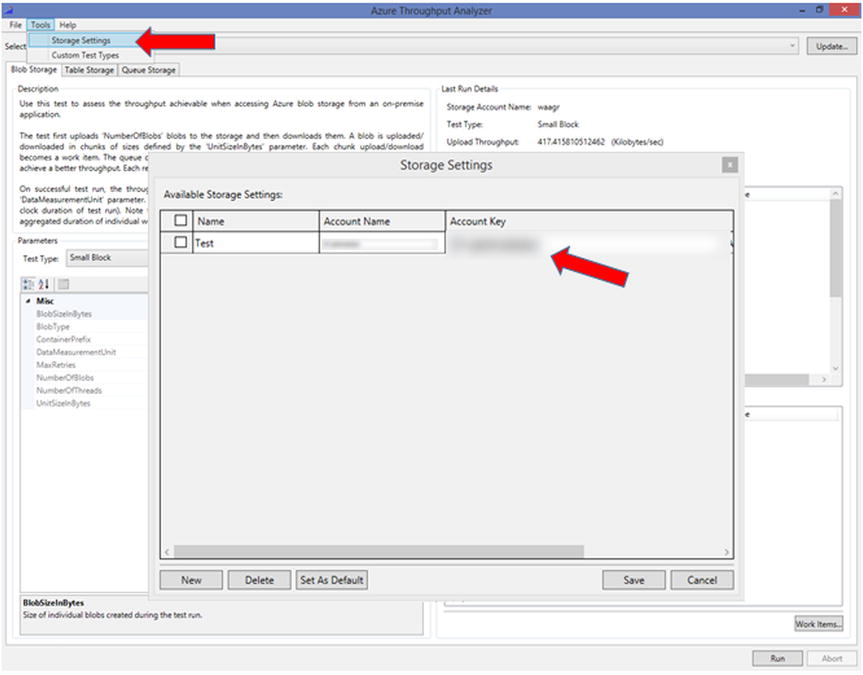
Figure 4-17. Setting the storage settings in the Azure Throughput Analyzer tool
- Click Save.
- Select the storage account setting you just created, and click Run, as shown in Figure 4-18.
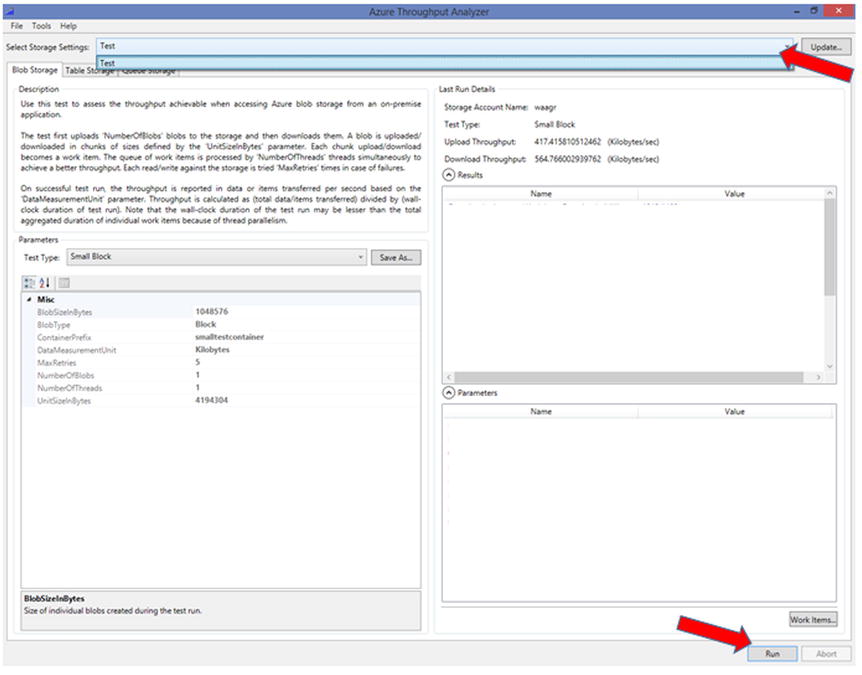
Figure 4-18. Selecting a storage account setting, and running the analysis
- After the analysis is complete, information about data-transfer performance is displayed in the Results pane. The parameters used for the test are displayed in the Parameters pane, as shown in Figure 4-19.
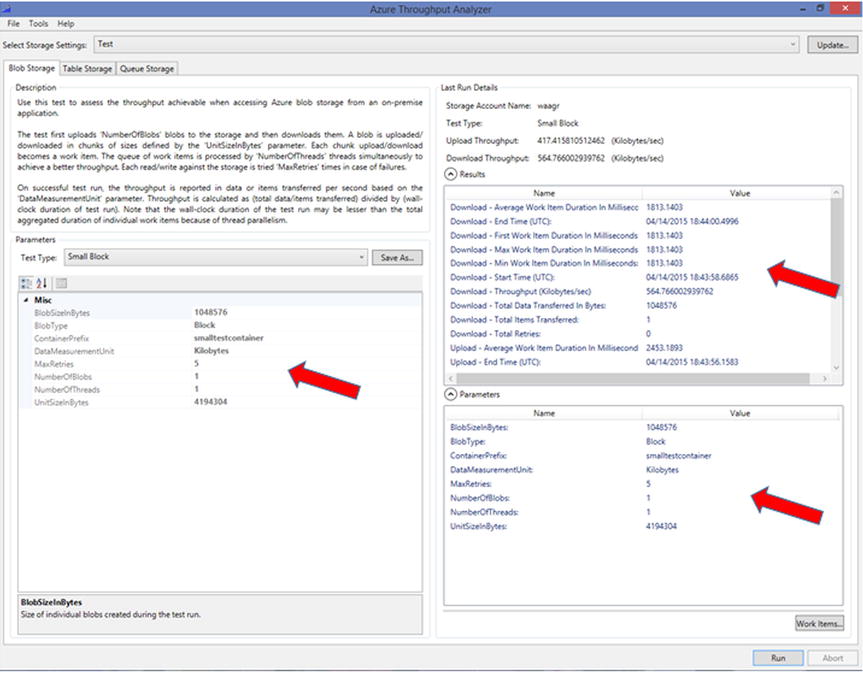
Figure 4-19. Results from the throughput test
The Azure Throughput Analyzer can test additional parameters and different storage types (Blob, tables, and queue storage) and different sizes (small blocks, large blocks, and so on). This free tool should provide you with some insight on the performance of your network with respect to data transfers.
Third-Party, Web-Based Network Latency Test
As an alternative to installing a client-based application like the Azure Throughput Analyzer, you can use an online-hosted network test tool located at www.azurespeed.com. This third-party tool provides similar network-performance information that you can use during the planning process. Figure 4-20 shows the Azure Storage Latency Test screen displaying the network performance of different Azure datacenters from the on-premises client’s browser.
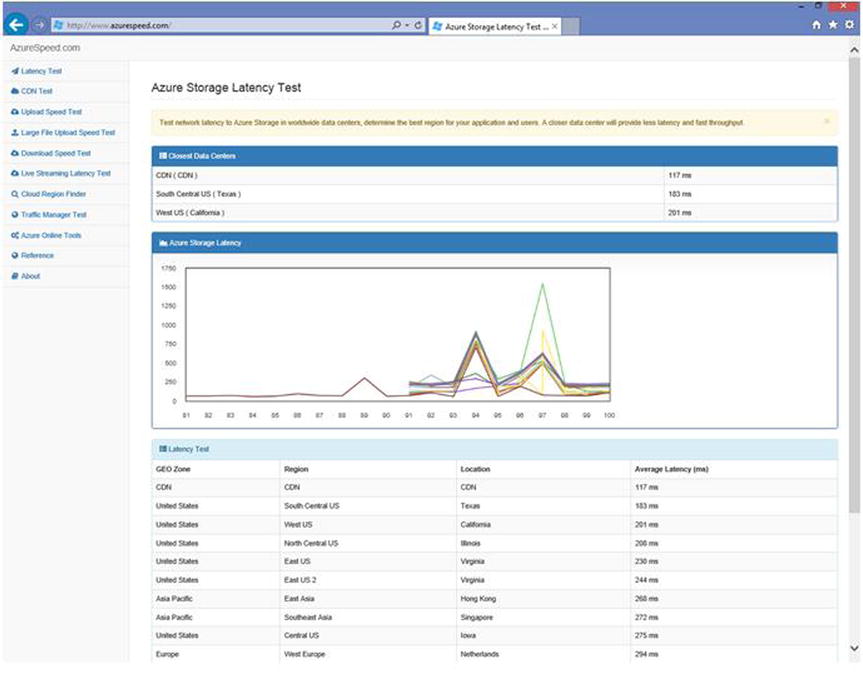
Figure 4-20. Azure Storage Latency Test results from www.azurespeed.com
Like the Azure Throughput Analyzer tool, the Azure Storage Latency Test should be run from different on-premises locations in order to determine each location’s network performance.
Summary
This chapter provided you with some tools to help plan your Azure deployment. With these tools, you can better evaluate Microsoft Azure by discovering the types of SaaS apps your organization is using, determining network performance and VM sizing, and translating that information into Azure workloads. You can use the Online Calculator to determine the cost to run the workloads in Microsoft Azure.
Chapter 4 looks at a few real-world scenarios in which Azure is being used and the business drivers behind each scenario. After that, the next section of this book discusses some key Azure services in detail.