One of the goals of this book is to get you ready to perform real-time IoT imaging quickly, avoiding a lengthy installation process. Being ready quickly doesn’t mean we are going to take any shortcuts, it means we will get the tooling part out of the way so we can focus on the creation process.
In this chapter, you’ll run your first example.
Visual Studio Code Primer
You can’t knock on opportunity’s door and not be ready.
—Bruno Mars
Visual Studio Code, a small but pluggable text editor
The Java Development Kit and its runtime, so we can write Java code and run it
A Java plugin to Visual Studio Code so that the editor understands the Java code and runs it
Basically, that’s all.
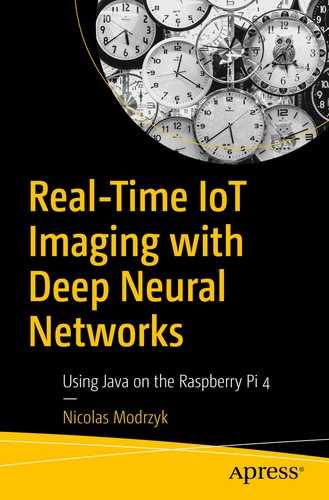
It does not really matter whether you’re using Windows, Mac, or Linux. All the different pieces of XX are made to run anywhere. To install Visual Studio Code, you need to head to https://code.visualstudio.com/.
Choosing your download
At the time of writing, the current version is 1.40, but newer versions would only be better.
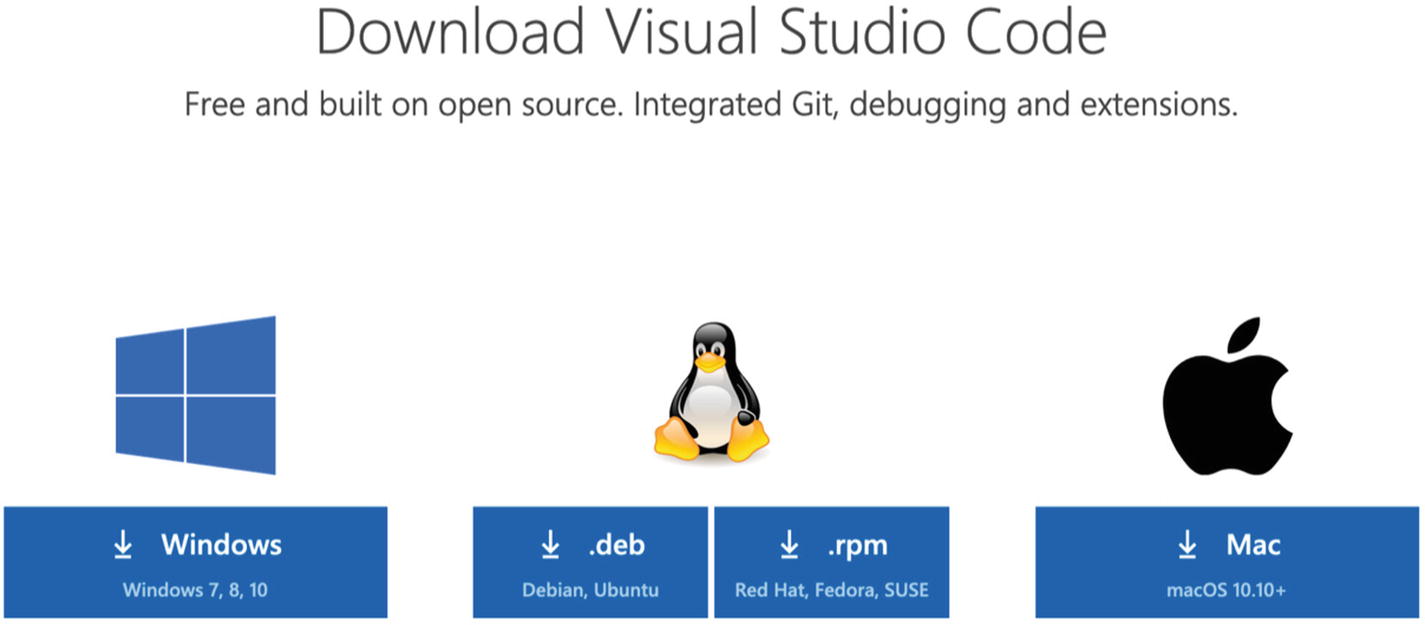
Visual Studio Code
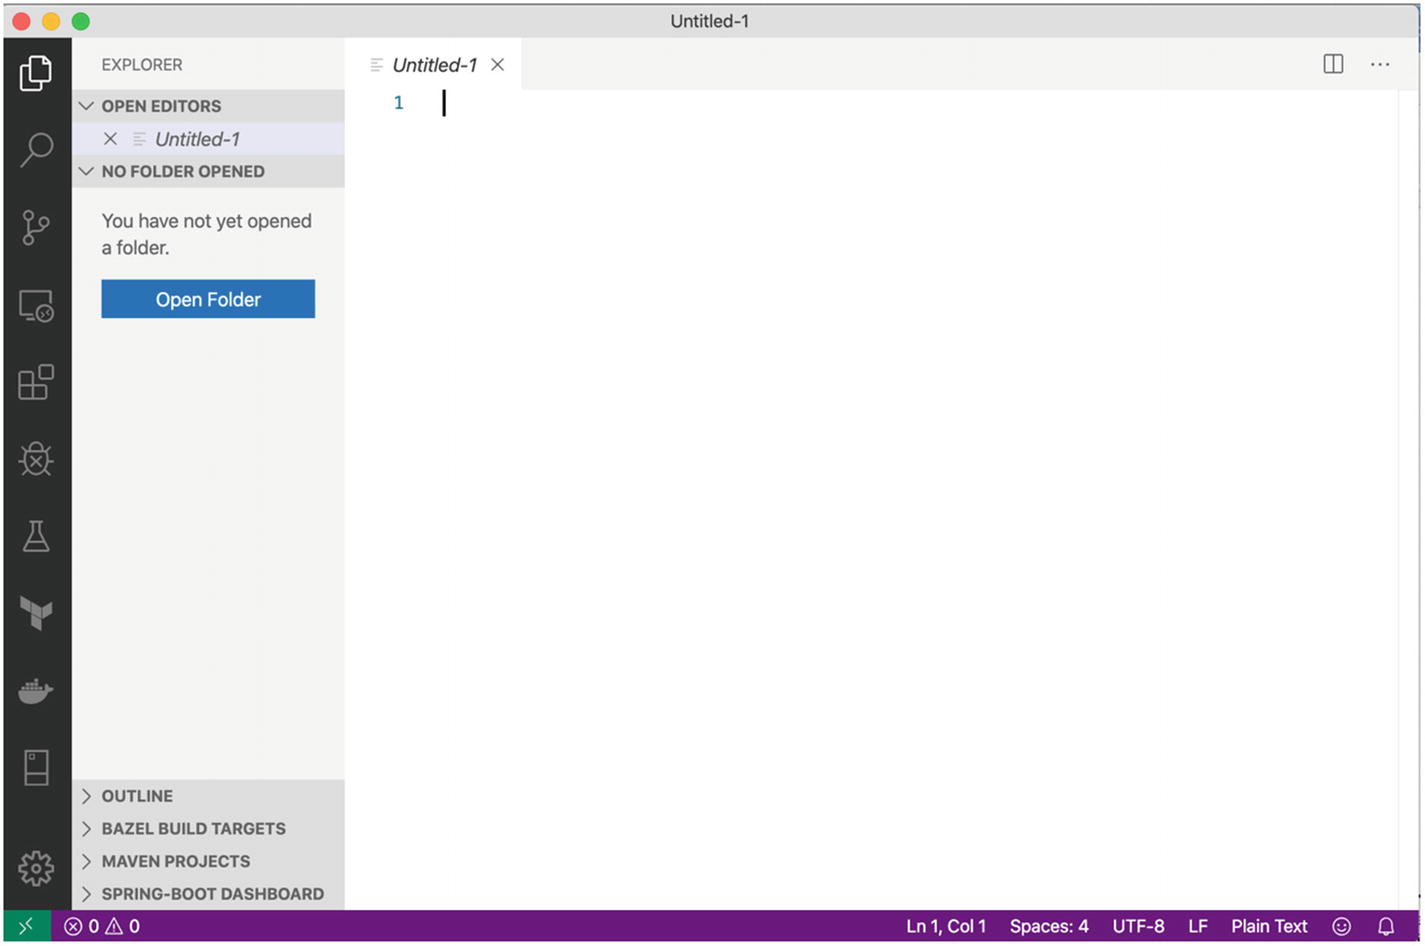
Oracle Java download page
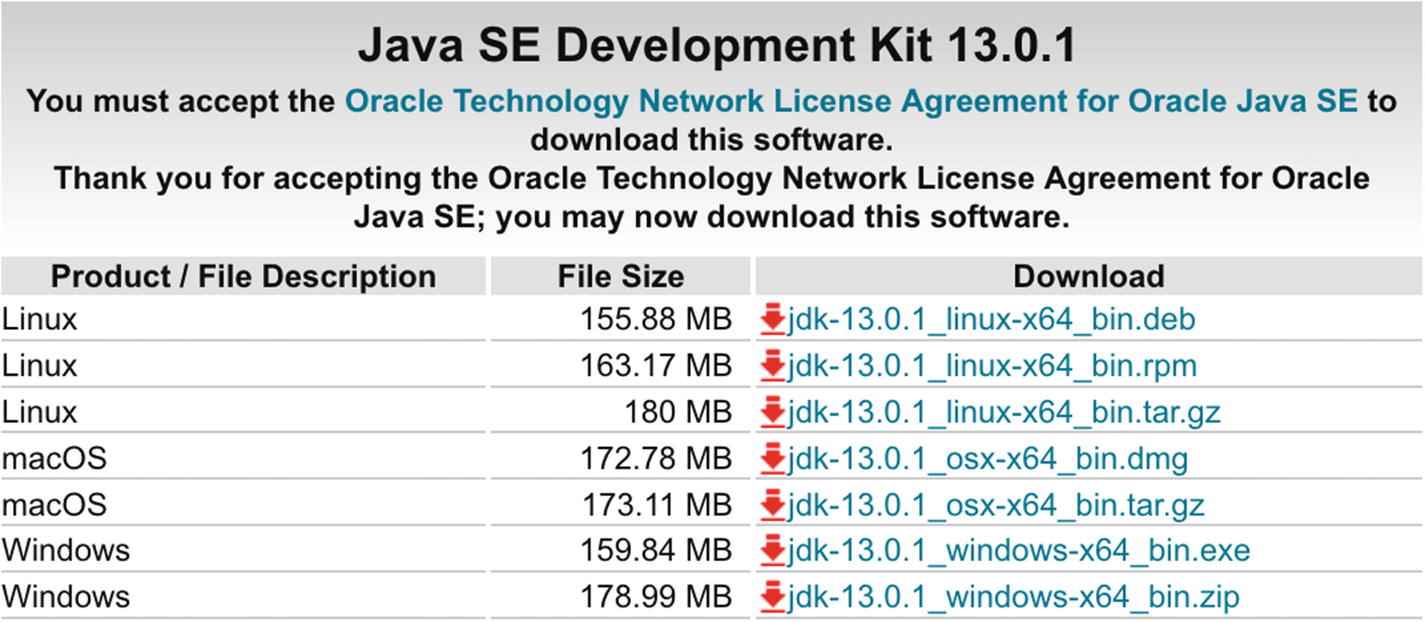
Java download link
Let the installer run to the end, and do not stop it even if it tries to open another installer while running. Java, being a development kit, does not come with a fancy application to check that it has been installed properly, so after the Java installation is finished, a quick way to check that things are in place is to open a terminal in Visual Studio Code and check the Java version.
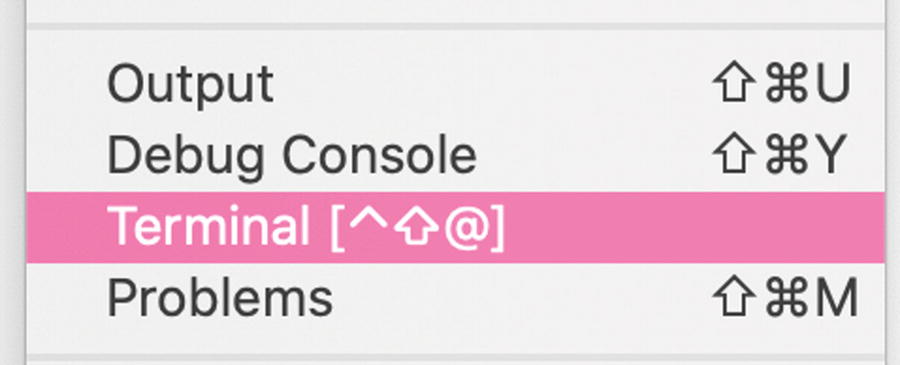
Opening a terminal window from within Visual Studio Code
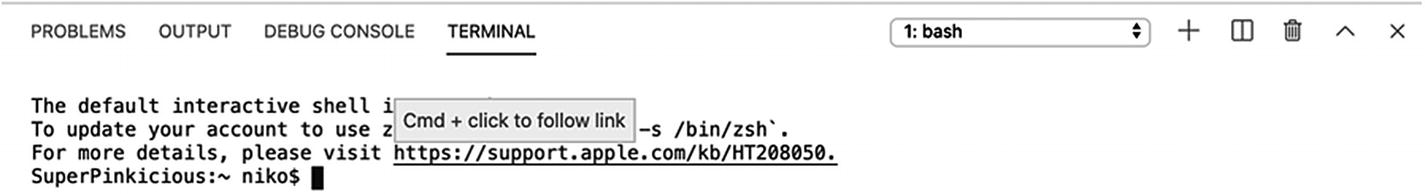
The Terminal tab
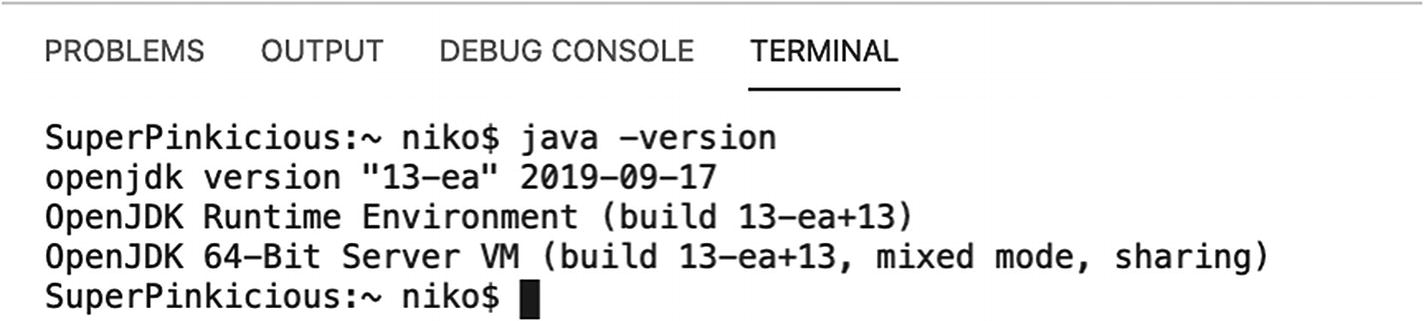
Java version
Note that the Java version itself is not important; any version between 8 and 14 is expected to work. Heck, let’s be optimistic—things should also work for the foreseeable future.
We are almost there with all the setup, so bear with me for a few more seconds. In Visual Studio Code, everything you write will be handled as simple text. Basically, if you do not tell a computer what to do with text, it will not do anything.
Let’s tell Visual Studio Code to understand our Java files by installing the Java plugin.
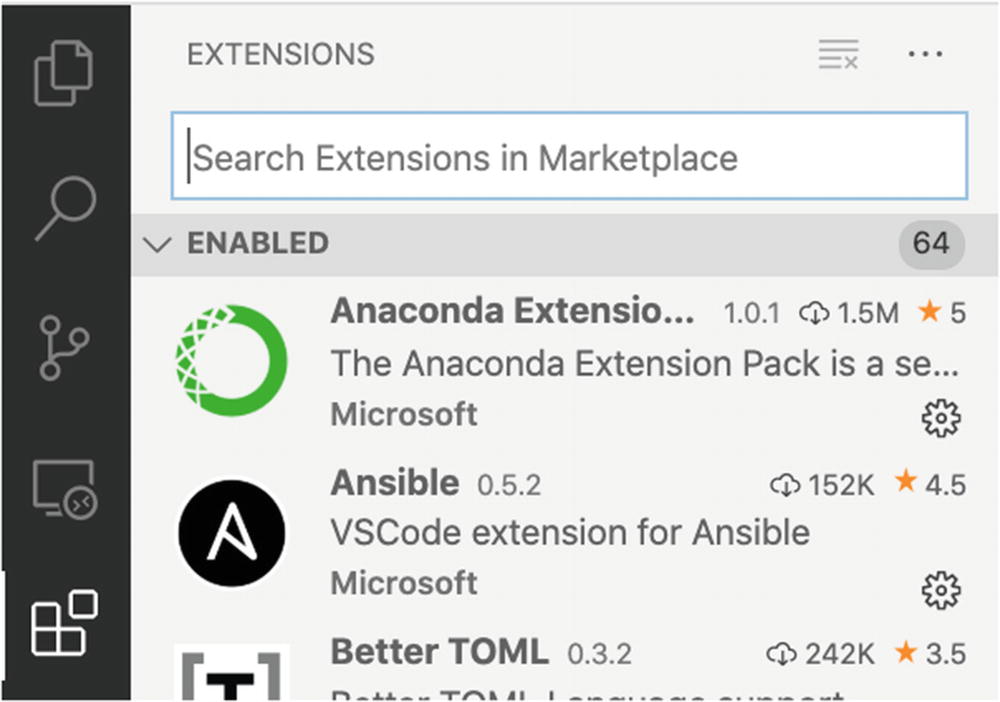
Visual Studio Code Marketplace
From here, you can install plug-ins in the editor to extend it in many different ways. We are going to make heavy use of plugins in this book, and build a setup which you can reuse and enhance for other situations.
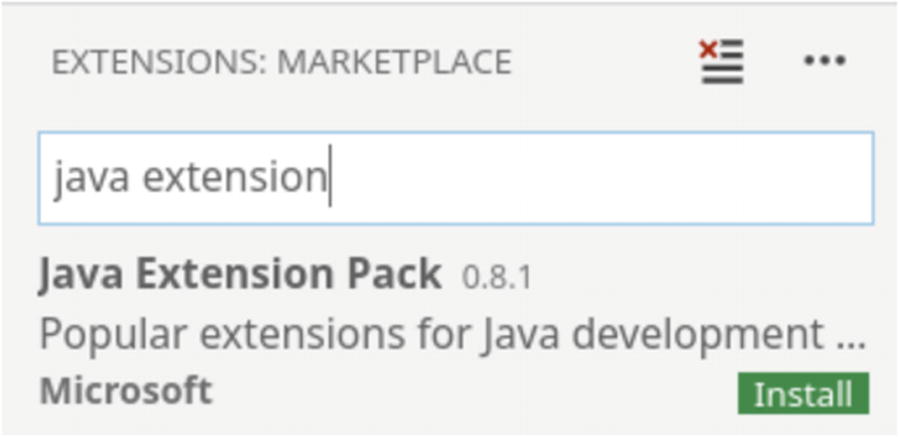
In search of the perfect Java plugin
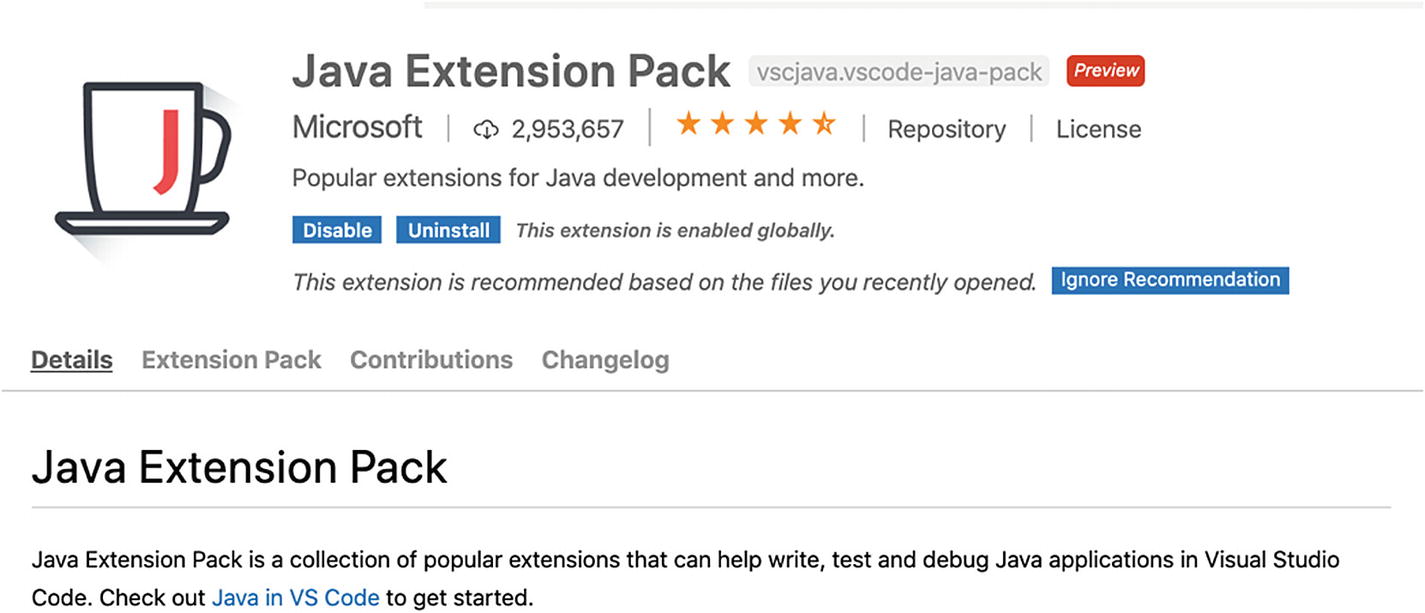
Description of the Java plugin
Language Support for Java by Red Hat:
https://marketplace.visualstudio.com/items?itemName=redhat.java
Debugger for Java:
https://marketplace.visualstudio.com/items?itemName=vscjava.vscode-java-debug
Java Test Runner:
https://marketplace.visualstudio.com/items?itemName=vscjava.vscode-java-test
Maven for Java:
https://marketplace.visualstudio.com/items?itemName=vscjava.vscode-maven
Java Dependency Viewer:
https://marketplace.visualstudio.com/items?itemName=vscjava.vscode-java-dependency
Visual Studio IntelliCode:
https://marketplace.visualstudio.com/items?itemName=VisualStudioExptTeam.vscodeintellicode
These plugins will allow you to perform all the tasks that are useful when writing code, such as autocompletion, code inspection, debugging, and more.
At this stage, after reloading the editor, you are essentially done with the installation steps. The fun development environment is ready; it hasn’t cost you a penny, and almost no personal data has been leaked.
Running Your First Java Application
So, with the editor open, let’s create a file, write some Java code in it, and see how to run the code directly from within the editor.
Running code in Java usually implies a compilation step, where the Java text file is converted to a form that the computer, and here the Java runtime, can execute.
In our setup, all those steps are being handled in the background by Visual Studio Code.
Our first example will just output a greeting, as is usually the case with any well-behaved computer program.
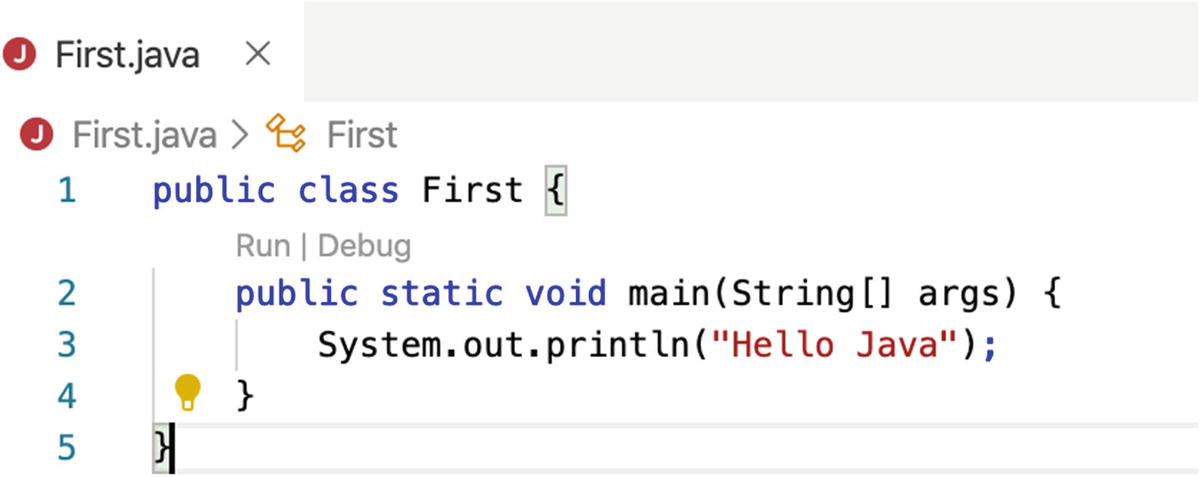
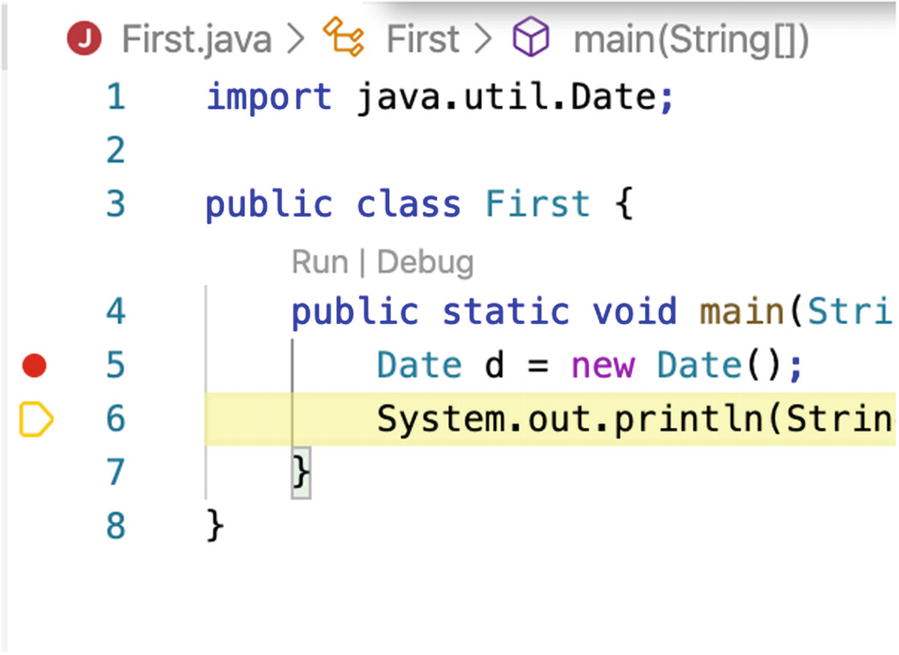
First, let’s create a file named First.java and drop in some very basic Java code. The code will output some basic greeting text; this will also help us check that the setup is fully working.
Your First Java Program
Editor magic
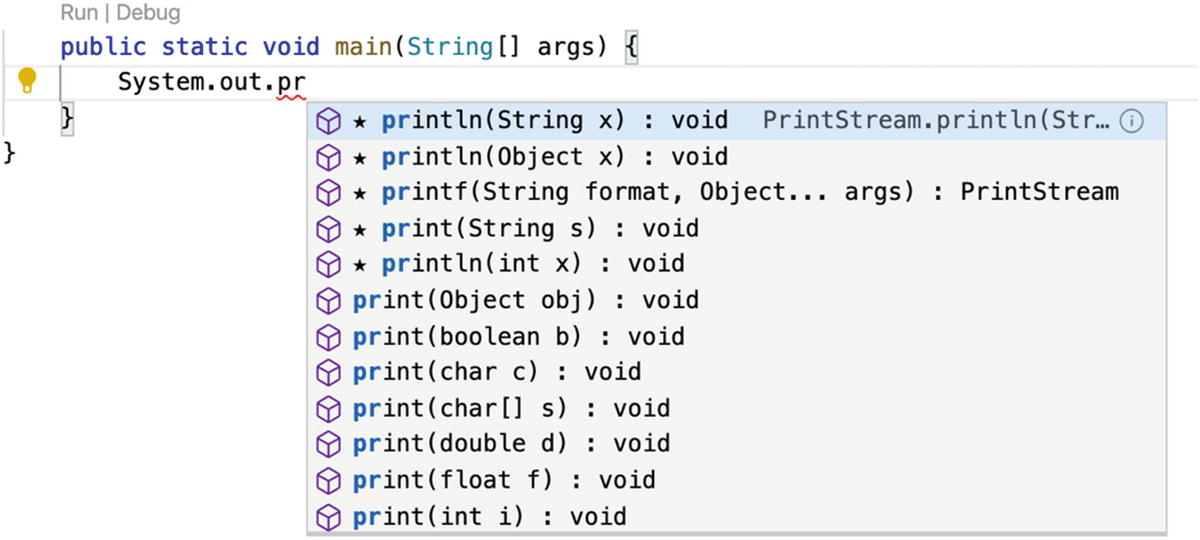
Autocompletion
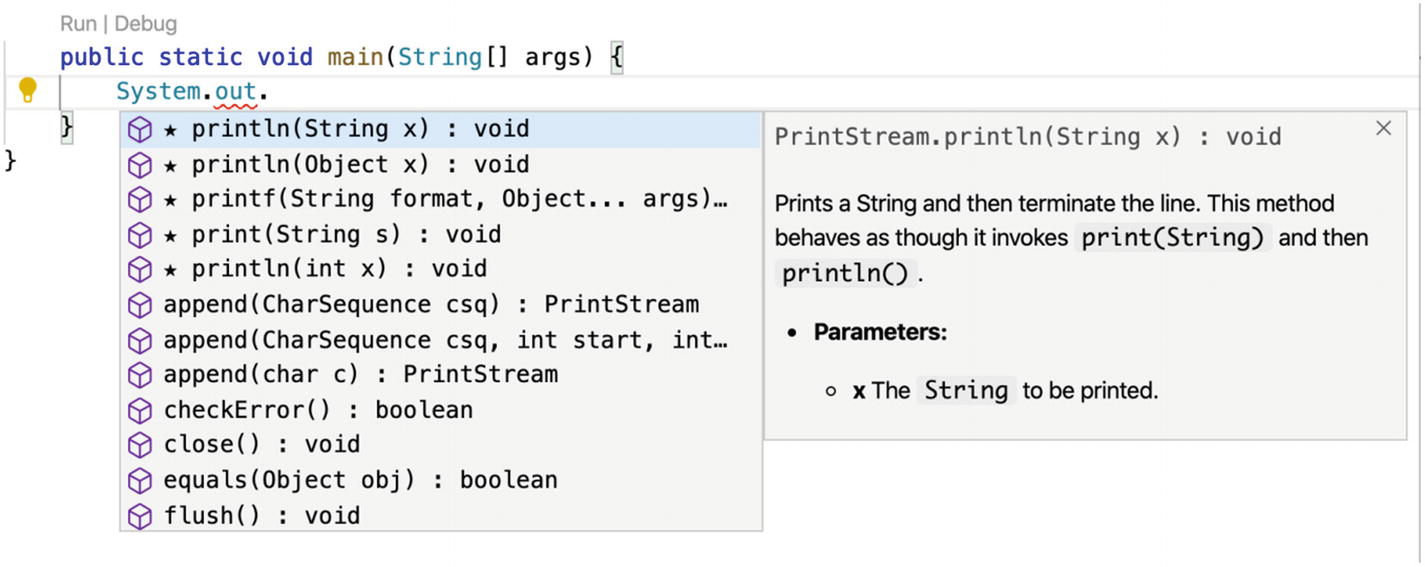
Inline documentation
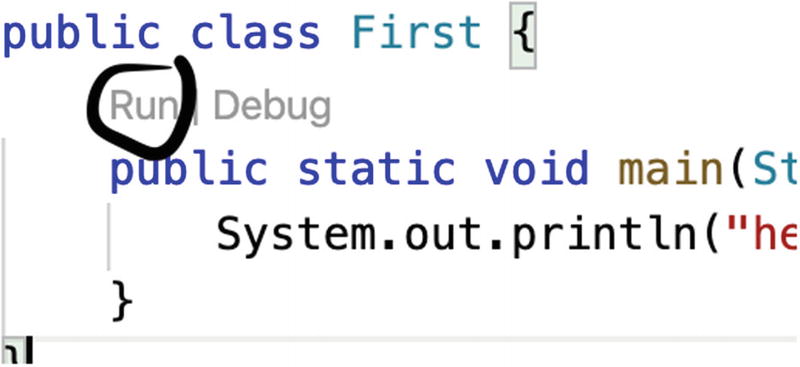
Run and Debug links
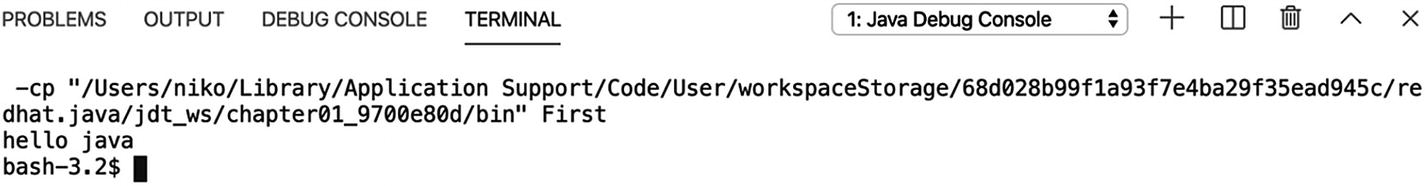
Running some Java code for real
Importing Core Java Packages
You will need to have external classes loaded eventually, and this can be done for you using the editor’s import function. This seems trivial at this stage, but when using OpenCV in Java, some of the packages are hard to figure out, especially when a lot of the code samples do not bother writing the imports for conciseness.
Before Imports
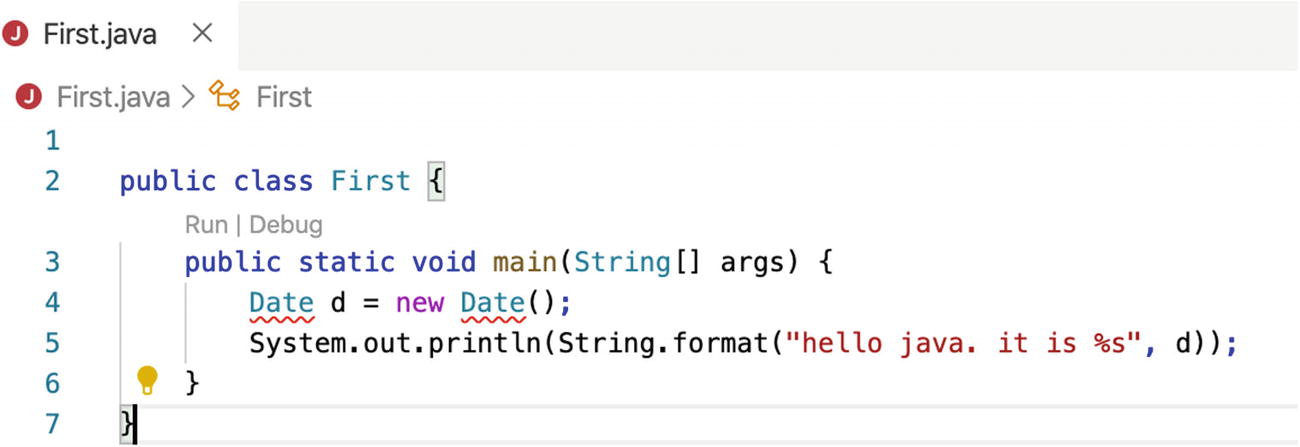
Missing Date class import
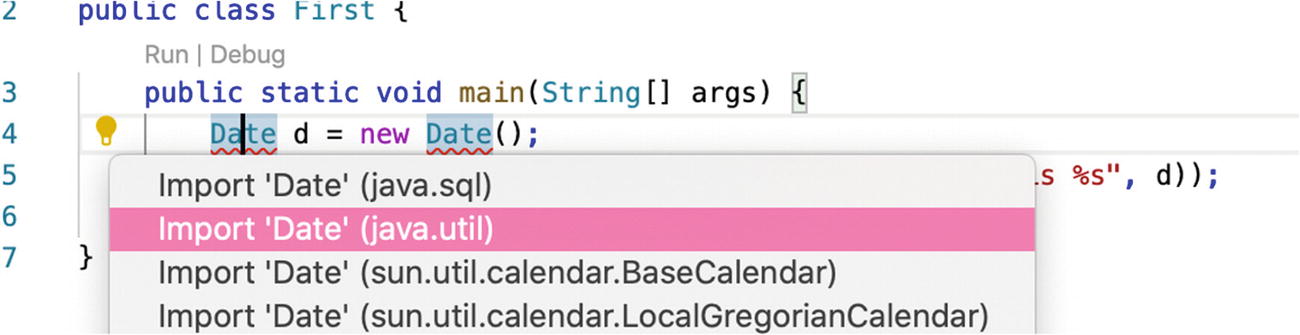
Importing using the light bulb
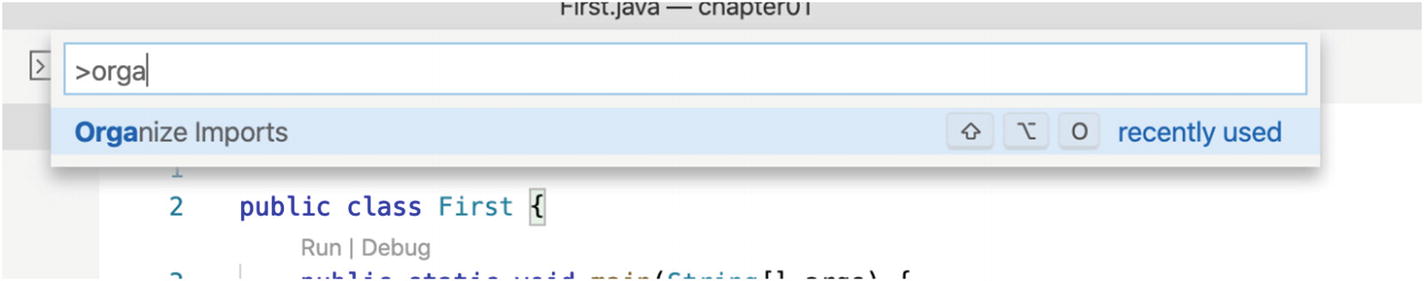
Organizing imports
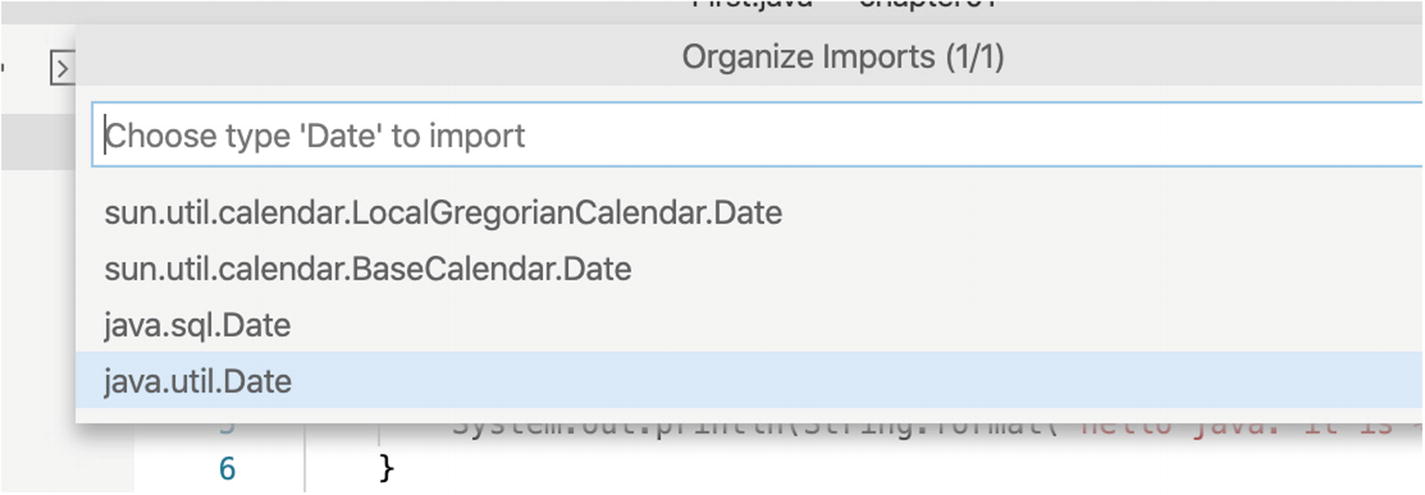
Selecting the proper class
Now that the code is fixed, it is ready to be executed again. Let’s click the same Run link or use the F5 keyboard shortcut to start the execution.
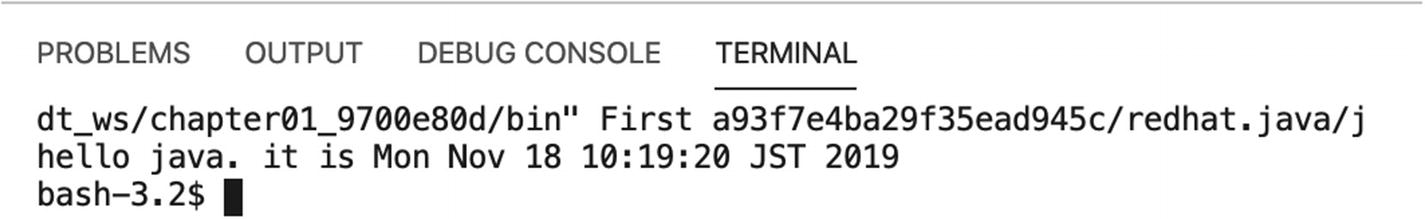
Wow. That code was written and executed in November 2019
Debugging Lesson
This is your book, so you can skip this section on debugging and come back to it later if you want. I decided to add this section on debugging now, when we’re working with some simple code, because getting this part done up front allows you to master the OpenCV code better and go through each OpenCV computation step in a nice and easy-to-understand way.
If you decided to keep reading this part, then great! We are going to spend just a little bit of time looking at how to debug Java code from within Visual Studio Code.
As you have seen, executing the code was quite simple from within the editor. In Java and with this setup, we also get a free debugger. You even get free debuggers in browsers nowadays when running JavaScript code from web pages.
Why is a debugger that important? A debugger allows you to stop the execution at any point in the code and then locally inspect it and act from the position of the stopped code.
That means you can start executing the code but also ask the runtime to stop wherever you want. Also, you do not have to choose where to stop code execution before starting it. Let’s say you do video processing in real time, and at some stage, you would like to know why the code analyzing the camera feed is not finding objects as you would expect it to do. In that case, you can stop the code execution right in the frame capture loop and either dump the picture or rerun the analysis step-by-step so you can find out if the model is wrong or if the picture is still in an unexpected size or color mode.
Java itself does not have a really useful read-eval-print-loop (REPL). A REPL allows you to execute code line by line, and it works quite well with my favorite language, Clojure, and even with Kotlin and of course Python. Java does not make it easy to run and add things line by line, which can be almost forgiven now that debugging has been made so easy from Visual Studio Code.
Add a breakpoint
Execute the code step-by-step
Watch a variable
Change a variable value
Add a Breakpoint
Breakpoint
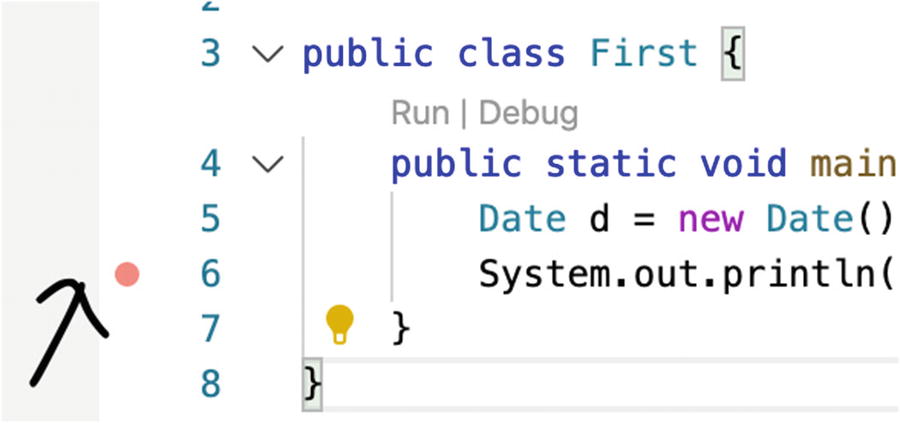
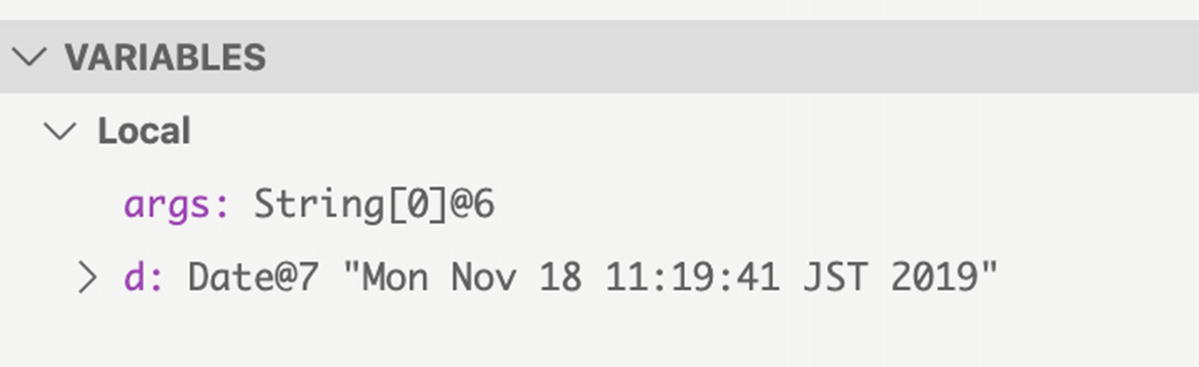
To create a breakpoint, simply click the line number on which you want to stop the execution. Note that the breakpoint will stop the code before any of the code on that line is executed, so adding a breakpoint on line 5 will not show the Date object when the execution stops, but adding a dot on line 6 will, as shown in Figure 1-21.
Execute the Code Step-by-Step
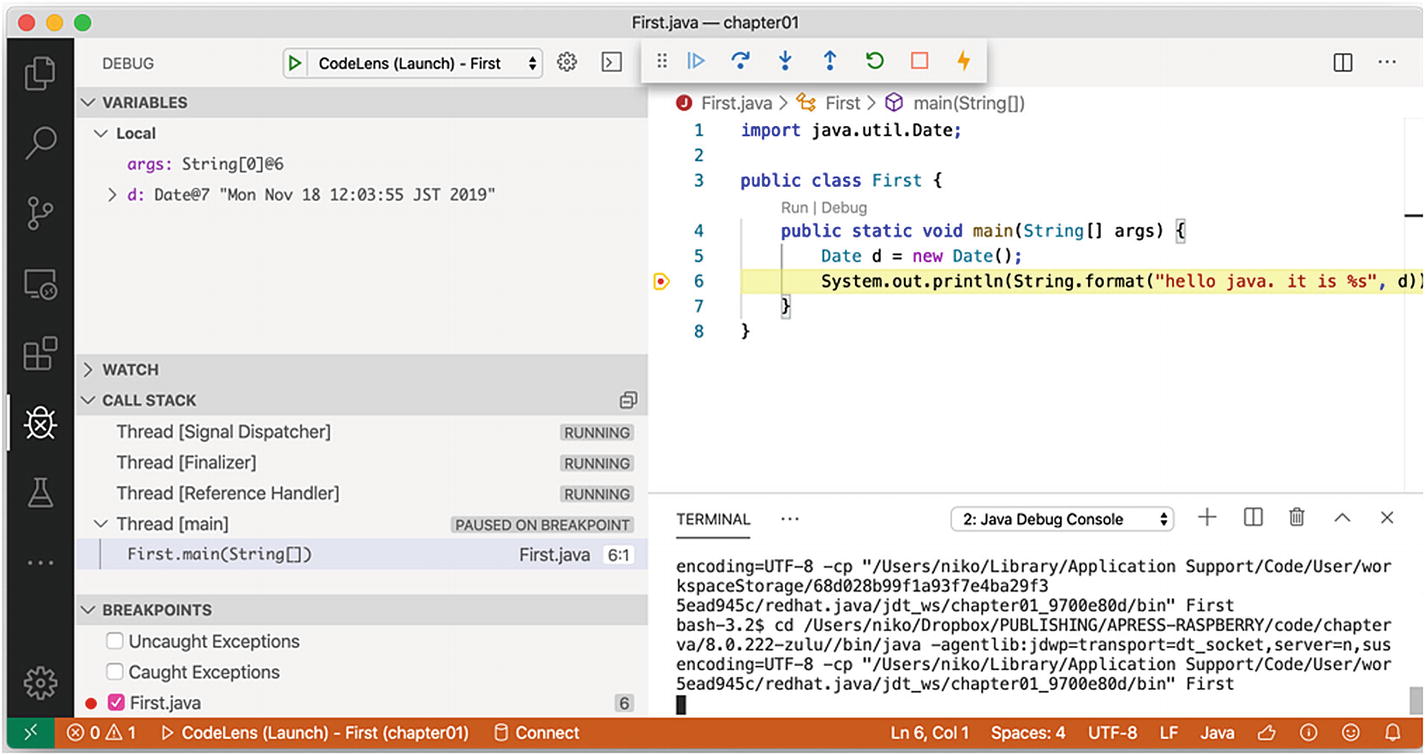
Taking a break
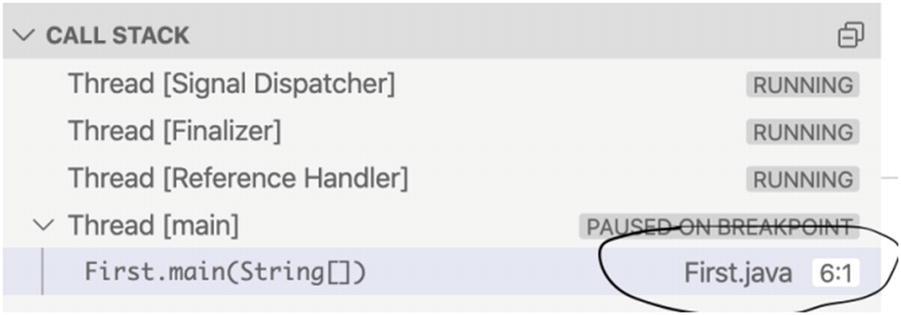
Where am I?
Variables
Expanded variables
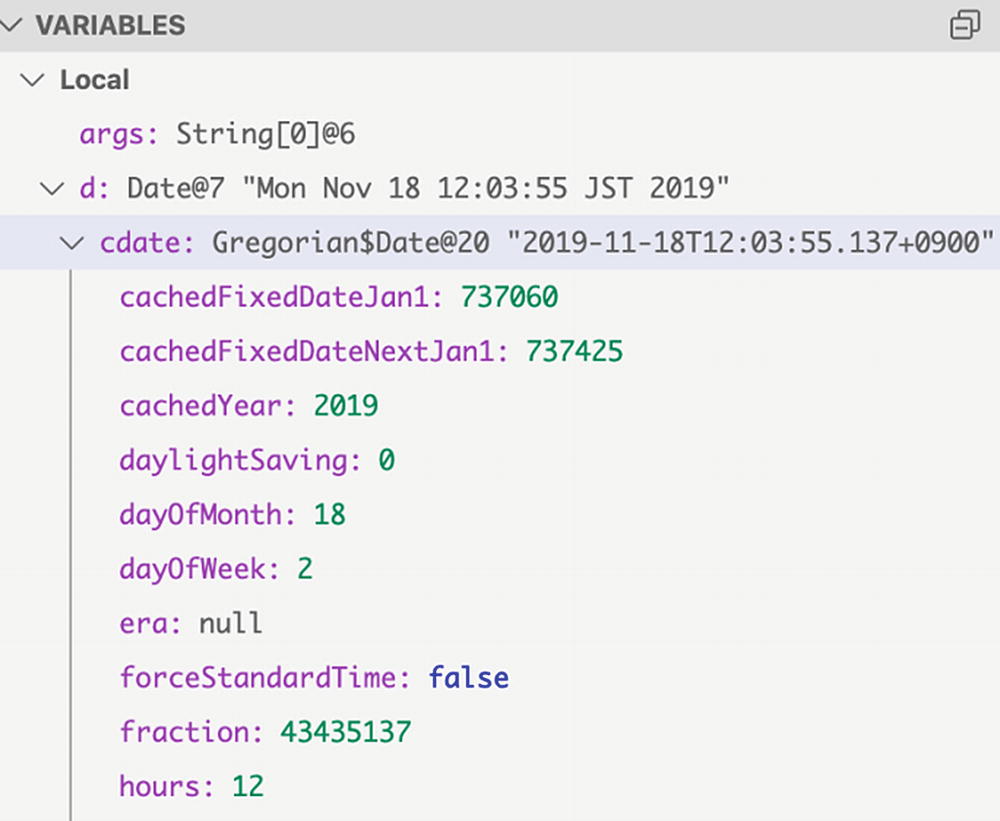
In Figure 1-25 you can see for yourself that the Date object has a field named cdate, and you can see recursively all the fields of that field.
Resume Execution
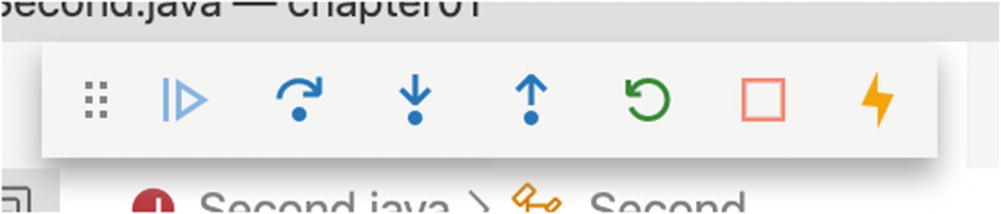
Execution commands
Debugging Actions
Icon | Action | Comments |
|---|---|---|
| Resume | This will tell the execution to go to either the end of the program or the next breakpoint without stopping. |
| Step Over | This executes all the code on the current line, goes to the next line of code, and then stops again. |
| Step Inside | This goes inside each block of execution, so in the previous example, on the first stop, the execution will go inside the format function and then stop. |
| Step outside | This goes to the outer part of the code, so if you were currently in the format function, then this goes back to the original main() function. |
| Restart | This stops all the debugging and restarts from scratch. |
| Stop | This stops the code execution. |
| Hot Code Replace | This updates the code in the runtime, with code from the editor. Real-time coding! |
Next line
Going to the next line and then to the next one will eventually finish the program execution, ideally with the proper message printed in the terminal window.
Watch an Expression
You may have noticed the Watch tab on the left side of the editor and may already have wondered what it is for.
On the top-left Variables tab, you can see the direct values of objects and fields, but on the Watch tab you can add function calls on all the available objects, in what is called a watch expression. Watch expressions can be defined before the variable or the object is instantiated.
In object vision, and while doing direct rendering, you can use a watch expression to produce some side effects, create functions to, for example, turn the input picture from colored to black and white, or quickly create a contour-only version of an image. You can, of course, do all this in real time, but in the coming chapters we will be working with low processing power and memory, so briefly pausing the code execution and using a one-off call to a watch expression is definitely better to keep the extra memory and computation to a minimum.
In this first chapter, we will add simple computations on the watch expression—one with no side effect directly returning a value based on the input parameters and one with a side effect printing to a log file.
The Incredible Loop Over an Integer
We’ll add the expression i+2 in the watch expression and start the debugging session without actually setting a breakpoint yet.
After waiting some time, let’s click to add a breakpoint on line 6 and see the editor stop as if we had set the breakpoint before starting the execution.
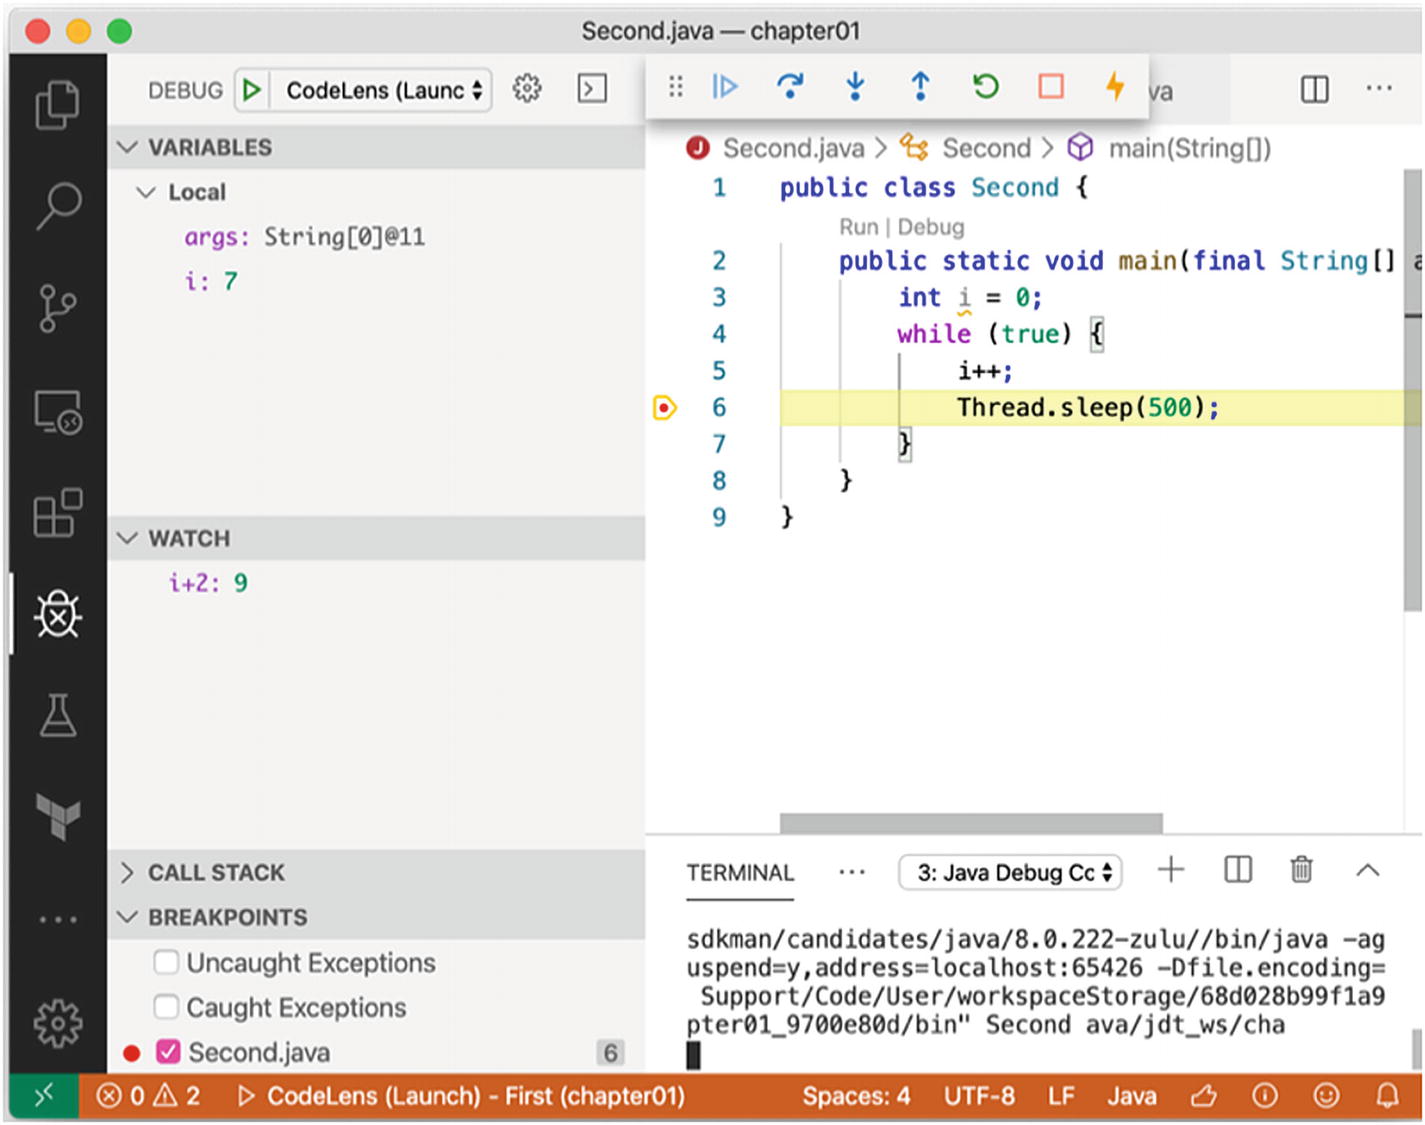
The incredible loop in Debug mode
By clicking and creating a breakpoint, you have just stopped the execution, and the debug layout appears. As you can see, the variable i already has a value of 7, and the watch expression of i+2 is showing the correct value of 9.
Nice.
One function will just do a basic computation on the variable i and display it.
Another function will not return anything but append a value to an external file.
Watched Expressions with Side Effects, and No Side Effect
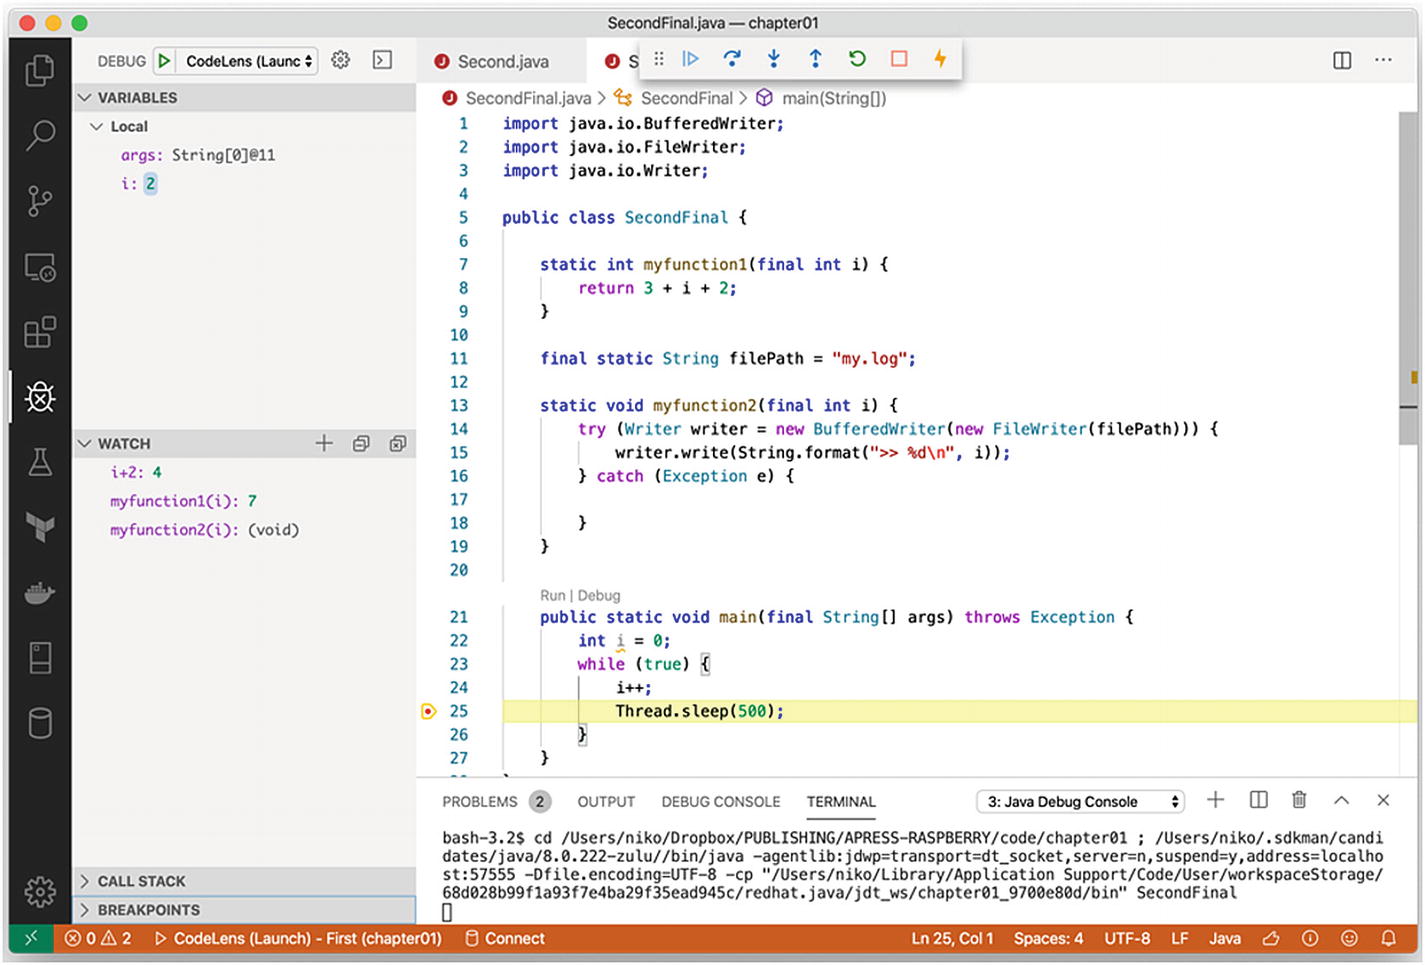
Watch expression
Output the width and height, as well as the number of color channels of an image
Output the Hough lines of an image in an external file
Output the number of detected faces in an image
Remember, you can add watch expressions after starting the code execution in Debug mode, so add them any time you need them.
Change a Variable Value
One last thing to know about debugging in Visual Studio Code before being done is that you can change the value of a variable in real time, straight from the Variables tab.
Now that is some superpower!
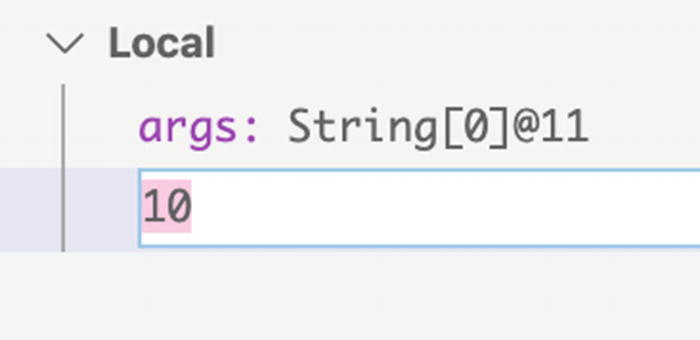
Updating a variable value
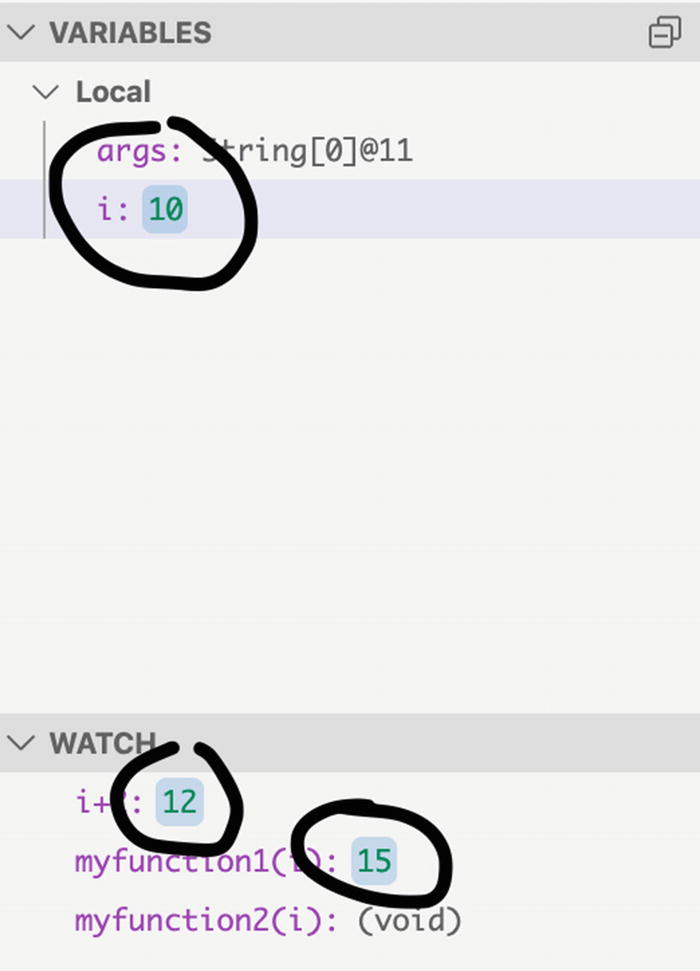
You can see the related watch values being updated
Sweet. In the context of imaging and neural networks, you can directly update alpha, gamma, contrast, etc., directly and have the recomputed images or detection happen in real time.
Wrapping Things Up
We spent a bit of time learning about debugging, so picture how much can be done by reusing the techniques you have just seen in the context of imaging and object detection.
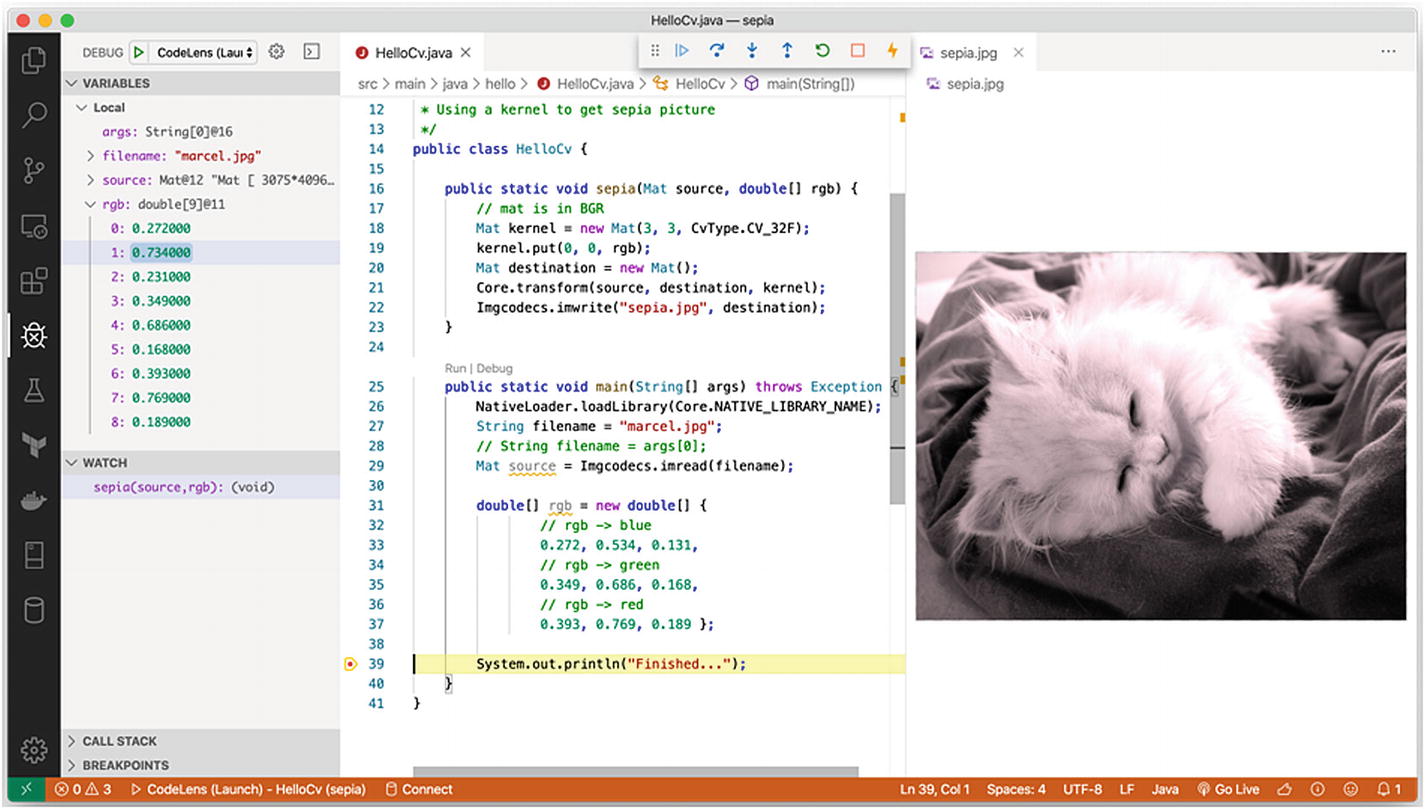
Marcel the cat in sepia
The array of values used to recompute the sepia has been extracted in the main code as a double array.
While debugging, the rgb array and its values are available on the Variables tab and can be updated at will.
The sepia function here is used only as a debugging function, not in the main code.
That sepia function outputs a picture in a file named sepia.jpg.
A watch expression is added, making a simple call to the sepia function defined earlier.
The sepia.jpg picture is opened within Visual Studio Code, and any update of values in the rgb array will output a new picture in real time.
Now that you have an idea of how things can be worked on from within Visual Code Studio, let’s move on to some OpenCV fun.