
CHAPTER EIGHT
How Social Media and User Data Play a Role in Search Results and Rankings
Search engines continually seek to improve the relevance of their search results. They do this by tuning the weight and mix of the types of ranking signals they currently employ, or by implementing new signals. However, how they use these signals is changing all the time. Starting in 2010, evidence mounted to suggest an increasing weight on ranking signals from social media sources. In December 2010, Google and Bing both confirmed this in response to questions from SearchEngineLand.com editor Danny Sullivan.1
However, the way the search engines use social signals has changed significantly since then, and it currently appears that neither Google or Bing use them as a direct ranking factor, although they can impact personalized search results in Google.
Although the search engines obscure how their algorithms work, many people believe that user engagement signals are part of these algorithms, and there has long been a debate over whether search engines have treated these signals as ranking factors.
While search engine algorithms continue to evolve rapidly, adding new types of ranking signals to them is a tricky process that requires a tremendous amount of testing. As we discussed in Chapter 2, the Web consists of hundreds of trillions of pages with fundamental differences in their construction and content. In addition, the needs these pages serve, and the ways that users interact with them, are equally varied.
Search engines generally perform many levels of testing of new algorithms, including live tests with a small portion of their users prior to any general release of new ranking factors; you can read more about all the stages of testing in this interview with Google’s Director of Research, Peter Norvig. In the same interview, Norvig suggests that Google makes two to three algorithm changes per day. This means change is a constant.
The key to success in search engine rankings is to remember the fundamental goal of the search engines: to increase market share by providing the best possible (i.e., most relevant and engaging) results for end users. Astute Internet marketers who understand this will focus on providing high-quality website content and experiences for their visitors.
Correlation Between Social Signals and Google Rankings
In 2013, Moz did a study that showed a strong correlation between Google +1s and rankings in Google. The detailed results are shown in Figure 8-1.
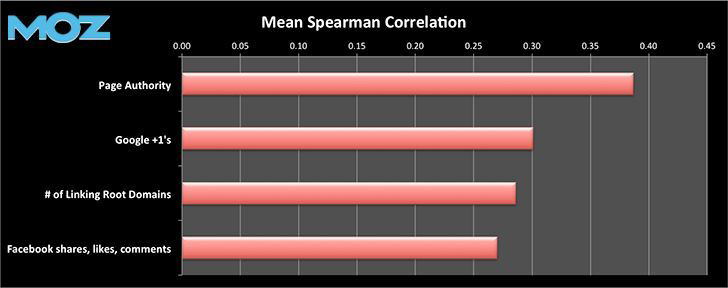
Figure 8-1. Moz correlation study
Searchmetrics performed its own correlation study. As shown in Figure 8-2, the results showed a very strong correlation between many different types of social signals and search ranking. In fact, 7 of the top 10 factors correlating with ranking were related to social media sites.
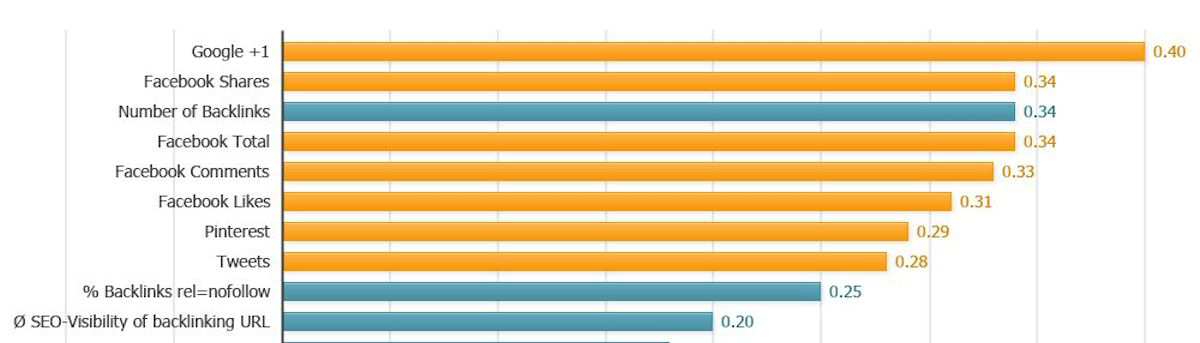
Figure 8-2. Searchmetrics correlation study
It is important to note that a correlation does not prove causation—in other words, this information does not prove that these social media factors are a direct ranking signal.
Nonetheless, the correlation is noteworthy and only supports our long-standing belief that great content has a strong chance of earning a high number of traditional web links, and of being shared more in social media.
What Is the Value of Social Signals?
Google was first established in 1996 based on the concept of PageRank, where links from third-party websites would serve as votes for the quality of the site receiving the links. This was a valuable concept because the Web evolved as an environment where creating great content was rewarded through links and the cross-referencing of other great content—a natural result.
The collection of data on all the links of the Web, which is referred to as the link graph, is an enormous computational task that maps who links to whom in a vast diagram of the Web’s interconnectivity. Figure 8-3 shows a conceptual representation of the link graph. From this, search engines can extract valuable signals to identify relevant web pages in response to a particular search query.

Figure 8-3. The link graph is a map of all of the World Wide Web’s hyperlinks
This system in its original form, however, was dependent on the links originating from editorial citations. In other words, it assumed that publishers created a link on a third-party website because they genuinely cared to send visitors from their own site to the linked site solely because it was a great resource. This was a publisher’s primary incentive for providing the link. In fact, links were the first social signal used by search engines to aid in ranking web pages.
Over time, of course, some publishers who realized there was a lot of money to be made from high search rankings began cheating the system by purchasing or soliciting links that were not citations at all. The proliferation of this link-selling economy and schemes for getting links that are not earned based on the content’s merit, generally referred to as link spam, has threatened search quality and resulted in a war between search engines and link spammers.
Similar to the way in which the link graph acts as a proxy for real-world connections, social connections and user behavior patterns reflect real-world relationships and values. In order to implement a link to a website, one must first have a web property. While creating a website can in fact be free on today’s Web, one must commit time and energy to that site to be viewed as a valuable resource. As a result, many people do not make that investment.
Participating in social media platforms such as Facebook, Google+, or Twitter requires zero cash outlay (beyond an Internet connection and a connecting device) and only a small amount of time investment. As a result, social media is more populist in nature than the link graph. Of course, the use of social media is not universal either, but it is far more broadly adopted than the publication of websites.
As users, we like proof from our peers that something is good. If your friend liked it, and you trust her judgment, you become more inclined to check it out yourself. For example, your trusted friend is unlikely to have endorsed a spam site.
However, problems arise when you try to use these social signals as a ranking factor in the search results. The search engines experimented with these signals and pulled back because they found problems with it. There are some ways in which social information is currently integrated into the search results, however, and these will be explored in the next few sections.
Bing’s Experiments with Social Signals
Bing has relationships with many social media platforms. These relationships provide Bing with real-time access to any updates that occur on those networks. For example, when someone posts an update on his Facebook page, Bing gets notified of that update via its API, which means it gets the data relatively quickly, and with minimal overhead. Social sites that Bing has such relationships with include:
-
Facebook
-
Twitter
-
Foursquare
-
Quora
-
Klout
In contrast, Google has to crawl Facebook to obtain comparable social update info, and only as of May 19th, 2015 did Google start to get access to Twitter data via API. This is what makes the experiments that Bing has conducted interesting to review in detail.
For example, Bing experimented with using data from Facebook as a ranking factor in the search results. Figure 8-4 shows how Bing’s search results looked in 2010 if you performed a search on the phrase New York Post.
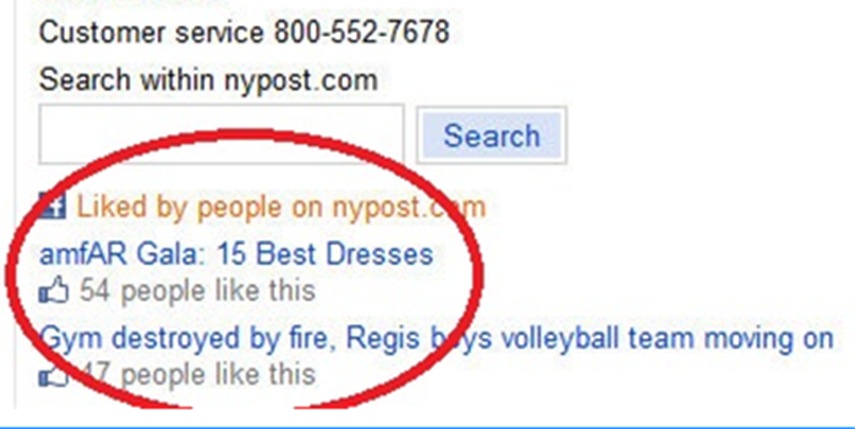
Figure 8-4. Bing search results from 2010 for “New York Post”
Notice how two articles with a number of Facebook likes are highlighted in the results. However, if you performed the same search in 2011, the nature of the result had changed quite a bit, as you can see in Figure 8-5.
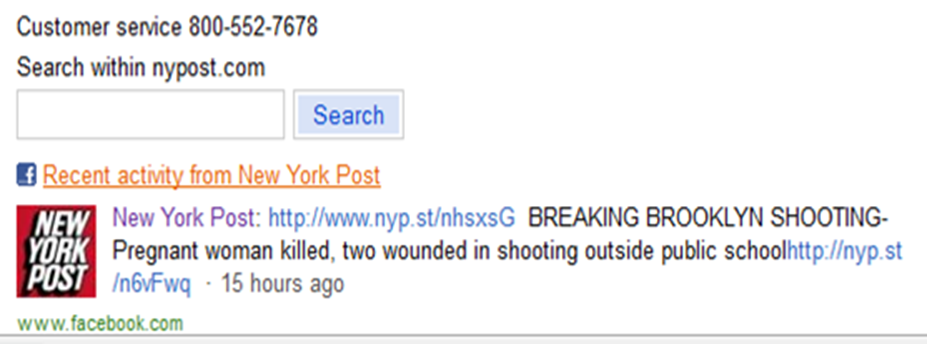
Figure 8-5. Bing search results from 2011 for “New York Post”
The result is quite different: Bing has dispensed with showing the most liked articles and instead highlights a recent post from the newspaper. While it is not indicated in the search result, it is possible that this article has received recent Facebook likes, but we don’t know that for sure. Figure 8-6 shows us, however, that this ambiguity has been eliminated in Bing’s results for the same search in 2012.
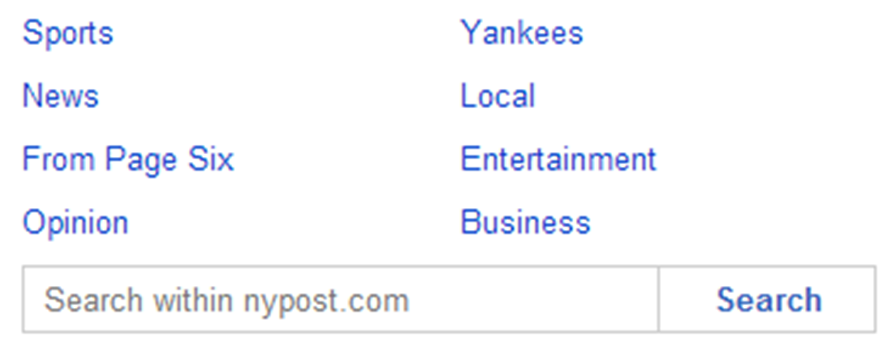
Figure 8-6. Bing search results from 2012 for “New York Post”
In a February 2013 interview by Eric Enge with Bing’s Stefan Weitz,2 Weitz had this to say about whether Bing used likes as a ranking signal:
Not now, no. The notion of a Like is still a little bit perplexing from a ranking perspective. What does a Like mean for a page? Does the user like the design, the content, or maybe just the picture? We tend to not just use a pure Like signal to do ranking.
He also said:
Shares are basically the same as likes—not used a ton for web ranking except in velocity (like Twitter).
For a while, Bing went in a completely different direction by separating out the social part of its search results into a sidebar. Figure 8-7 illustrates this implementation.
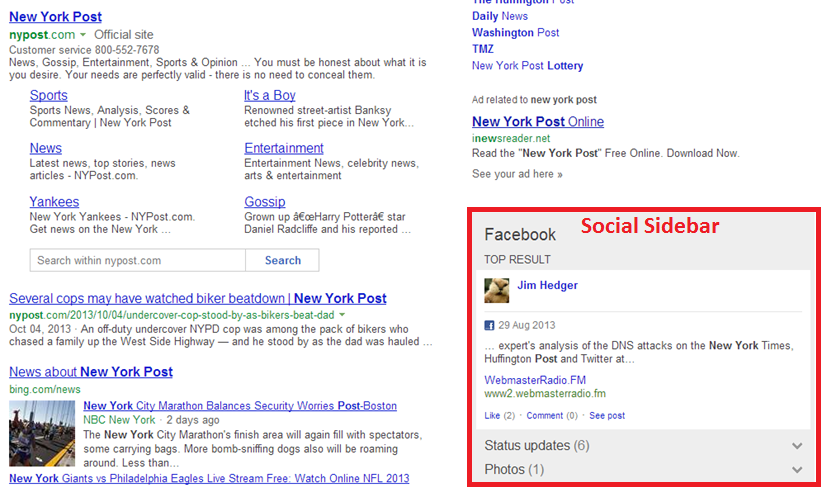
Figure 8-7. Bing’s social sidebar
Does Google Use Facebook as a Ranking Signal?
As previously mentioned, unlike Bing, Google must crawl Facebook to get data on activity on the site. Consequently, Google will not be able to get any data from pages that are not marked as Public by the profile owner. That is a very large crawling burden. To determine how many pages Google indexes from Facebook, Stone Temple Consulting performed a study, published in December 2013. We can see how many pages Google has indexed from Facebook in Figure 8-8.
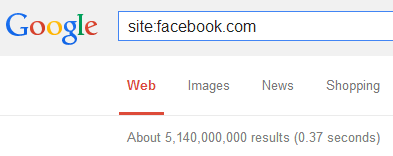
Figure 8-8. Facebook pages indexed by Google
Google has indexed 5.14 billion pages from Facebook according to this query. To put this in perspective, data released by Facebook in February 2014 indicated that it had 1.2 billion users, and that 10% of these put out daily updates, and 4% put out more than one update per day.
We can use these figures to estimate the number of total Facebook updates per month. We can start by taking 10% of the total number of users, and multiplying that by 30 to account for all the users who do at least one update per day. This works out to 3.6 billion updates per month.
However, we also know that 4% of users perform multiple updates, and we can estimate their usage by guessing that they average three updates per day. Of course, some users perform only two, others do much more than three.
For purposes of this analysis we are going to estimate the total number of additional updates per day as the number of users times 2 times 30. Note that we use 2 in this calculation instead of 3, as we have already counted 1 daily update per user in our prior calculation. The result is another 2.88 billion updates per day.
This gives us an average of 6.48 billion Facebook updates per day, which is already more than Google has indexed from Facebook in total! The study also tracked the monthly pages Google indexed from Facebook from January 2012 through March 2014, as shown in Table 8-1.
| Month | Indexed pages | % of estimated updates per month |
|---|---|---|
| March 2014 (through 3/29) | 77,900,000 | 1.91% |
| February 2014 | 4,330,000 | 0.11% |
| January 2014 | 5,490,000 | 0.13% |
| December 2013 | 7,840,000 | 0.19% |
| November 2013 | 7,160,000 | 0.18% |
| October 2013 | 8,510,000 | 0.21% |
| September 2013 | 4,160,000 | 0.10% |
| August 2013 | 26,200,000 | 0.64% |
| July 2013 | 48,400,000 | 1.18% |
| June 2013 | 168,000,000 | 4.11% |
| May 2013 | 166,000,000 | 4.06% |
| April 2013 | 166,000,000 | 4.06% |
| March 2013 | 3,160,000 | 0.08% |
| February 2013 | 2,770,000 | 0.07% |
| January 2013 | 1,950,000 | 0.05% |
| December 2012 | 2,740,000 | 0.07% |
| November 2012 | 2,690,000 | 0.07% |
| October 2012 | 2,630,000 | 0.06% |
| September 2012 | 1,550,000 | 0.04% |
| August 2012 | 2,570,000 | 0.06% |
| July 2012 | 2,490,000 | 0.06% |
| June 2012 | 2,440,000 | 0.06% |
| May 2012 | 1,030,000 | 0.03% |
| April 2012 | 2,510,000 | 0.06% |
| March 2012 | 2,150,000 | 0.05% |
| February 2012 | 1,860,000 | 0.05% |
| January 2012 | 856,000 | 0.02% |
As you can see, the indexing of this content appears to happen at a very low rate. Note there are some sources of error in this data, as the total number of Facebook updates has been increasing over time, and the site: operator is not a precise measure in Google. But these errors do not impact the basic conclusion: Google does not index the overwhelming majority of Facebook posted content.
Also of significance is that links from Facebook to external pages use the nofollow attribute (which is defined in Chapter 6 and highlighted in Figure 8-9). This means that these links do not pass PageRank to the pages receiving the link.
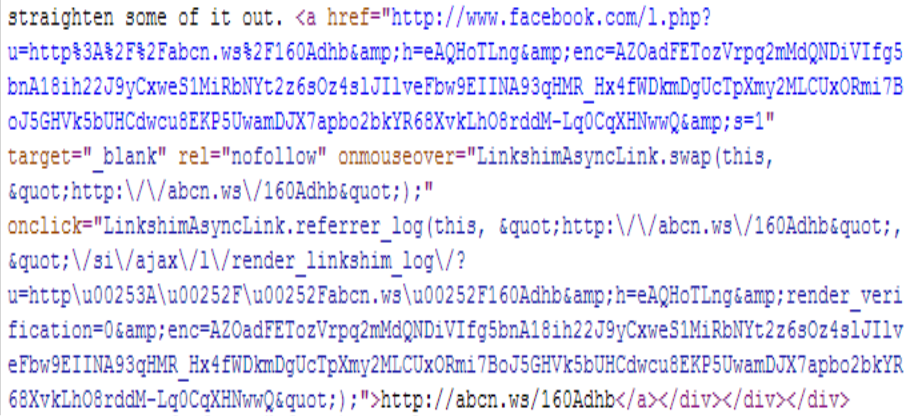
Figure 8-9. Facebook links are nofollowed
One last consideration is whether Google might place more emphasis on indexing posts from highly influential people. Perhaps it places more weight on shares by people and brands with authoritative profiles. To test this theory, Stone Temple Consulting performed a study.
This study looked at 40 Facebook posts done by 85 influential users over a one-year period. The users examined each had at least 125,000 likes for their page. The tested posts were spread over differing time intervals as follows:
-
10 most recent posts
-
10 posts at least 3 months old
-
10 posts at least 6 months old
-
10 posts at least 12 months old
Each post was tested to see if Google had it in its index. Figure 8-10 shows the results. In aggregate, about 59% of these posts were indexed.
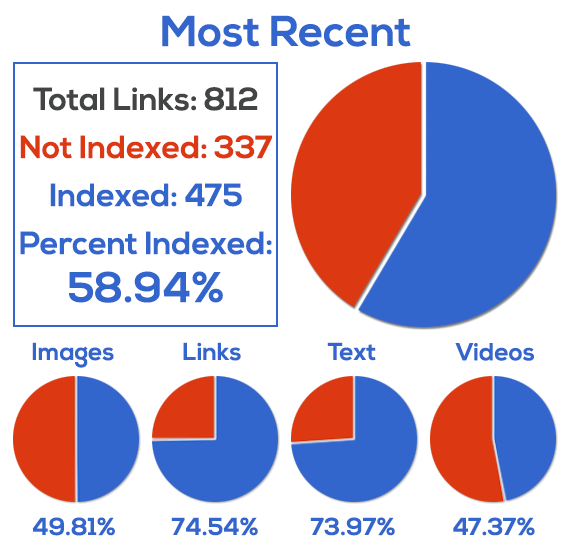
Figure 8-10. Facebook pages indexed by Google
Note that about 74% of the text posts were indexed and 75% of the posts with links in them were indexed. If these were a major ranking factor, it seems likely that Google would be indexing a larger percentage of these posts.
This result, combined with Bing’s stance on using Facebook data in search, suggests that Facebook posts are not a major factor in driving the search results. This could possibly change in the future, however, as search engines continuously experiment with new ways to use different types of signals as a ranking factor.
Does Google Use Twitter as a Ranking Signal?
An analysis of Twitter usage shows some similar results to those we saw with Facebook. In Twitter’s IPO filing, the company reported that it is handling more than 500 million tweets per day on average. Figure 8-11 shows a combination of two Google search queries that attempt to find out how many Twitter status updates Google has in its index.
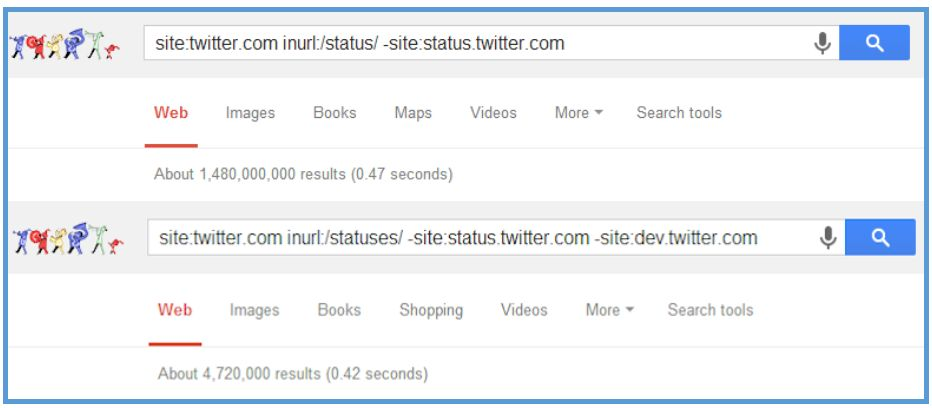
Figure 8-11. Twitter pages indexed by Google
This shows a total of 1.27 billion pages, which is a pretty small number when you consider that there are 500 million tweets per day.
In another Stone Temple Consulting study by coauthor Eric Enge, the search query in Figure 8-11 was repeated, but it included the daterange: operator to see how many new pages Google kept in its index on a monthly basis from January 2012 through June 2014. That data is shown in Table 8-2.
| Month | Indexed pages | % of 500M |
|---|---|---|
| Jan-12 | 494,000 | 0.10% |
| Feb-12 | 1,230,000 | 0.25% |
| Mar-12 | 1,330,000 | 0.27% |
| Apr-12 | 1,220,000 | 0.24% |
| May-12 | 669,000 | 0.13% |
| Jun-12 | 1,720,000 | 0.34% |
| Jul-12 | 2,360,000 | 0.47% |
| Aug-12 | 2,660,000 | 0.52% |
| Sep-12 | 1,850,000 | 0.37% |
| Oct-12 | 2,520,000 | 0.50% |
| Nov-12 | 1,870,000 | 0.37% |
| Dec-12 | 1,530,000 | 0.31% |
| Jan-13 | 924,000 | 0.18% |
| Feb-13 | 1,590,000 | 0.32% |
| Mar-13 | 1,640,000 | 0.33% |
| Apr-13 | 1,570,000 | 0.31% |
| May-13 | 924,000 | 0.18% |
| Jun-13 | 1,540,000 | 0.31% |
| Jul-13 | 1,420,000 | 0.28% |
| Aug-13 | 1,320,000 | 0.26% |
| Sep-13 | 777,000 | 0.16% |
| Oct-13 | 1,480,000 | 0.30% |
| Nov-13 | 1,530,000 | 0.31% |
| Dec-13 | 1,620,000 | 0.32% |
| Jan-14 | 1,030,000 | 0.21% |
| Feb-14 | 1,920,000 | 0.38% |
| Mar-14 | 2,270,000 | 0.45% |
| Apr-14 | 3,270,000 | 0.65% |
| May-14 | 2,750,000 | 0.55% |
| Jun-14 | 9,090,000 | 1.82% |
This data suggests that the indexing rate of tweets is actually quite low. However, as we mentioned with Facebook, the number of results from site: queries is not always that precise. The study also included an analysis of the indexation of posts for 963 different Twitter accounts. Of these, 58 had at least 100,000 followers. These were hand-selected to be highly influential people. The study then tracked the indexing of their tweets over time. The results are shown in Figure 8-12.
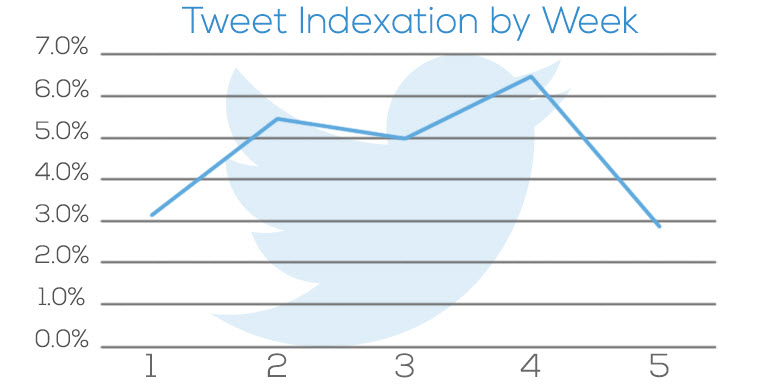
Figure 8-12. Indexation of tweets over time
Taken together, Table 8-2 and Figure 8-12 show us that Google’s overall indexing of tweet content is low, but it does index a high percentage of tweets from more influential accounts. Note that it is possible that this is because these tweets tend to receive links. This would increase Google’s desire to index the content in the tweet.
Figure 8-13 shows the source code for a tweet containing a shared link. As with Facebook, this link is nofollowed, so no PageRank is passed.
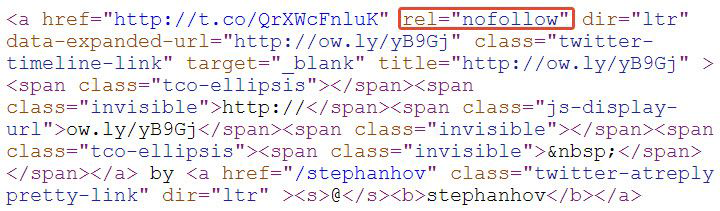
Figure 8-13. Twitter links use the nofollow attribute
As of May 19th, 2015, Google started accessing Twitter data via the API, but a study published by Eric Enge in July of 2015 showed that increases in indexation of tweets had occurred, but the total indexed tweets remains small. In summary, the evidence suggests that Google does not currently use activity in Twitter as a ranking signal.
Does Google Use Google+ as a Ranking Signal?
Google+ is the social network owned by Google itself. Unlike Facebook and Twitter, Google obtains information from Google+ in real time. As soon as you complete a share in Google+, Google knows it has happened. This makes it seem far more likely that Google would use this data as a ranking factor in its search results. In fact, there are a few clear ways that Google+ impacts the Google search results.
Google+ Personalization
Personalization plays a significant role in Google’s search results, and Google+ can be a part of that. For example, if someone is following you on Google+, the chances that she will see your posts in Google’s search results go way up. Figure 8-14 shows an example of this.
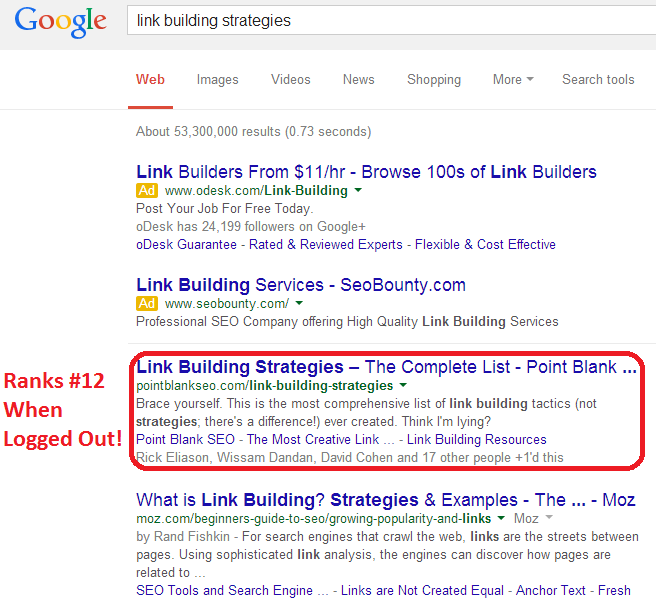
Figure 8-14. Google+ personalization in action
The highlighted listing ranks #1 in the organic search results when the searcher is logged in, but ranks only in position #12 when the same user performs an incognito search (in Google’s Chrome browser, this mode turns all personalization off). This is a big impact! The reason for the change in the personalized results is that four people whom this user follows on Google+ have +1’ed the content.
The impact of this on your business can be quite substantial. Consider the post shown in Figure 8-15.
The great majority of these +1s are likely to be from people interested in search, and for all of these users, this article will rank higher in the search results. But it is also more likely to rank higher for everyone they follow! This means that there are two bites at this apple already:
-
People who follow the author on Google+ are more likely to see it
-
People who follow anyone who +1’s the content are more likely to see it
This is already a very big deal. If you can build a strong audience of your own, or if major influencers in your market space +1 or share your content, you can get a lot of exposure to your target market.
In addition, it appears that people you exchange Gmails with can also create the type of connection that leads to the personalization of results.3
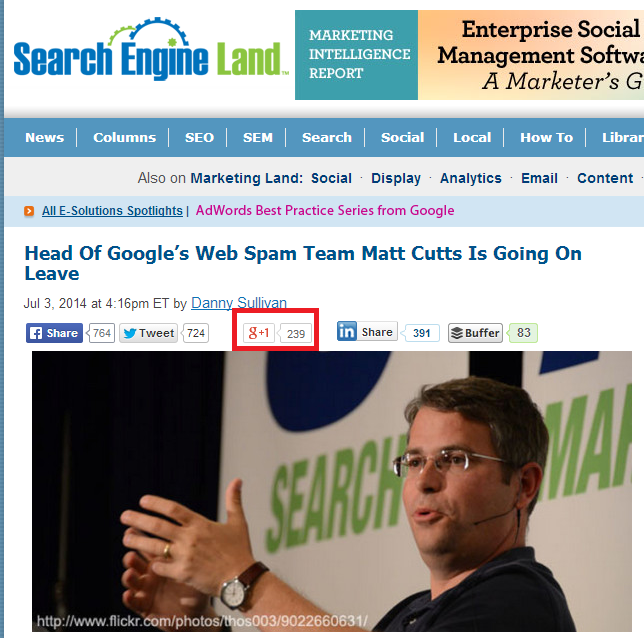
Figure 8-15. A post with many +1s
Google+ Posts in the Search Results
Google+ posts themselves can also rank in the search results, as you can see in Figure 8-16.
Figure 8-16. Google+ post in search results
This post came up even though the search was performed in incognito mode, so all personalization of the results is turned off.
Google+ Brand Pages in the Search Results
Another benefit of Google+ is that your company (or institution) can create a brand page. If you properly connect that brand page with your website using the rel="publisher" tag (which is covered in more detail in Chapter 6), and you have some basic level of activity on the page, it can show up in the search results as well.
This is particularly likely to happen on a search for your own brand name, as shown in the search for Major League Soccer in Figure 8-17.
Figure 8-17. Brand page showing in Google’s search results
This is nice real estate to own, and can really add to the brand impression of your business. For Major League Soccer, we see the number of followers it has on Google+, and a Follow button at the top right. Google obtains additional information from many different sources, but it is experimenting with allowing publishers to get their social profiles added to the panel shown on the right.
Google+ Impact on Nonpersonalized Rankings of Content
Many people have debated whether Google+ impacts the nonpersonalized results in Google as well. As Figure 8-18 indicates, Google+ posts used to pass PageRank, but this is no longer the case.
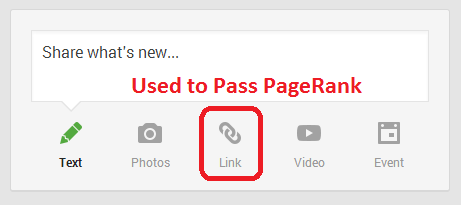
Figure 8-18. Links in Google+ posts used to pass PageRank
You can examine the source code of a Google+ post in detail to verify that these links are now nofollowed. Figure 8-19 shows an example of the source code for a particular post.
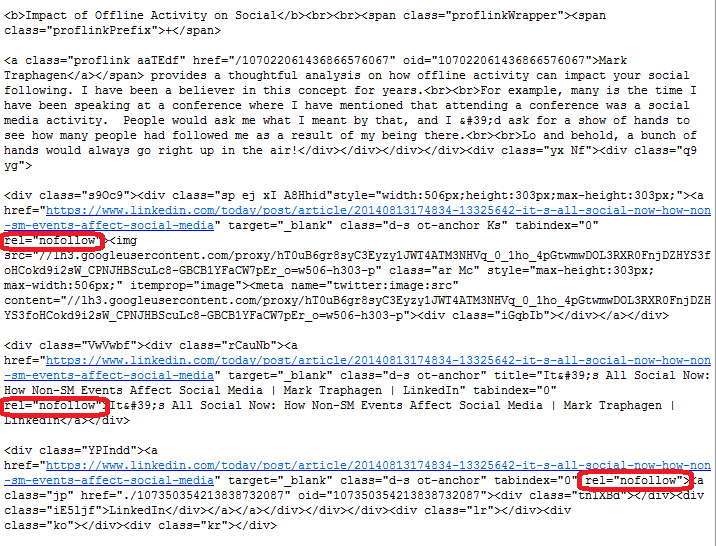
Figure 8-19. Google+ links are nofollowed
Study on Google+ as a Ranking Factor
Despite the evidence to the contrary just shown, many people still believe that activity in Google+ can drive search rankings. For that reason, Stone Temple Consulting’s Eric Enge performed a study on this as well. The study was designed to see if Google+ shares of links to a web page (not on Google+) would improve the rankings of those pages.
This study took a number of web pages and published them on three different websites. These pages all had these characteristics:
-
The pages contained fresh, original content, relevant to the site on which they were published.
-
The pages had no links to them whatsoever. No external pages linked to them, and no links were implemented from the pages from the domain on which they were published.
-
There was absolutely no Google code (i.e., no Google Analytics code, Google+ code, or any other kind of Google code) implemented on the pages.
-
Participants in the test were not allowed to use Google Chrome to visit the pages.
The next step was to conduct some Google+ shares to those web pages so that Google would discover the pages. These shares were done on July 19, 2013, and by July 29, 2013, all of the pages in the test had been indexed. At that point, rankings for very long-tail search terms were monitored until the end of the test.
Seven days after initial indexation, an additional set of shares was performed to the pages. The purpose of this latter set of shares was to see if the rankings that were being monitored would change. You can see a partial data set for the rankings in Figure 8-20.
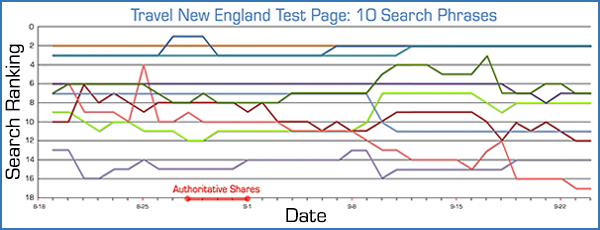
Figure 8-20. Google+ ranking study test results
In short, there was no real evidence of any movement in rankings as a result of the test. Based on this result, there is no reason to believe that rankings are impacted by Google+ shares.
Last but not least is Google’s recent Hummingbird release. While most people associate this update solely with improvements in processing natural language queries, this is only one aspect of Hummingbird, and in fact it is a complete rewrite of Google’s search engine platform. According to Danny Sullivan, part of the goal with Hummingbird was to allow Google to better process signals other than links, such as signals from social platforms.4
While this new information implies that Google is not using social signals yet, it suggests that Google is considering using them in the future.
How Might Google Use Google+ as a Ranking Factor?
Google will work hard to develop algorithms that extract clear signals of value from Google+. How might it do that? We’ll illustrate with an example. Consider the following three people, bearing in mind that this example is pure speculation:
- Person 1
-
This person is active on Google+ and he shares lots of content—his own, and content shared by others. In addition, he always adds thoughtful commentary in his shares and comments on a lot of other people’s posts as well. The content he posts gets lots of +1s, reshares, and comments, and his comments on other people’s posts often draw a reaction too. Many of the people he interacts with frequently also get tons of interaction with their activity in Google+.
- Person 2
-
Like Person 1, this person is active on Google+ and shares lots of content—her own, and content shared by others. However, she doesn’t often add much content and she doesn’t get the same level of interaction from others as Person 1. The interaction she gets tends to be more perfunctory in nature.
- Person 3
-
This person is not on Google+ at all. He is a total rockstar in his space, and everybody knows it, but he does not have a Google+ profile.
Google can’t afford to punish Person 3 in the search results. That would be bad for its primary product (you know, the one it makes all the money on?). What Google can do, though, is make comparative judgments between Person 1 and Person 2. In fact, Google may look for ways to recognize the relative authority of Person 3 using signals outside of Google+ and reward him accordingly.
Of course, we don’t know exactly how Google is looking at these types of signals, but it will try to find ways to extract value from them that increase the quality of its results. That demands a balanced approach to the data on Google’s part, and an incredible amount of testing and verification.
We know that the personalization impact is quite strong, and that Google+ posts themselves can rank in the SERPs. This is already a compelling reason to engage in Google+, especially if there is a real audience for you there. We also know that Google gets the information from Google+ directly. Unlike with Facebook and Twitter, there is no crawling involved in this process. While Google+ continues to grow, on July 27, 2015, Google announced that they would “decouple” Google+ from other Google products—essentially removing the requirement that Google+ be the unified identity for users across all Google products. Later that month, Google began the “unverification” of inactive Google+ local (GMB) pages. How Google+ will evolve has yet to be determined, but these moves have definitely signaled a shift in Goolge’s strategy.
The Indirect Influence of Social Media Marketing
Social media can also influence search rankings in a number of indirect ways. For example, it can have a direct branding impact. Here are some other areas where social media can have an indirect influence:
- Audience building
-
You can build a following by using social media platforms such as Facebook, Twitter, Pinterest, and others to regularly communicate valuable information. Successful use of this tactic can help you develop greater engagement with your customers. This greater engagement can lead customers to become brand ambassadors as a result of feeling a closer connection to your organization.
- Customer service
-
Social media sites can provide an effective incremental channel for customer service departments, enabling them to become aware of customer issues that they might not otherwise hear about. While this may not seem like an SEO concern, it can enhance the brand building efforts of your company. People who are able to see a proactive and effective customer service effort by a company learn to value their relationship with that company even more. In fact, many of today’s consumers expect a rapid response time to any complaint they make via social media. Failure to meet this expectation can actually be harmful to your brand.
- Viral impact
-
Once an audience feels closely engaged with a company, their willingness to spread the word is greatly enhanced. Customers who feel a strong affiliation with a brand are more likely to help spread the word on new offerings or promotional programs to others in their network.
- Link building
-
Publishers with a strong following on a social media platform can release new content on their websites and then announce it through their social media accounts. This can lead to links to the new content and is an effective way to build deep links to the site.
- Citations
-
As discussed earlier in this chapter, links in Facebook and Twitter are counted by search engines, but it is also likely (though not confirmed) that brand mentions are also valuable. As search engines look for ways to measure how much they trust a brand, one metric they might use is how many times that brand is referenced across the Web.
- Brand search generation
-
People who learn about a brand and first become engaged with it through a social media presence may later choose to generate a search query on that brand. As with citations, a large volume of actual brand searches is a strong signal of prominence.
There are a large number of social media platforms, and you can waste a lot of time if you chase them all. Here is a brief commentary on the major players that can help you with the promotion of your website:
-
Facebook is the largest of the social networks, with worldwide usage over 1.2 billion users.5 This represents more than 10% of the total world population. Facebook has the largest audience and is certainly worth including as a key part of your social media strategy. In the US, more than 7 out of 10 Internet users are using Facebook. In addition, Facebook’s advertising platform provides highly granular targeting, as is discussed more in the section “Paid social media” in Chapter 7.
-
As of June 2014, Twitter reported 255 million active users.6 The user base may be smaller than that of Facebook, but it certainly includes a large number of influencers who can help create visibility for your organization. Twitter remains skewed toward male users, with nearly 50% more men on the platform than women.
-
As of April 2014, LinkedIn had more than 300 million members worldwide,7 making it a powerful social network. You can use it to build a strong network of connections, and paid versions of the service allow you to use its InMail functionality to send unsolicited emails (in very limited volume) to members, which, if done judiciously, can help you initiate new relationships with influencers of interest.
- Google+
-
While Google+ reports that it has 540 million active users, external research shows that about half of these do not actively use the social network.8 However, 270 million or more active users is still a significant number.
-
Instagram reportedly has over 200 million users, and is growing fast. Piper Jaffray reports that it is the most important social network among teens.9 Instagram is designed from the ground up as a mobile experience.
-
Pinterest may be quite a bit smaller than the previous platforms, but it is a growing network with 70 million reported users.10 The network skews toward a female demographic, so if that is your target market, it could be a great platform for you to focus on. It’s considered a highly “immersive” media in terms of time spent in the app and numbers of boards built per person. The audience on Pinterest is still US-centric.
- YouTube
-
YouTube can be thought of as a search engine, but it is also a social network. People love to share videos and do so in volume. YouTube also has a very large audience, with 159.1 million unique viewers per month as of December 2013.11
-
WhatsApp is a cross-platform mobile-messaging app that positions itself as a cost-free alternative to SMS communications. WhatsApp is the number-one mobile messaging app based on a survey of 3,759 users across the United States, China, Brazil, South Africa, and Indonesia.
There are many other social sites worthy of consideration. These include:
-
Specialized sites (e.g., Vine and Snapchat)
-
Q&A sites (e.g., Yahoo! Answers, StrackExchange, Quora, Formspring, and ChaCha)
-
Document sharing sites (e.g., SlideShare, DocStoc, and Scribd)
-
Local business sites (e.g., Google Local Business Center, Yelp, UrbanSpoon, YellowPages, CitySearch, and TripAdvisor)
-
Bookmarking sites (e.g., StumbleUpon, Delicious, and Trunk.ly)
-
Vertically focused social sites—as may apply to specific vertical markets (for example, there is a knitting social site at http://www.knittng.com, so there may be a social site specific to your vertical market)
Monitoring, Measuring, and Improving Social Media Marketing: Best Practices
While search engine optimization and social media marketing are two distinct practices, the influence of social media behavior on search results is, and will continue to be, important to consider. This section will explore some basic aspects of how to optimize your efforts in the social realm to help your SEO.
Social media networks all operate as communities. In reality, each network is a community of communities. No individual interacts with an entire network. Each user finds his “tribe” of followers and following. Even within those groups, there will be tighter “inner circles” of people and/or brands that get the most interaction and attention from a user.
The structure, rules, and methods of interaction may vary, but a social media network’s primary focus is to create and foster relationships. For example, you may think of YouTube as a video site, but a better label for it would be a video-sharing site. Social network sharing is done with the ultimate goal of attracting and engaging a following. People aren’t on social networks to broadcast into a void; they want to feel that they are being heard and that their content has meaning for others.
Effective use of social media results from fostering relationships that build your brand’s reach, authority, and trust. Try to avoid seeing it as a broadcast, advertising, or even direct-selling medium. Even with brands, social media users want authentic engagement. They will resist being sold to. But handled properly, social media provides an excellent opportunity to build positive associations, so that when prospects are ready to buy, your brand is top-of-mind.
The key to success in any community is to be a contributor. You must put something into it to get anything back out of it. This requires authentic participation, as little value accrues to those who participate in an artificial way.
Find ways to contribute content, information, and opinions to discussions. Using Twitter as an example, one approach is to start your day by reviewing the daily news related to your market space, pick out the content you consider the most valuable, and share those items with your following. Another approach is to offer valuable tips on a regular basis. A third approach is to be known for controversial opinions, but be aware of the impact this may have on your brand. Bring a unique viewpoint.
However, if you only share content, whether your own or curated from other sources, you will always be limited in how far your influence will extend. Remember that people are on social media, at least in part, to be affirmed—to feel that they matter to others. For that reason, you should dedicate some time each day to engaging with the posts of others. Offer constructive, helpful comments and replies. Don’t just say “great post!” but explain specifically what you liked about it, or contribute information or insight on the topic. Not only does this endear you to the person whose content is the recipient of your comments, but others seeing the conversation may follow you because of your helpfulness and knowledge.
Overall, focus on building your credibility and authority. These are key elements to success in a social environment. Once people accept you as a legitimate participant, the doors will start to open for you.
Even if you are a novice (a.k.a. “noob”) in your market area, you still have something to offer. The experts can learn by watching how you learn as you gain experience. Sometimes just posting a really good question can be as valuable as providing a great answer. Such engagement brings a surprising amount of value to the community, and if you can also bring some personality into the process, people will try hard to help you and will want to engage with you further.
As a publisher, there will also likely be times when you want to put something out there that is self-promotional. This is fine as long as you don’t do it with all your communications, and make certain that you do it in an engaging way. You earn the right to occasionally self-promote by being considered a valued contributor to the community.
Claiming Key Profiles
Make sure to claim your brand/profile at key social sites. Services like Trackur and Radian6 allow you to monitor the use of your brand across a wide array of social sites. You will want to set up a brand presence on each social media platform even if you don’t intend to use a network yet, in part to prevent your name from being taken by impostors or “squatters” (those who claim brand name profiles in hopes of later selling them to the actual brands). Here are some of the sites where you should create a brand profile for your organization:
-
Facebook
-
Twitter
-
Google+
-
LinkedIn
-
YouTube
-
Pinterest
-
CrunchBase
-
About.me
-
Instagram
-
Tumblr
-
SlideShare
-
reddit
-
StumbleUpon
-
Delicious
-
StackExchange
-
Google Places for Business
-
UrbanSpoon
-
YellowPages
-
CitySearch
-
TripAdvisor
Use NameChk.com to rapidly see if your name is available across a wide range of social sites. Note that this does not mean that you should plan on building an active presence on all of these sites; for most companies, that’s unrealistic. However, claiming the profiles will prevent other people from implementing profiles with your brand name on any of these platforms.
Deciding on a New Social Network
When you first consider engaging in a new social network, it is hard to be sure what return on investment (ROI) you will get for your efforts, and what you will need to commit to get that ROI. It’s a good idea to start your efforts with an experimentation cycle designed to help you determine what you will be able to get out of it.
A word about ROI in social media: remember that social media is primarily for reach, branding, and trust/authority building. Therefore, the best measurement for return on social media efforts probably isn’t sales—at least, not directly. Measure your effectiveness in social media by metrics like followers, engaged followers (which is actually more important than raw follower numbers), engagement per post, increased positive brand mentions, and increased traffic to your site.
Here are some suggestions on how to set up experiments with various social networks:
- Hypothesize about a site’s potential value.
-
Are the audience demographics a fit for what you want to accomplish? Is the medium one that you effectively utilize? For example, you would not want to consider YouTube if creating/sharing videos does not make sense for your organization. Take the time to consider these and other questions that affect the site’s potential value to you before getting started.
- Research what networks are being used by your competition.
-
Lack of competitors on a particular network is not necessarily a red flag. There may be an opportunity for you to lead the way in your niche on that network, if you can develop strategies to either find or develop an audience there.
- Set up social media and analytic tracking systems to measure.
-
When you first start out, your returns will be much lower than they will be in the long term as your credibility in communities builds, but even early results can help guide you on what is most effective. We will discuss this more in the section “Tracking Social Media”.
- Create an account and invest a few hours in participating.
-
If the network has search, try different keywords to find people, groups, and communities discussing topics relevant to you, and start engaging in those posts and creating your own. This will help you test your hypothesis about the value. A few hours will not be enough time to start seeing any ROI, but it should help you better qualify whether the community has the potential to work for your organization.
You won’t really know the effectiveness of a network until you start getting an engaged following there. The best way to gain real followers is to seek out people and communities within the network who are relevant to your vertical, follow them, and begin engaging with them. People are more likely to follow you back and/or recommend you to others when you do this.
- If this initial test goes well and you still believe that the social network may be a good investment, go a little further with it until you see some results.
-
At that point, step back and consider the return on the effort so far. Be aware that your ROI should continue to increase as your credibility and authority build, but this will give you an initial idea of what may be possible.
- Reach out to some of the more authoritative people using the network to get a sense for the types of returns they are seeing.
-
While this information will probably be qualitative rather than quantitative in nature, it can help you learn what types of ROI might be possible.
- Compare the potential ROI, including the potential long-term value of the connections you can develop on the network, with other ways you could invest that same time and energy.
-
Keep at it if it looks like a high-value channel, and drop it if it doesn’t and try something else!
Tracking Social Media
In the world of social media, there are several key metrics we’re interested in tracking:
- Traffic data
-
How many visits and visitors did social media drive to our sites?
- Fan/follower data
-
How many people are in our various networks and how are they growing?
- Social interaction data
-
How are people interacting with, sharing, and resharing our content on social networks?
- Social content performance
-
How is the content we’re producing on social sites performing?
Getting the right metrics to answer these questions requires segmenting by network. Not every question will have direct answers in the data, so you may need to make assumptions or inferences. Buzzstream and Klipfolio are examples of popular tools for tracking social media performance.
Facebook offers a relative wealth of data through its built-in product for brand pages, Facebook Insights. For example, you can see likes, post reach, and engagement (as shown in Figure 8-21) or the demographics of your fans (as shown in Figure 8-22).
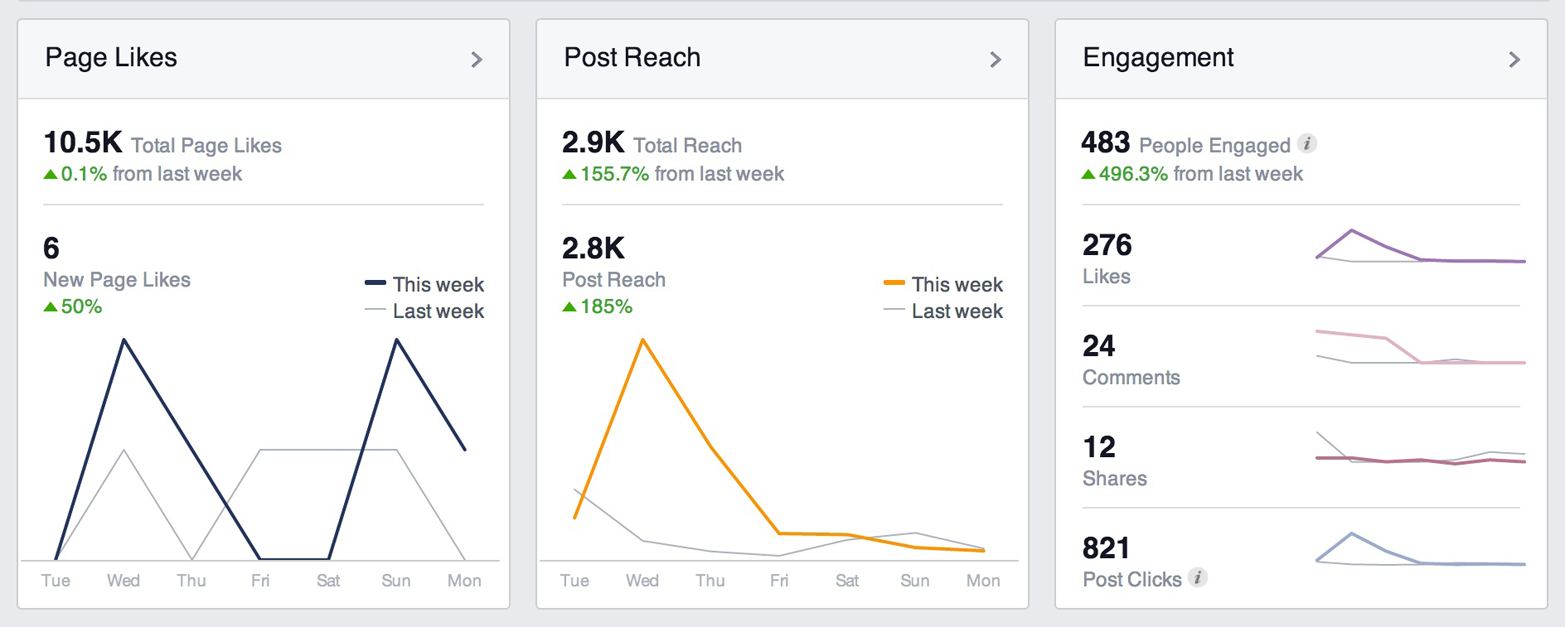
Figure 8-21. Facebook Insights dashboard
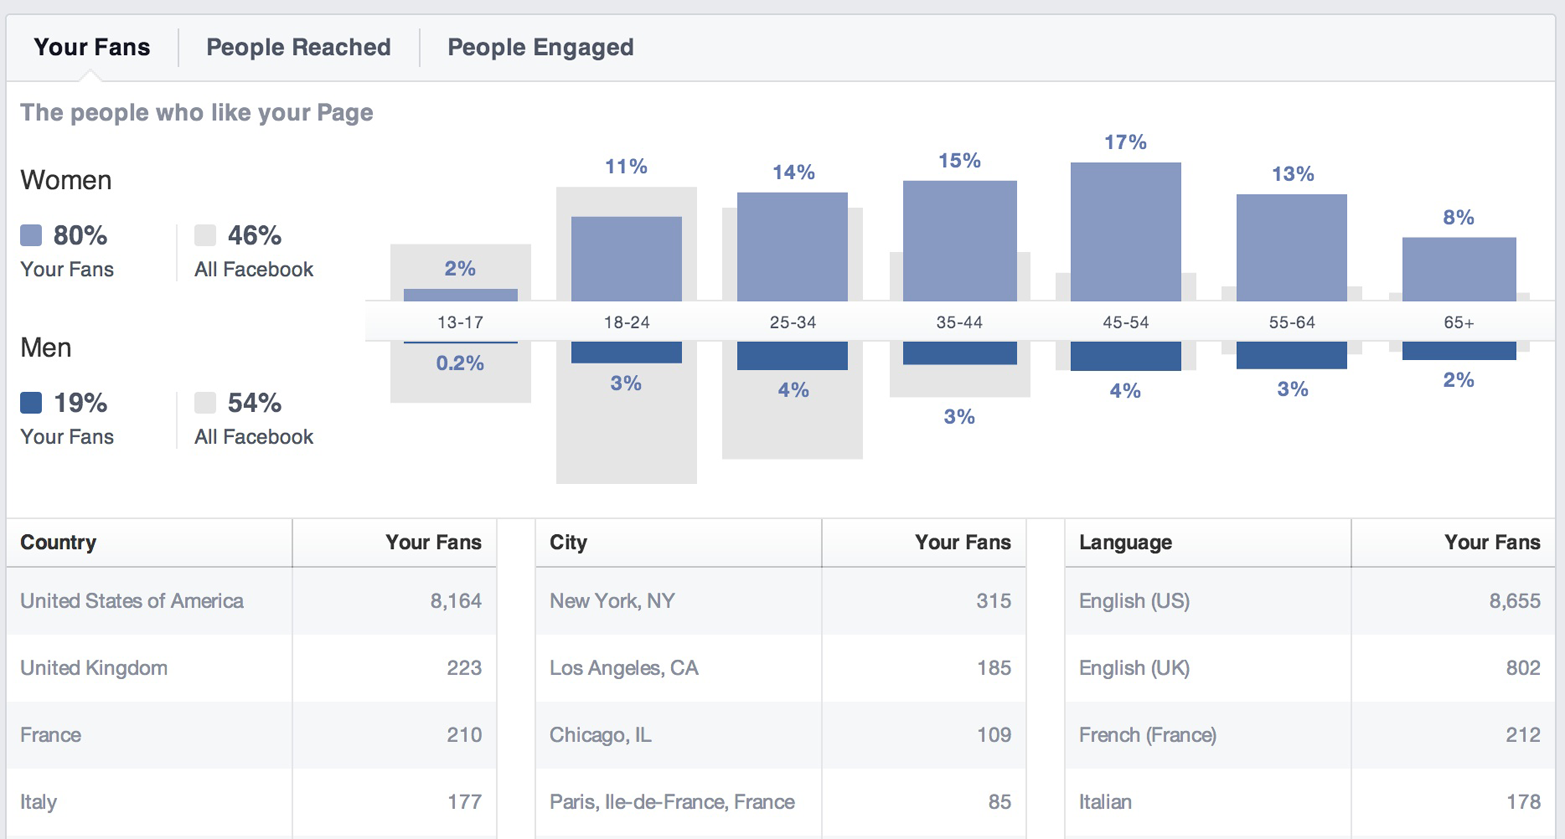
Figure 8-22. Facebook Insights demographics
Insights also has a very unique and powerful feature: integration on your website. Using a small bit of JavaScript code, you can embed the Facebook Insights functionality on your site and receive information about all the users visiting your pages who are logged into Facebook.
More information on Insights can be found at:
Twitter and Facebook are likely to be the largest two social networks for referring traffic to most sites (although a Shareaholic study shows LinkedIn and Google+ drive more engaged visitors; see http://bit.ly/google_plus_linkedin).
Twitter now provides limited analytics. For more detail, you should look into third-party social analytics tools.
The key metrics on Twitter are:
- Followers (and follower growth over time)
-
The unique number of Twitter users who’ve “followed” your account, as shown in Figure 8-23.
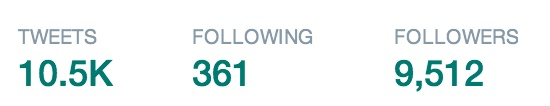
Figure 8-23. Twitter followers
- Active followers
-
The number of followers who’ve logged into or used a feature of Twitter in the past 30 days (those who have not are likely inactive or nonhuman accounts). This data is challenging to get, and requires software that runs through your followers and determines which are actively using via the API. Some of the third-party tools discussed momentarily will show this information.
- @ Replies
-
The number of tweets sent that begin with your account name. An example is shown in Figure 8-24. These are seen only by the mentioned account and anyone who follows both sender and receiver.
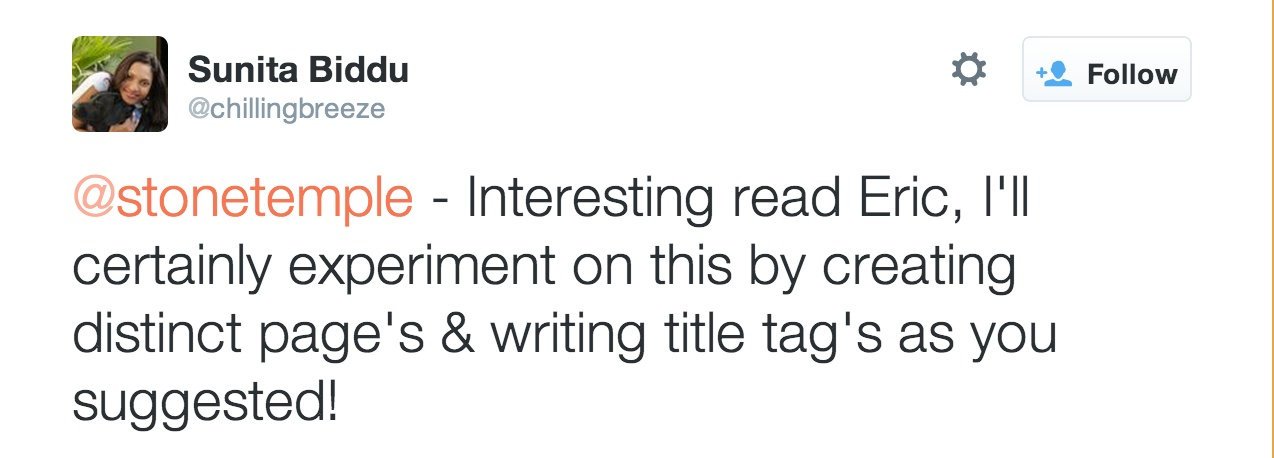
Figure 8-24. Tracking Twitter @Replies
- @ Mentions
-
The number of tweets sent that include your account name (@ Replies are also @ Mentions). Figure 8-25 shows a tweet that includes Rand Fishkin’s account name, but uses it inside the tweet rather than at the beginning. This means others on Twitter can see the tweet by default, rather than only those who follow both accounts.
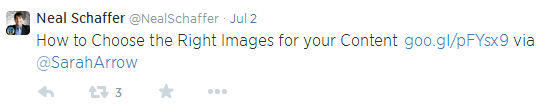
Figure 8-25. Tracking Twitter @Mentions
- Brand mentions
-
Tweets that contain the brand/account name but don’t use the @ symbol. An example is shown in Figure 8-26.
Figure 8-26. Brand mentions in Twitter
- Domain/URL mentions
-
The number of tweets that include a link that contains your brand name/domain name. An example of this using Moz is shown in Figure 8-27. These now include, by default, any shortened URL that contains the brand/domain name, as Twitter automatically parses the final destination URL for matches to the query.
Figure 8-27. Tracking Twitter domain/URL mentions
- Direct retweets
-
The number of retweets (using Twitter’s native retweet button/functionality) of tweets you’ve posted that have appeared on the service, as shown in Figure 8-28.
Figure 8-28. Tracking Twitter retweets
- RTs and vias
-
The number of tweets that contain an RT or via of your account (see the example in Figure 8-29). These are similar to direct retweets, but aren’t necessarily counted by Twitter’s automatic RT system because they modify the original message and appear to come from a unique source. Some users indicate a modified retweet with MT.

Figure 8-29. Modified RTs (MTs) in Twitter
- Best performing content
-
The content you’ve shared on Twitter that has earned the most clicks, retweets, and shares. This is now available in Twitter’s own analytics, but some third-party tools give deeper analysis.
- Direct traffic + non-Twitter.com drivers
-
Sources that have sent traffic to your site via Twitter’s ecosystem, even if they come from desktop clients or other third-party software sources. See Figure 8-30 for an example. As of 2011, these show up (mostly) as coming from T.co (Twitter’s link shortener), although some third-party link-shortening services, such as bit.ly, have their own analytics for clicks on links you create through them, even if Twitter publicly changes them to t.co links.12
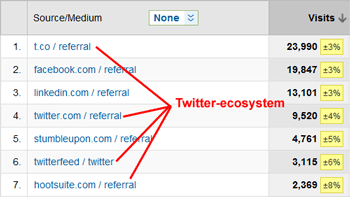
Figure 8-30. Tracking Twitter traffic
It’s often said that in analytics, nothing is worth tracking unless it can be used to take action and improve. For the preceding metrics, the primary actions you’re tracking are ones that relate to you. The key to taking better actions is comparing successful interactions, tweets, and content against less successful ones to determine what has the best impact on growing your audience, bringing visits to your site, and eventually, driving conversion actions.
LinkedIn functions like a hybrid of Twitter and Facebook. Connections require acceptance from both sides, but public entities (like company pages) and groups can be followed.
LinkedIn used to be known primarily as a sort of online address book of your business connections, and a place for job hunters to post their résumés. Recently, though, it has made major strides to reinvent itself as a true social network. Users now get a Facebook-like news feed of content and conversations shared by people and companies they are linked to.
In early 2014, LinkedIn opened up its Publishing platform, formerly reserved to handpicked “influencers,” to all users. Publishing allows users to create bloglike content that gets pushed out to their connections and followers. Other users can now follow the Publisher content of anyone else without having to first gain a reciprocated connection with the author. These changes have made LinkedIn a much more significant player in the social media influence-building arena, especially for B2B concerns.
You can also leverage LinkedIn groups to develop your visibility and build new connections. You can use LinkedIn search to find relevant groups that show active participation. Review the group rules to make sure that some are at least in place, and being enforced. It’s best to find those that appear to have active discussions taking place.
You can also reach your target audience on LinkedIn using direct sponsored content, which can be a powerful supplement to your content marketing efforts.
Like Facebook, LinkedIn has some built-in analytics for businesses as well as individual profiles, and lots of data points that are useful to track, including:
- Company page reach and engagement
-
You can track the number of times your company’s LinkedIn profile and its shared content have been viewed over time and the quantity and types of engagements earned. An example of this is shown in Figure 8-31.
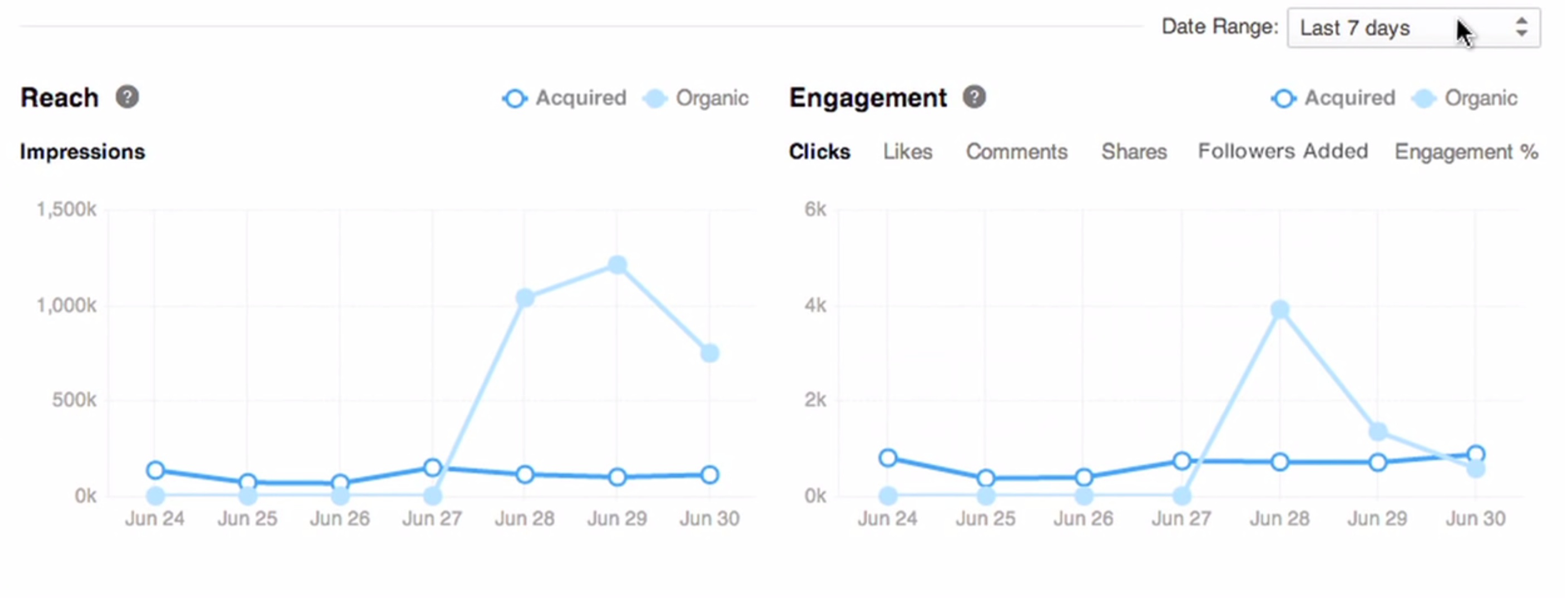
Figure 8-31. LinkedIn reach and engagement
- Followers
-
As with Twitter, individuals can “follow” a brand account on LinkedIn and receive status updates in their “updates” stream. Figure 8-32 shows stats for followers of a LinkedIn account. The more followers you have, the greater your ability to reach more people on LinkedIn with the content you share there.
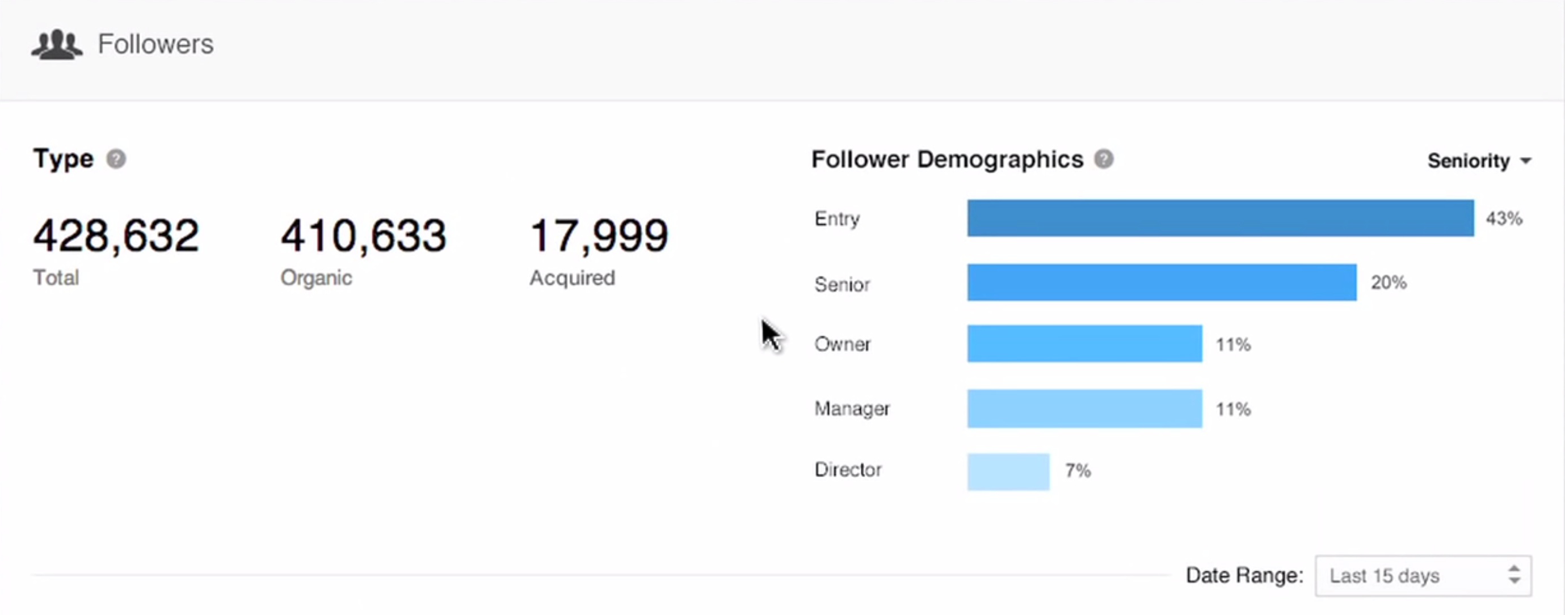
Figure 8-32. Followers in LinkedIn
- Connections
-
The number of unique connections for an individual profile on LinkedIn is a worthwhile metric to track, but unfortunately, all that is available as of July 2014 is the raw, current count (as shown in Figure 8-33) and who those connections are.
Figure 8-33. LinkedIn connections
- Messages, invitations, and notifications
-
Figure 8-34 shows the status bar at the top of a LinkedIn page. The number on the envelope shows unread messages and unreviewed connection invitations, while the number on the flag represents unviewed news stream updates and other updates, such as people viewing your profile or commenting on one of your updates.

Figure 8-34. LinkedIn messages, invitations, and updates
- Profile views
-
You can see how many people have looked at your profile over time, along with some data about who they are (only paid “Pro” LinkedIn accounts can see the identities of all profile viewers). Figure 8-35 shows an example.
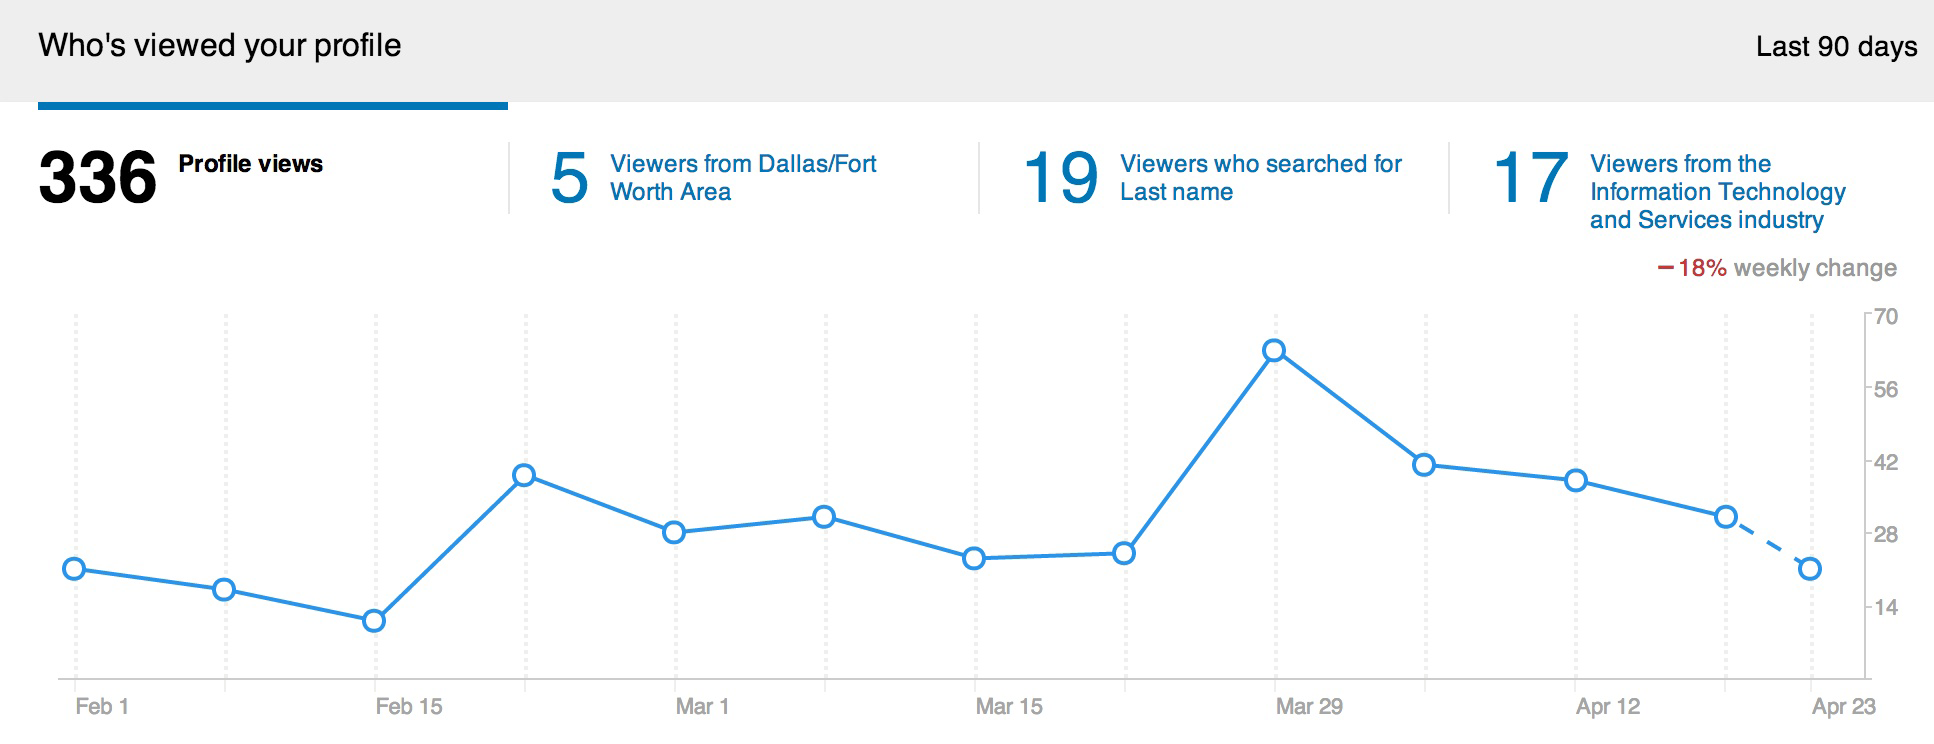
Figure 8-35. Profile views on LinkedIn
- Top keywords and referral sources
-
This list shows you the top keywords that LinkedIn users searched for prior to discovering your profile, and where they came from to get to your profile, as shown in Figure 8-36. (Again, only a limited amount of data is shown unless you have a paid account.)
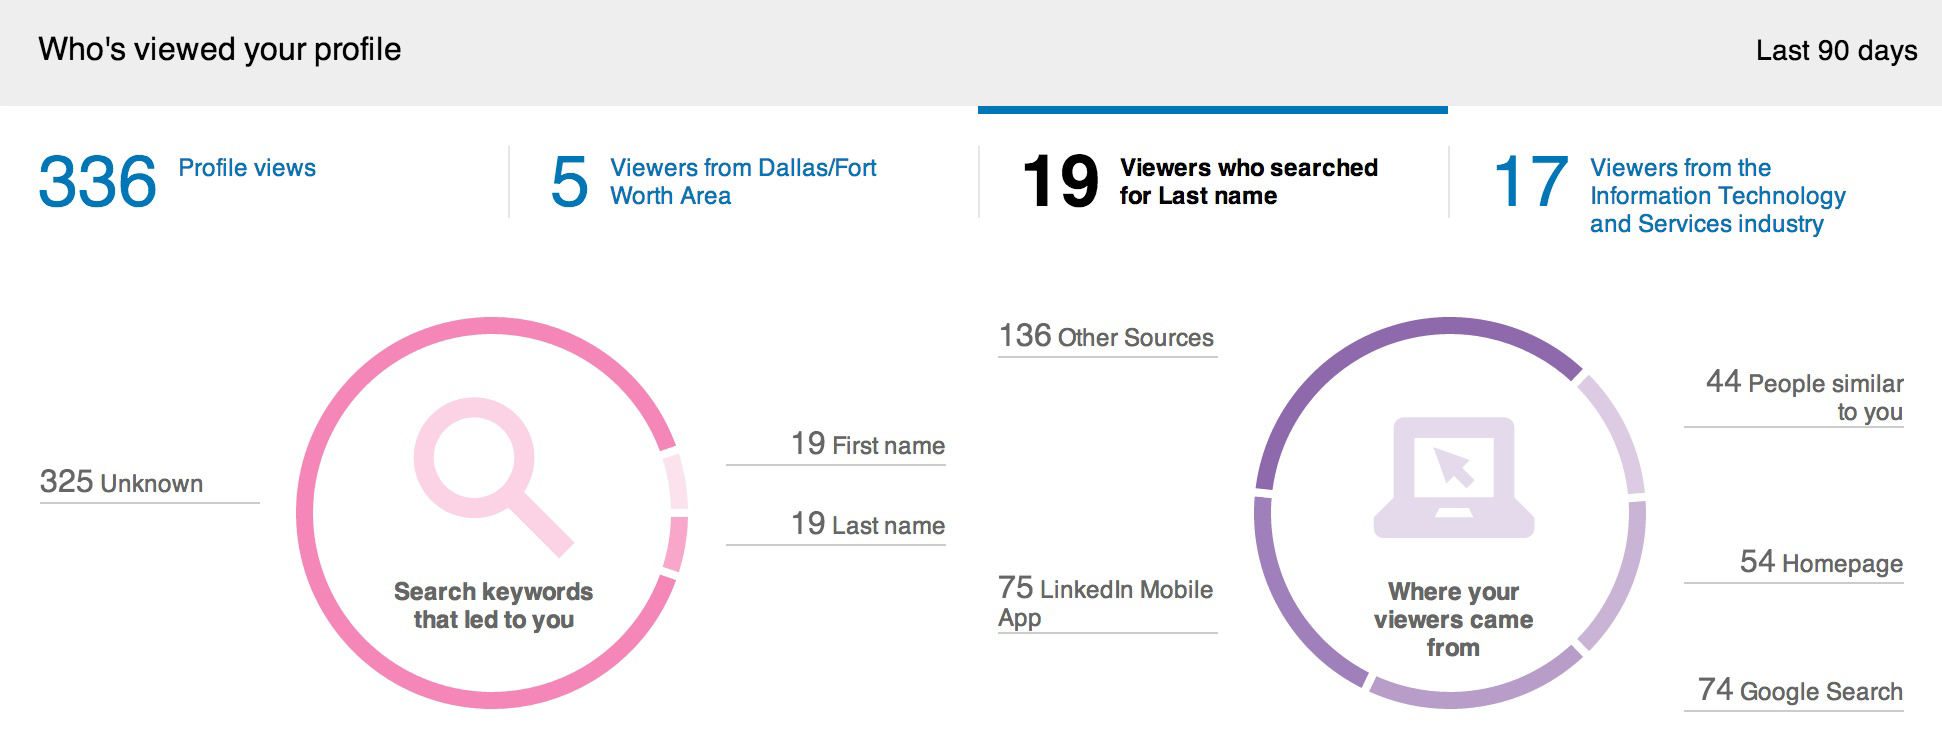
Figure 8-36. Keywords and referral sources on LinkedIn
- Content shares
-
As of July 2014, there is no way to measure or record the number of regular status updates/shares you’ve sent out over LinkedIn, nor the number of “likes” you’ve received on the service.
- LinkedIn Publishing
-
LinkedIn Publishing allows users to create original content with images, links, and formatting, which is then pushed out to their connections, followers, and possibly beyond. Other users can follow someone’s Publishing content without having to make a two-way connection. LinkedIn Publishers get some rudimentary metrics, such as number of views, likes, and comments for each post, as well as information on followers.
- Traffic
-
LinkedIn isn’t a huge traffic driver for most sites, but for certain B2B sites, it can be relatively substantial and the quality is often higher than other social sources. Figure 8-37 shows a screenshot from a Google Analytics account.
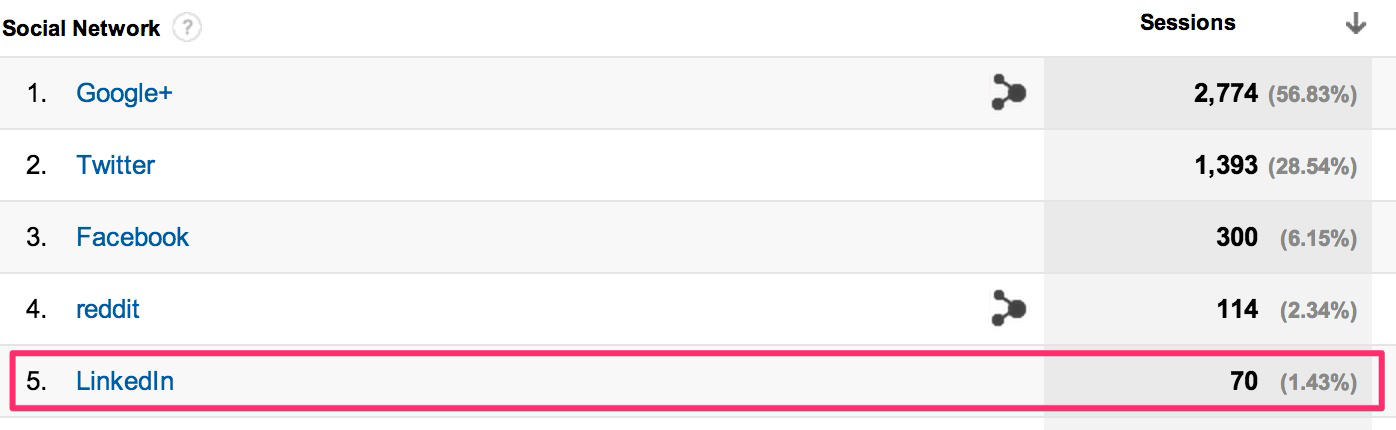
Figure 8-37. LinkedIn traffic
Few third-party tools exist to help with LinkedIn metrics, but over time, some of the tools for Facebook and Twitter may expand to LinkedIn.
Google+
Google’s social network is still relatively young, but at least three factors make it worthy of marketers’ attention:
-
The network’s rapid growth, especially in the global market (some estimates now make it the second largest social network, surpassing Twitter and second only to Facebook).13
-
The integration of Google+ into some of Google’s products and services—former Google Vice President for Social Vic Gundotra has called it “the next version of Google” and “the social layer of Google.”14 Google has since backed away from integrating Google+ into all of its services.
-
The influence of Google+ on Google search, particularly in the area of personalized search.15
Google has promised analytics for pages and profiles, but as of this writing those still aren’t available. However, several third-party tools have gone a long way in delivering the needed metrics. Among these are CircleCount, SteadyDemand, and NOD3X. The latter is a sophisticated tool for in-depth analysis of follower engagement, reach, and influence.
Significant metrics on Google+ include:
- Number of followers
-
On Google+ “followers” are people or pages who have you or your page in at least one of their circles. You can see the number of followers on a profile or page, as shown in Figure 8-38 (if the profile or page owner has made followers visible in settings, that is).
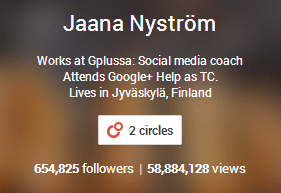
Figure 8-38. Google+ followers and views
- Views
-
View counts are new as of April 2014, and are displayed on the cover image of profiles and pages that have not opted out of their display in settings. The view count is an approximate total of all profile views, post impressions, and image impressions since October 2012. For more on what comprises views and what this metric might mean, see “New Google Plus Views Count: Important Metric or Vanity of Vanities?”.
- +Mentions
-
On Google+ one user links to another by typing a “+” and then the user’s name. This creates a link to the mentioned user’s profile, and also sends that user a notification that she has been mentioned. As of April 2014, Google+ does not provide a count of these mentions, but some third-party tools do. You can view all your recent mentions by clicking on the Mentions tab. Figure 8-39 shows an example.
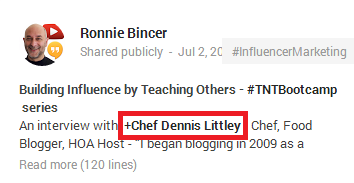
Figure 8-39. Name mentions on Google+
- Brand mentions
-
As shown in Figure 8-40, you can find recent mentions of your brand through the Google+ search, using the Everything filter tab and changing the view from “Best of” to “Most recent.”
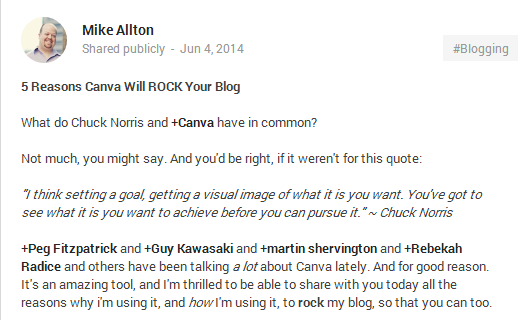
Figure 8-40. Brand mentions on Google+
- Content shares, content +1s, link shares, link +1s
-
You can view recent shares of links to your own site on Google+ in Google Analytics under Acquisition > Social > Data Hub Activity, with Google+ as the selected network. Clicking the More button to the right of any Google+ page share allows you to filter for all shares of that link, and to view the Google+ Ripples for that link (Ripples are a graphic representation of all the public shares of the link on Google+). You can also view the number of posts, reshares, +1s, and comments for any link to your site that was shared on Google+ by navigating in Google Analytics to Acquistion > Social > Landing Pages, and then clicking the desired link. Next select “Google+” and then change the Primary Dimension to “Social Network and Action.” See Figure 8-41 for an example.
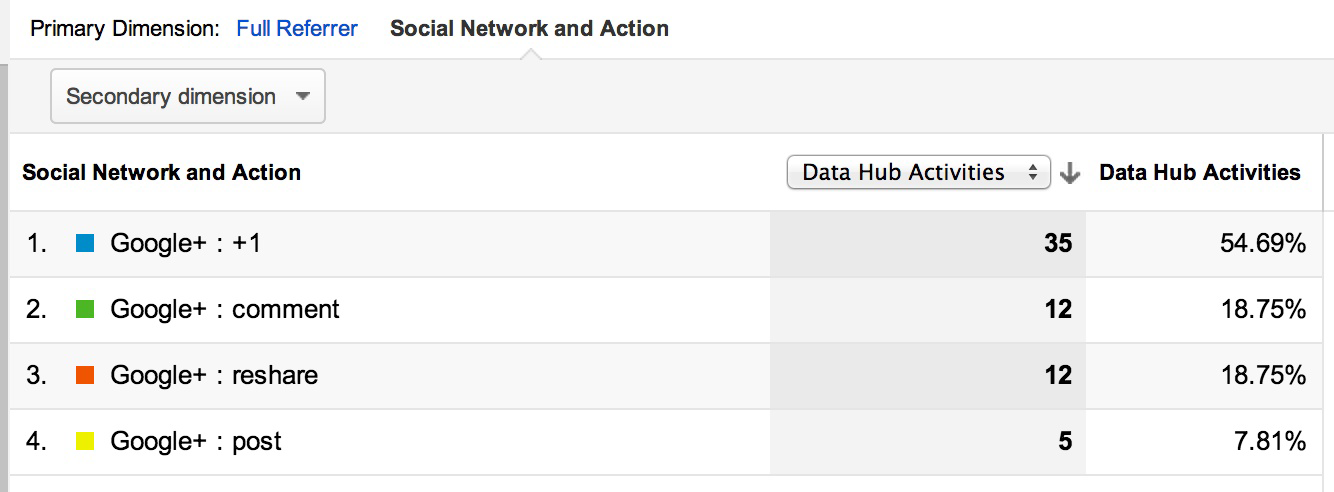
Figure 8-41. Google+ site link activity in Google Analytics
- Traffic
-
Google+ can become a major site traffic driver for brands that develop an active following there. Figure 8-42 is a screenshot of traffic from Google+ as shown in Google Analytics.
Figure 8-42. Traffic from social networks in Google Analytics
Perhaps due to privacy issues, Google+ uses a single referring URL for all traffic, helping to consolidate the data in analytics reports, but making it frustrating to determine which shares/users/links sent the most, or most valuable, traffic.
Instagram, StumbleUpon, Quora, Yelp, Flickr, and YouTube
Depending on the quantity and value of the traffic that other social networks send, there may indeed be additional metrics worth tracking. Sites worthy of consideration are Instagram, Pinterest, StumbleUpon, SlideShare, reddit, and Quora. These are likely worth some investment on the metrics and effort front, and if small quantities of contribution/participation yield large returns, more investment is likely warranted.
Blogs and forums
The world of social media started out as one where discussion sites (forums, Q&A, bulletin boards, etc.) and the blogosphere reigned supreme. Eventually, the major social networks captured the hearts and minds of most users, but the reports of the death of blogs and forums have turned out to be greatly exaggerated.
Forums and blogs still hold rich opportunities for marketers. For example, Moz.com receives tens of thousands of visits each week from blogs and discussion sites of all sizes, and the site’s participation/interaction with those sources often yields fantastic results in referral traffic, mindshare, and links. Many brands do likewise, hiring community managers or evangelists to engage in the sites where industry topics are discussed, building up strong, recognizable profiles that help bring awareness and produce traffic and links.
Thus, as responsible inbound marketers, it’s our job to measure these channels and quantify their impact. Participation in blogs and forums can provide a lot of value, including:
- Site/brand mentions
-
Mentions of your site or brand name can help lead you to content and conversations worthy of engagement, and it’s often useful to track the quantities of those mentions (and possibly the sentiment as well) over time. Google Alerts and Mention are both potentially worth looking at to help you monitor these mentions.
- Links
-
Direct links are nice because they appear either in link-tracking tools like Search Console, Open Site Explorer, Majestic SEO, Ahrefs, LinkResearchTools, or directly in your web analytics (if they send any traffic).
- Traffic
-
A must-have for any inbound channel, visit tracking is the simplest metric here.
For any inbound marketing channel (social or otherwise) you are considering, you should use a process similar to that shown in Figure 8-43.
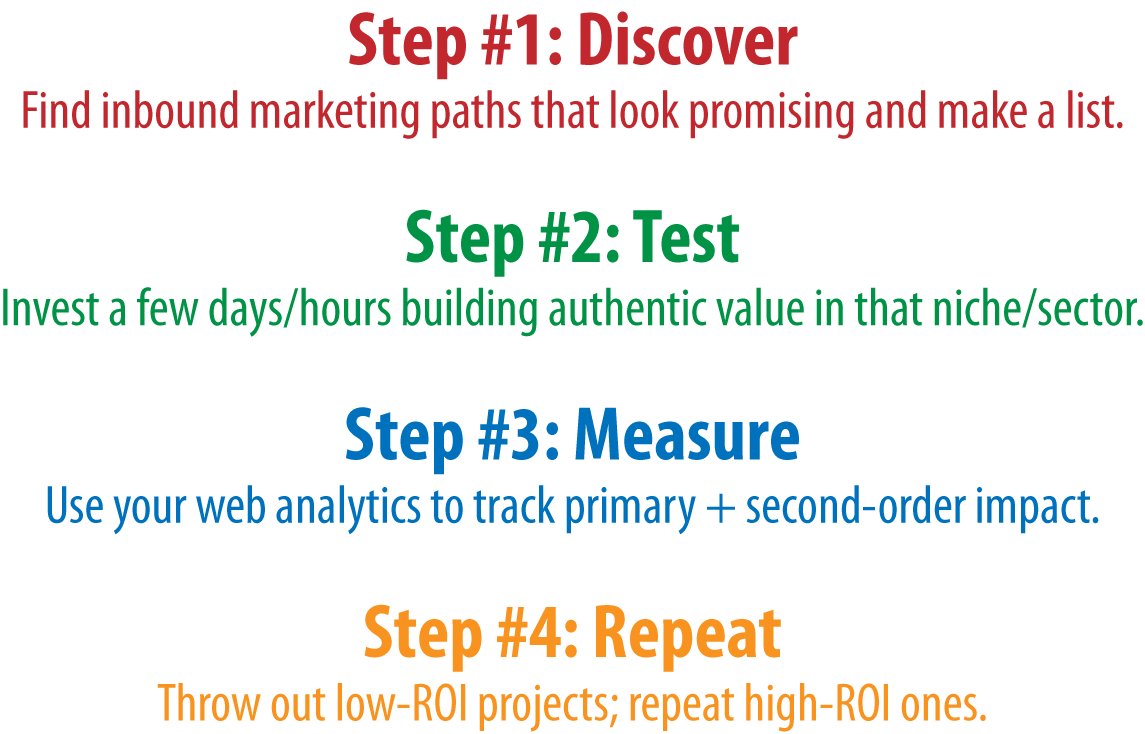
Figure 8-43. Process for identifying high ROI social networks
Losing a few hours to channels that don’t provide value is a small price to pay for the value of discovering and participating on those that do. You can see a presentation on a more in-depth process for evaluating social metrics in these two articles: “The Power of Inbound Marketing” and “Social Media ROI: How To Define a Strategic Plan”.
NOTE
A special thanks to Mark Traphagen for his contributions to this portion of the chapter.
User Engagement as a Measure of Search Quality
Measuring user behavior on a website can provide strong signals about that site’s quality. For example, if a visitor arrives at a site, visits 10 pages over the course of an hour, selects a product, adds it to her shopping cart, and then buys it, chances are pretty good that she found what she wanted there. Contrast that with the visitor who arrives at a web page and hits the back button of his browser in less than a second.
These are examples of user engagement signals, and search engines are beginning to use this kind of data in their algorithms. The specific signals they are using and how they’re using them is not easily discerned, however. Search engines are secretive about the details of their algorithms because they are important trade secrets, and because it makes a spammer’s job harder. However, we know that user engagement signals are useful in measuring search quality and may also be used as ranking signals. If a page is a poor result for a user’s search queries, then the user’s (probably very limited) interactions with that page will show it.
This section will examine the ways that the search engines can collect user engagement data, and the types of metrics they can collect. It should also be mentioned that in addition to the possible search result ranking impact of these signals, publishers should actively track user engagement metrics on their websites for a number of other reasons, including measuring the quality of the organic search traffic the site is receiving. Increased website engagement will result in increased conversion rates.
How Google and Bing Collect Engagement Metrics
Bing and Google both have a large number of data sources available to them. Some of the most important are:
- Search results
-
User interactions with the search results are a key source of data. For example, if the user conducts a search and chooses not to click on the first or second result but does click on the third, that can be a signal that the third result may be the best result for that query, especially if this is a common occurrence. Search engines accumulate data like this in high volumes every day.
- Browsers
-
Microsoft’s Internet Explorer and Google’s Chrome both have sizable market share and could be a rich data source for search engines (see “March 2014 Market Share” and “IE11 passes IE10 in market share, Firefox slips a bit, and Chrome gains back share”). Browsers are powerful data sources because they can monitor every action a user takes.
- Contextual advertising
-
Google AdSense and Microsoft Content Ads are excellent sources of data as well. These offerings allow publishers to place ad units on their websites and earn revenue when users click on them, and data is passed back.
- Toolbars
-
Surfers can install either the Google toolbar or the Bing toolbar in their browsers. These toolbars offer users a number of conveniences that improve their web surfing experience.
- Phone operating systems
-
Both Google and Bing offer phone operating systems. Determining phone OS market share is complex for many reasons, but an April 2014 TechRepublic article pegged Google’s Android OS as the #1 phone OS in the United States, with more than 75% market share,16 and the Windows Phone OS is forecast to grow its share over time.17
- Desktop and web-based applications
-
Microsoft Office is the dominant office productivity software suite worldwide. Links included in Microsoft Office applications can be tracked. Similarly, Google offers Google Docs as an office productivity suite, which operates entirely online.
- Buy data from ISPs
-
Both major search engines have the ability to buy usage data from ISPs.
- Google Analytics
-
Various studies show a range of market share statistics for Google Analytics. For example, one study showed 63% of the Fortune 500 companies use Google Analytics on their websites.18
- Goo.gl
-
Since December 2009, Google has offered a URL shortener.
- Internet services
-
Google offers free WiFi service to the city of Mountain View and offers Google Fiber to a growing number of U.S. cities. Google Fiber is already present or being installed in Portland (Oregon), San Jose, Salt Lake City, Provo, Phoenix, San Antonio, Austin, Kansas City, Nashville, Atlanta, Charlotte, and Raleigh-Durham.
- Email services
-
Services like Gmail, Outlook, and Hotmail (now integrated with Outlook) provide yet another data source.
- Payment services
-
Google Checkout, Google Wallet, and any mobile payment apps running on the Android OS are another potential source of data.
Potential User Engagement Signals
Each search engine has a rich array of data sources that enable it to measure a wide range of web surfer behavior. Here are some of the many signals search engines can extract from those sources:
- Click-through rate (CTR)
-
The search engines can measure the click-through rate on links presented in search results, on web pages in URL shorteners, in their browsers, and more.
- Clicks on other search results
-
Once a user completes a search and visits a link, a common behavior indicating a problem with a result is that she returns to the search results, often quite quickly, and then clicks on another result.
- New search generation
-
Similarly, a user may look at a given search result, come back to the search engine, and modify his search query.
- Bounce rate
-
Bounce rate is a measurement of the percentage of users who visit only one page on a website. Search engines extend that definition to take into account the user’s interaction with the search results. For example, if a user clicks on a search result, then returns to the SERPs and clicks on another result, that could indicate that the first result was not a good response for that search query.
- Time on page
-
Search engines can measure the amount of time spent on a given page using their browsers or toolbars. This is also referred to as dwell time, and more time on page might be considered signal of higher quality.
- Time on site
-
Similarly, time on site could be considered a positive signal if the average user spends more time on your site than she does on the sites of your competitors. Of course, it could also mean that your site is difficult to navigate or loads very slowly, so you’d need to look at this signal in conjunction with other signals.
- Pages per visit
-
This metric can be easily measured by the browser, a toolbar, or Google Analytics. More page views implies greater user engagement with the site; however, some sites seek to increase page views by paginating their content to generate more ad impressions. As with time on site, a signal like this is hard to evaluate on a standalone basis.
- Repeat visits
-
Do users return to the site? Return visits could also be viewed as a quality signal.
- Pages printed
-
While many pages on the Web do not lend themselves to printing, certain classes of pages do, such as reference articles, recipes, maps, and similar content. If a user decides to print a page, that indicates a higher level of interest in the content.
- Pages bookmarked in the user’s browser
-
If a user bookmarks a page so he can return to it later, that is also a positive signal.
- Scroll bar usage
-
Another relatively subtle indicator of engagement is whether the user scrolls down to see more of the content on a page.
Voting Mechanisms
Another set of signals that search engines can use involves voting mechanisms. These are methods by which users directly indicate their approval or disapproval of content. Here are some examples:
- Chrome Blocklist extension
-
On February 14, 2011, Google released a Chrome extension that allowed users to block specific websites from their search results. This was not used as a ranking factor in the initial release of Google’s Panda algorithm on February 24, 2011, but it was included as part of the second release of Panda on April 11, 2011.
- Google+ +1s and Google+ shares of content
-
As discussed earlier, the evidence does not support these data points being used as ranking signals just yet (other than for personalized search), but in the future they could be.
- Brand name searches
-
Another potential signal of prominence is a high number of brand name searches. For example, brands like Coca-Cola and Pepsi get searched on hundreds of thousands of times per month. This might make them better responses to generic search queries like cola than lesser-known brands.
- Brand mentions
-
A related concept is that of brand mentions. People reference brand names on the Web all the time—on web pages, in tweets, and elsewhere—without actually implementing links to the page of the brand’s website. While there is no documented evidence that search engines use this type of data, frequent brand references could be a strong signal.
Document Analysis
Document analysis is a somewhat different concept than user engagement, but it can be used to predict how users will perceive the quality of content on a site. Strong signals indicating a likelihood of poor-quality content could potentially be used as a ranking signal by the search engines.
Poor Editorial Quality
Poor spelling and bad grammar can indicate a lack of attention and care about the content. You must exercise care here, as user-generated content will not necessarily be checked for spelling or grammar. Publisher authored content that is not subject to quality editing, however, may indicate low-quality content.
Reading Level
The concept of reading level refers to the estimated grade level of the sophistication of the writing. One formula for this is known as the Flesch-Kincaid Reading Test, which measures the average words per sentence and the average syllables per word. It is actually not a measurement of the education level required to read the content; rather, you can think of it of as a measurement of the mental effort required to read a sentence.
If you want to check the reading level of a document, you can do so using the spelling and grammar checker in Microsoft Word. You can also configure Google’s Advanced Search settings to show the reading level for documents in the search results. This modifies the results, as shown in Figure 8-44.
There is no single reading level that is optimal for each business; it varies depending on the nature of the content a site publishes. For example, if you have a site targeted to children, then a younger reading level is appropriate. Contrast that with content on the latest advances in artificial intelligence algorithms, where much higher reading level would be expected.

Figure 8-44. Reading level shown in Google Results
Keyword Stuffing/Lack of Synonyms
Keyword stuffing used to be the basic approach of spammers back in the days when Alta Vista was the leading search engine. There are still many people who believe that repeating the same keyword over and over on a web page will lead to higher rankings for that phrase. They create documents that include way too many instances of the same word, and often don’t make much use of synonyms for the key phrase. This is an indicator of a focus on search engines and not users, and may correlate with lower-quality documents.
Ad Density and Offensive Ads
Search engines have learned that sites that have too many ads on them offer poor user experiences. These pages may result in high bounce rates, but in some instances it is also possible to measure this effect directly. For example, consider the concept of measuring the percentage of the portion of a page above the fold that is occupied by ads. Too high a density might be taken as a negative signal. Google also has a patent on detecting annoying ads and pages, which Bill Slawksi has written about in “How Google Rejects Annoying Advertisements And Pages”.
Sameness
An exact match search on “mortgage tips” returns hundreds of thousands of results, as shown in Figure 8-45. It is likely that, of those hundreds of thousands of results, there is very little variation in the content.
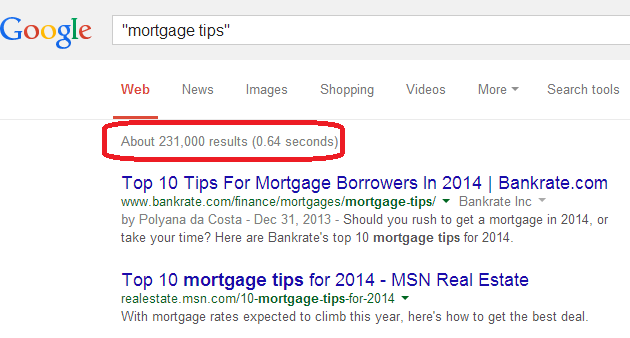
Figure 8-45. Search query returning hundreds of thousands of results
Broaden this concept to consider a site where the majority of articles are written about topics that many have written on before, and whose authors don’t really bring any level of authority to the topic or offer a unique viewpoint. Such a site may be lowered in rankings, as users likely want to see authoritative opinions from those they trust.
Page Speed
In April 2010, Google announced that a website’s page load time was now considered a ranking factor. However, Google has indicated that this affects only a small percentage of results (about 1%) and industry tests appear to confirm this, including the results of an investigation published by Moz.
The bottom line on page speed is that there are a lot of reasons why you should treat it as important, the biggest of which is the impact it has on conversion and bounce rates on your site. As an SEO factor, it is likely to have an impact on your results only if you have a particularly slow site. If that’s the case, the drive to improve your conversion rate should already be compelling enough to address the issue.
Optimizing User Experience to Improve SEO
There are many reasons to address the user experience on your site, including conversion optimization and customer retention. As we have seen in the sections “User Engagement as a Measure of Search Quality” and “Document Analysis”, SEO may also be impacted by the perceived user experience with a site. Measuring your site performance on these types of metrics can be a great start to improving the SEO performance of your website.
However, it is important to consider a broader question: What do your visitors want? If you are selling left-handed golf clubs, and you create a web page to rank on the search phrase lefty ping putters, what do you offer the visitors who come to that page from search? Reviews? Images? Videos? Putting tips? The ecommerce catalog front and center?
This is the most important part of optimizing a user experience. Creating a direct connection between the visitors arriving at your site, and what it is they are looking for. When you make this harder for them, metrics like bounce rate, time on site, and repeat visits will all suffer. When you make it easy, all of these metrics will improve.
One strategy is to survey your site visitors. If you don’t have a lot of traffic, consider using a PPC campaign to bring in a number of visitors and then get them to take the survey. Next, we outline a three-step process to create a survey to find out from people what they are looking for on your site.
Step 1: Build a Survey
Start with a short series of questions asking the survey taker to imagine he’s just performed the desired query. The basic structure is simple: request the top three content pieces your audience desires, then ask specifically about features that would make the page worthy of sharing (this is important, because it often differs substantively from what makes a page merely answer the user’s query).
Finally, you can ask him to actually do a search on the target query (you don’t want him to do it until the end, because what he finds might bias his responses) and report any results he liked, as these can provide additional insight.
Step 2: Send It to Your Customers/Potential Customers
You can find customers or potential customers virtually anywhere—among your friends, neighbors, coworkers, or social network connections, through existing SEO traffic or PPC campaigns, and so on. Anyone who fits your customer demographic or is creative enough to imagine herself as part of that demographic will work.
A link in the bottom of your email newsletter or a share on Facebook/LinkedIn/Twitter can often do the job, too. You might even try posting a link in a relevant industry forum or discussion group (so long as you’re sure it won’t be perceived as spammy).
Step 3: Record Responses and Leverage Them to Build What the People Want
Once you have your results, analyze them to see what you have. If you need things clarified, repeat the survey. It is better to do this than to act prematurely on incomplete or ambiguous data. Once you have built the site based on users’ feedback, measure the results you get. Don’t be afraid to go back and make more refinements, or even conduct another survey, to continue to educate yourself about what your visitors want.
Additional Social Media Resources
In this chapter, we have focused primarily on the interactions between social media and SEO. However, social media is itself a significant source of traffic. It deserves its own investigation and study. Here are some of the top resources available online to help guide you further into the world of social media:
Conclusion
While it does not appear that social media acts as a direct SEO ranking signal, except for personalized search and Google+, no one can debate that social media and user engagement have become significant factors for those practicing SEO. Links may still be the strongest source of signals to search engines, but these new factors are already an important part of the digital marketing landscape, and may gain additional weight over time as the search engines learn to use them better. Thus, a balanced SEO strategy needs to take into account social media, user data, and document analysis techniques.
In summary, brand publishers must seriously consider these four areas as a part of their web promotional strategy:
-
Participating in social media communities
-
Providing an engaging user experience
-
Offering unique and differentiated content
-
Building a brand
Finding the right balance of these areas is already important for publishers to improve their conversion and SEO results, and it will only become more important over time.
1 Danny Sullivan, “What Social Signals Do Google & Bing Really Count?”, Search Engine Land, December 1, 2010, http://searchengineland.com/what-social-signals-do-google-bing-really-count-55389.
2 Eric Enge, “Graph Search & Social Search With Bing’s Stefan Weitz,” Stone Temple Consulting, February 18, 2013, https://www.stonetemple.com/graph-search-social-search-with-bings-stefan-weitz/.
3 Rand Fishkin, “Using Google+ to Appear in the Top Results Every Time - Whiteboard Friday,” Moz Blogs, November 1, 2013, http://bit.ly/using_google_plus.
4 For the full discussion, see “The Future of Search With Danny Sullivan”.
5 Ami Sedghi, “Facebook: 10 years of Social Networking, in Numbers,” The Guardian’s Technology Datablog, February 4, 2014, http://bit.ly/fb_in_numbers.
6 See “Company | About”.
7 Kurt Wagner, “LinkedIn Hits 300 Million Users Amid Mobile Push,” Mashable, April 18, 2014, http://mashable.com/2014/04/18/linkedin-300-million-users/.
8 Claire Cain Miller, “The Plus in Google Plus? It’s Mostly for Google,” New York Times, February 14, 2014, http://bit.ly/plus_for_google.
9 Piper Jaffray 27th Semi-Annual Taking Stock with Teens Survey, Spring 2014, http://www.piperjaffray.com/private/pdf/TSWT%20Infographics.pdf.
10 Megan Ritter, “Market Your Brand to Pinterest’s Highest User Base,” Social Media Week, August 14, 2014, http://socialmediaweek.org/blog/2014/08/market-brand-pinterests-highest-user-base/.
11 Greg Jarboe, “Online Content Videos Break Record with 52 Billion Monthly Views,” Search Engine Watch, January 13, 2014, http://bit.ly/content_videos.
12 Tom Critchlow, “Twitter’s t.co Link Shortening Service Is Game Changing - Here’s Why,” Distilled, August 18, 2011, http://bit.ly/t_co_shortening.
13 Matt McGee, “Report: Google+ Now 2nd-Biggest Social Network Worldwide,” Marketing Land, January 28, 2013, http://bit.ly/google_plus_network.
14 Nick Bilton, Countering the Google Plus Image Problem,” New York Times, March 6, 2012, http://bit.ly/image_problem.
15 Mark Traphagen, “How Google Plus Profiles & Pages Gain Search Authority,” Search Engine Land, November 21, 2013, http://bit.ly/google_plus_search; Eric Enge, “Google+ & SEO: How Google+ Impacts Search Results,” Search Engine Watch, November 17, 2013, http://bit.ly/plus_impact.
16 Conner Forrest, “Apple v. Google: The Goliath Deathmatch by the Numbers in 2014,” TechRepublic, March 21, 2014, http://bit.ly/apple_v_google_2014.
17 Michael Blair, “Windows OS Phones Should Increase Market Share in 2014 and Begin to Rival iOS,” Seeking Alpha, March 6, 2014, http://bit.ly/windows_mkt_share_2014.
18 Charles Farina, “Google Analytics Solidifies Lead in Fortune 500 Adoption in 2013,” E-Nor, October 21, 2013, http://bit.ly/google_analytics_2013.
Social news sites
The two most well known social news sites are reddit and Techmeme.
As we covered in Chapter 7, reddit is a social link aggregation and discussion site, self-organized into topical, independently moderated communities (“subreddits”). There are millions of visitors each day, and reddit has hosted “ask me anything” interviews with many celebrities and a few politicians, including Barack Obama.
Articles posted on reddit can potentially receive a lot of search traffic, so it can be tempting to try to influence this process to help achieve your goals. However, this is a bad idea, because registered users on reddit (“redditors”) are very defensive of their platform, and quick to squash any attempts at manipulation or any commercial behavior.
Even trying to reach out to influencers on this platform will quickly draw a negative reaction, and can result in your being labeled as a spammer. Any attempt at solicitation runs a significant risk of your being downvoted, attacked, and/or blacklisted.
Still, there is a lot to be gained from reddit, but before you embark on such a campaign, spend some time at http://www.reddit.com/wiki/reddiquette, to learn the expected behavior on the platform. The best strategy for reddit is to try to participate normally and submit a lot of other people’s great content to the correct subreddits, and occasionally submit your own potentially viral content, without giving the appearance of self-promotion.
Techmeme is a site that provides a curated list of the hottest and most important tech industry news, and it does so on a single page. The site has a small team of editors who review what’s going on and decide what to post. The only way to suggest content to this team is via Twitter.