
CHAPTER ELEVEN
Tracking Results and Measuring Success
Because the nature of what SEO practitioners do is not clear to many people, the expert practitioner knows how important it is to establish quantifiable goals and demonstrate results. Expectation management is key, and effective communication of timetables for deliverables and improvements is crucial to the success of any SEO project.
Web analytics and other data-mining tools can provide a rich array of data that is invaluable to the SEO process. These include tools for discovering new links, finding long-tail search terms, determining the best links your competitors’ sites have, and more. All in all, a strong understanding of these tools will make you a better SEO practitioner.
However, thousands of tools are available, and it can be difficult to figure out which ones you need to use, which ones are merely nice to have, and which ones are not worth your time. It is a good idea to start simple and focus on establishing a baseline measurement of where you are before you begin your SEO efforts so you can better measure your results. A proper baseline should account for as many variables as are applicable to your business and industry—organic sales, indexing, crawl rates, conversion rate analysis, and so on.
In other words, you need to measure whether, and to what extent, you have been successful. The first thing you need to do is define the goal(s) of your site. Here are some possibilities:
-
Generating sales
-
Obtaining leads
-
Generating ad revenue
-
Getting people to read specific articles
-
Obtaining donations
-
Developing an audience (which can lead to the above)
These are all valid objectives that relate directly to the business. Missing from this list are practices such as measuring rankings, measuring the total number of links, and measuring the average cost per acquired link (organically obtained links still have a cost: the cost of the marketing campaign to get them). These other measurements may be interesting, but they are not the end goal.
Closely connected with the site goals are direct drivers of results. These include parameters such as:
-
Total site traffic (all visitors)
-
New versus returning visitors
-
Traffic to your most popular pages
-
Pages receiving the search traffic
-
Pages resulting in conversions down the line
-
Traffic per page and conversion per page
Measuring results in terms of the main business goal should always be the first set of metrics you put in place. From there you can diverge and look at other metrics that might help you diagnose problems with the site or give you additional insight into how to set up a campaign.
Why Measuring Success Is Essential to the SEO Process
Although quantifying deliverables and measuring progress are important for external reporting purposes, it is just as important for SEO practitioners to measure the efficacy of their own efforts to make timely adjustments as necessary. As you will see in this chapter, numerous tools are available to aid you in this process.
At the beginning of any SEO project, it is wise to establish baseline data points for the website. This includes the following:
-
Quantifying organic search traffic by search engine
-
Quantifying a breakout of what site content areas are getting the current organic search traffic by search engine
-
Quantifying data on conversions broken down by search engine
-
Identifying poorly performing pages
-
Identifying best-performing pages (in terms of traffic and conversions)
-
Tracking search engine crawler activity on the site
-
Determining the number of indexed pages
-
Determining whether the indexed pages are getting search traffic
-
Determining whether best-selling product pages are indexed and getting search traffic
-
Identifying 404 error pages and external sites linking to these pages, if any
-
Determining whether you’ve been hit by a search engine penalty or algorithm update
You cannot methodically improve what you cannot measure, or as Peter Drucker put it: “What gets measured gets managed.” Defining and mapping the path toward concrete goals are crucial aspects of the SEO process—and over time, these goals may change. Thus, it is also important to make sure the data you capture helps you understand your progress toward these goals.
In the world of web analytics, this is referred to as picking actionable key performance indicators (or actionable KPIs). The best data measurements are those that potentially result in an action being taken in response. Think of this as data-driven decision making.
It is important to recognize that SEO requires operating effectively within two distinct worlds. In the first, SEO-related metrics such as rank, visits, and backlinks rule the day; in the second—the one likely occupied by the rest of the organization—business metrics such as sales, costs, returns, and contract renewals are the focus. As an SEO practitioner, you should address both spaces by clearly tying SEO metrics to business goals.
The Tracking Cycle: Produce, Launch, Measure, Refine
In summary, the basic tracking and measurement process usually looks something like this:
-
Define an SEO strategy, determine an implementation schedule, and establish a clear understanding of goals. What are you going to accomplish, and what is the strategy for accomplishing it? How will you measure progress?
-
Discuss your strategy. The marketing and business development teams are your allies here—you want to ensure that your SEO objectives are based on the overall business and site objectives, both long- and short-term.
-
Establish a baseline. Now that you are about to start and you have decided how you are going to measure progress, establish a baseline by recording the current stats prior to beginning work. Make sure you don’t get a false baseline due to seasonal factors or some other unusual event. Comparing year-over-year data will usually eliminate fluctuation due to seasonality. However, you must also consider how changes in the market, new competition, elimination of competition, industry consolidation, changes in your business strategy, and changes in the search engines themselves may have affected that year-over-year data.
-
Proceed with your project. Implement the SEO strategy—new URLs, technical site changes, new content development, and so on.
-
Collect data. Collect the newest data for each metric you decided to focus on. SEO can take days, weeks, or months to show results, so make sure you wait long enough for your efforts to have an impact. Many factors could influence the length of time you should wait, including:
-
If your site is brand new, it may take longer for your changes to take effect.
-
If the scope of the change is drastic (such as a complete redesign incorporating new information architecture, new URLs, etc., versus a simple visual reskinning), it will probably take longer to see results.
-
Sites that get crawled at great depth and frequency will probably yield visible results faster.
-
Sites seen as authoritative may also show faster results.
-
-
Compare the baseline data to the new data. The new data has little meaning unless it is compared to your baseline. This is the time when you can really assess your progress.
-
Refine your campaign. Now that you have compared your old data with your new data, you can make some decisions. Is the campaign a bust? If so, abandon it and move on to the next one. The old business axiom “Fail quickly” applies here. The faster you diagnose a failure and move on to the next thing, the better.
If you are achieving great results—that is, a noticeable increase in traffic and/or conversions—then you’ve got a great process in place; apply it to more pages on your site, or look for ways to further improve conversions through content development and design. If you don’t see any change in your traffic or conversion rate (or if the changes are measurably negative) within a few weeks, don’t give up just yet. Perhaps you’ve overlooked something important, or there was an error in your implementation. Or perhaps you are recovering from a larger site overhaul. In this case, things may get worse before they get better. Be patient, and at this point of the process, focus on action-based goals instead of results-based goals. For very damaged or very large sites, the wait for improvement could be six months to a year.
Establishing a Proper Baseline
It might sound easy to record a set of SEO metrics before the start of the project and then compare the same set of metrics after 30, 60, or 90 days to measure the progress. But what if you don’t make any changes and the metrics reflect an improvement? What if the improvements are because of external business factors? How can your SEO project get attribution for its business impact?
Depending on the type of business, and assuming there have not been drastic strategic shifts from the previous year, it is possible to account for the seasonality of the business if you compare each period to the corresponding period of the previous year. Then adjust for overall year increase (or decrease). You can measure by comparing a couple of months year to year where you have not made any SEO changes. The assumption is that everything else being equal, a performance increase in search should be attributed to your SEO efforts.
It is important to make sure that there haven’t been any major strategic shifts in the business. Sometimes companies completely change the way they do business, and this dramatically impacts your ability to measure results. In cases like this, you can fall back to the less reliable approach of tracking the increase in pages getting search clicks and overall increase in average ranking across the board.
One other issue that may significantly impact your ability to establish a baseline for measurement is a seemingly spontaneous drop in traffic. When analyzing the organic traffic to a site, if you notice a large drop it’s vital to determine its cause before proceeding with creating a set of baselines and goals. Large traffic drops can be caused by a number of factors, including a large-scale site redesign or rebuild, a shift in the nature of the business as just noted, seasonal factors (which you can usually determine by looking at several years of data at a time), or organic search algorithm updates.
An extremely useful tool you can use in determining if a large traffic shift might be caused by an algorithm update is the Panguin (a concatenation of the words panda and penguin) tool created by Barracuda Digital. This tool allows you to overlay your Google Analytics organic traffic with Moz’s history of algorithm updates to see if traffic shifts coincide with the updates. It’s not always possible to definitively determine if you have been impacted by an algorithm update, as occasionally several updates happen over a very short period of time or you may have a traffic drop caused by another factor that happens to coincide roughly with the algorithm update. However, before you embark on an SEO project, it’s important to be aware of the possibility that an algorithm update may impact the potential success of the project.
It’s also important to monitor rank in Google to understand what is working in your strategy. For example, a jump from 99 to 15 on a targeted keyword might not bring you a substantial increase in traffic; however, it is a huge indicator that something you are doing is working. AuthorityLabs, a subscription SEO ranking tracker, offers a one-stop page for tracking all of the keywords your business is targeting as well as their shifts over time.
Using Analytics as a Business Case for SEO
You can use a properly structured plan as the business case for an SEO project. The way to do this is to express the target results of an SEO project in terms of financial impact. You could include a variety of metrics in a business case, such as:
-
Revenue
-
Lead generation
-
Margin
-
Branding value
-
Reach
-
Other action triggers (newsletter sign-ups, contact requests, demo requests, free-trial acceptance, viewing and/or sharing a specific piece of content, etc.)
Measuring such factors requires that you tie organic search engine visits to the revenue and other conversions that result.
Measuring Search Traffic
Classic web analytics data is an incredible asset to SEO. Here are three examples of ways to utilize this data for SEO purposes:
-
Look at your daily referral reports to detect newly received inbound links (the great majority of webmasters click on a link after implementing it, to make sure it works).
-
Measure the results of your campaigns by tracking the increase in conversions you are driving over time.
-
Try to find missed opportunities—search terms and phrases that people used that did not result in a click, visit, or conversion.
Web analytics are a must-have for any web publisher.
Basic Overview
Your hosting company most likely provides a free web analytics solution, such as AWStats, Webalizer, or something similar. Although these tools provide valuable data, they are very limited in scope, and other tools out there provide significantly more data. Here are some of the best-known ones:
-
Adobe Analytics (enterprise-level solution)
-
IBM Digital Analytics (enterprise-level solution)
-
Webtrends (enterprise-level solution)
Web analytics platforms track your site’s traffic in two major ways. The older of the two methodologies is to use software that analyzes your web server logfiles after traffic activity. Setting up this type of solution generally involves installing the software on an internal server that is able to gain access to the logfiles.
The newer methodology involves implementing JavaScript tags on all of the pages of your website. Provided that you have a basic template for your pages, this generally is a fairly straightforward process. JavaScript then tracks the activity on your web pages as it happens and builds a data profile reflecting that activity.
Selecting the Right Analytics Package
Logfile tracking and JavaScript tracking are equally valid methods, and each has its own strengths and weaknesses. The biggest advantage of the logfile method is that you can track search engine crawler activity on your site. This is something you cannot do in JavaScript implementations, because search engine crawlers do not execute the JavaScript.
The second big advantage of a logfile-based solution is that you run the software in-house, so no third party has a copy of a logfile with your proprietary traffic data on it. This distinction can be a big security issue for some organizations.
Another key advantage to logfile analysis is the ability to track:
-
Users who don’t have JavaScript enabled (or are using privacy or ad filters)
-
Media types beyond HTML
-
Partial requests (incomplete page loads and load errors)
Ultimately, though, most companies opt for JavaScript tracking because JavaScript offers a much greater level of flexibility than logfiles. You can tweak the JavaScript to do custom conversion tracking, or gather pages into logical groupings in a manner that cannot be done as easily in logfile-based applications.
Other key advantages of JavaScript tracking include the ability to:
-
Track outgoing link requests
-
Track events that don’t involve HTML requests, such as playing a video
-
Record visitors’ screen resolution
Some analytics packages, such as Webtrends, offer both options or a combined solution. This kind of approach can bring you the flexibility and power of JavaScript, but still get you your search engine robot crawling data as well.
Making this decision is only the first step in picking an analytics package. We listed some of the more popular vendors earlier, but there are many more. Each package has different strengths and weaknesses. Not only that, but they all do their counting a little bit differently. These differences stem from how the analytics packages conduct visitor tracking. None of them is right or wrong; they just differ in the exact thing they are measuring. For instance, one package might count a “visitor session” within a certain timeframe.
The more important factor in this decision is whether the functionality of the web analytics software fits your needs. You often do not know what your requirements will be until you have used analytics for a while. As you engage with analytics, you will continually uncover more things to investigate, and develop new requirements.
For many companies, one of the best solutions is to start with a free analytics package such as Google Analytics, then look to buy a higher-end solution once you’ve exhausted the capabilities of the free package. By pushing the limits of these free analytics products first, you will end up developing a set of requirements you can use in deciding where to go next.
None of this is meant to imply that you should not brainstorm your requirements in detail before selecting an analytics package. You should (and must). Just expect that you will develop new requirements along the way. Web analytics is a journey that unfolds over time.
Based on the requirements you establish in your upfront brainstorming, you may find that you require a set of features that the free packages do not provide. Use that knowledge to select the right package to start with.
Extracting Valuable SEO Data in Web Analytics
You can extract all kinds of data from web analytics. Next, we’ll look at a few of the more interesting types of information you may want to extract.
Traffic by search engine
One of the first things you may want to know is the breakdown of traffic by search engine. Figure 11-1 provides an example of such a report in Google Analytics.
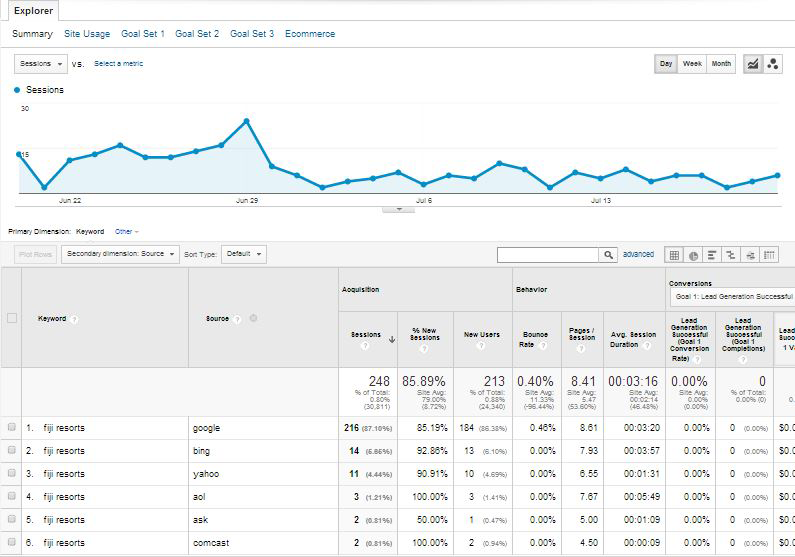
Figure 11-1. Traffic by search engine
Notice how small the traffic is from Bing and Yahoo! compared to Google. This may be indicative of a problem with how the site is indexed by Bing (which supplies the search results to Yahoo!); the webmaster, designer, or developer might want to explore why the combined traffic from Bing and Yahoo! is so low. Or, this result could just stem from the fact that Google by far has a dominant market share—67.3%, according to a comScore report from August 2014. However, in your specific niche, that percentage may be far higher or lower, which is why browser choice can be such an important demographic data set.
Traffic by keyword
Beginning in October 2011, Google began “securing” its search traffic, hiding most keyword data for organic search. As of 2014, most search terms reported by Google Analytics appear as “not provided” (see Figure 11-2).
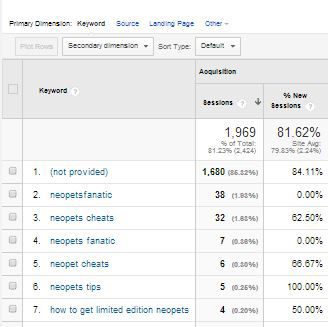
Figure 11-2. Keyword not provided
There are several ways to attempt to extract more detailed keyword data, though none of them are as detailed as when Google used to provide you all of the data. One solution is to use keyword data from your Google Search Console (see Figure 11-3). You can now even access your Google Search Console data directly from Google Analytics (http://bit.ly/search_console_data). Google provides you with some estimates of the number of impressions, number of clicks, your click-through rate, and your average ranking position for a variety of your keywords. Note, however, with Search Console, Google will not provide you with all of your search queries (though it will provide several thousand) and the data is stored for only 90 days (so get in the habit of downloading an export file every 90 days to maintain your archive). This information is found in your Google Search Console interface under Search Traffic – Search Queries. In addition to getting traffic estimates for web searches, you can segment the information by web/mobile/image, by geographical location, or for only specific queries.
Note that by default, filters are different on Google Search Console and Google Analytics. If you’re noticing differences in query results, try syncing up the filters.1
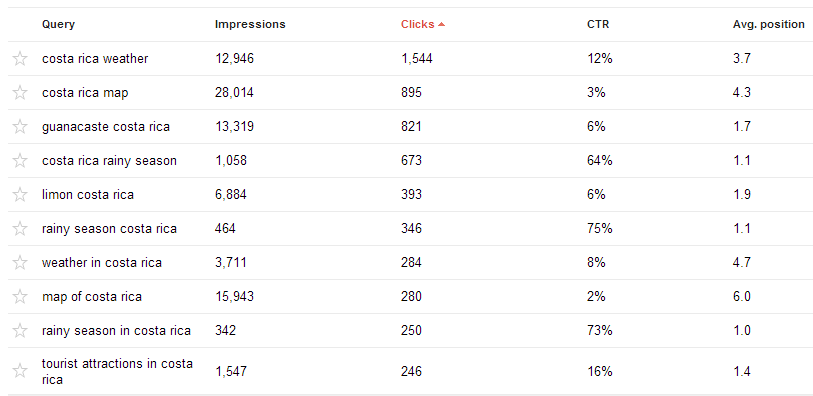
Figure 11-3. Google Search Console keyword data
If you participate in paid Google AdWords advertising, you can also look at your Matched Search Queries report in Google Analytics to see the exact terms users searched on before clicking on one of your ads (http://bit.ly/adwords_search). This may help give you some idea of the types of terms people are using to get to your website. In addition to Google Analytics, Bing Search Console also provides some keyword data.
Although it is a paid tool, SEMrush can also provide some insights into what keywords your site ranks for and approximately how much traffic you might be receiving from each of them.
Another paid solution for obtaining insight into keyword data is Searchmetrics’ Traffic Insight solution. Traffic Insight allows you to reconstruct “not provided” keywords and traffic data on a page-by-page basis by incorporating various data sources and running them through a proprietary algorithm to allow you to “reverse engineer” much of your “not provided” data.
One of the data points of interest for an SEO practitioner is what search terms are bringing traffic to the website. This provides a quick way to see where the SEO campaign is going well and where it is not. You can also use this data to spot opportunities where a key search term is providing some traffic, but not as much as you would expect if you were ranking highly for that term. Remember that search terms are no longer simply considered in isolation. If you spot an opportunity to increase traffic on a key search term, you should really think about what related terms might also drive traffic to the same page as the keyword you are considering.
You can then look to see where you are ranking for that term. Perhaps you are in a lower position on the first page, or on the second page of the SERPs. If so, it might make sense to focus some attention on this term. With a little effort, such as launching a focused promotional campaign for the page in question, and improving and expanding upon the information you provide related to that term, you may be able to move up several positions and obtain a traffic boost. By improving the content on the page to better satisfy the user’s query, you may also begin ranking on related terms.
A traffic-by-keyword report can also show you the long tail of search as it relates to your current site. Figure 11-4 depicts a snippet from the organic search phrases report from Google Search Console showing some of the lower-volume terms for ArtofSEObook.com.
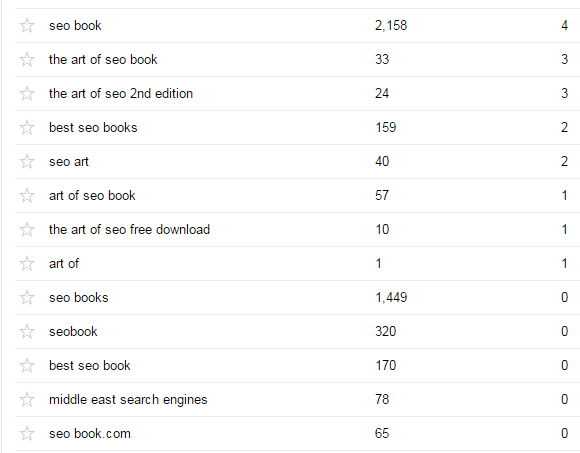
Figure 11-4. Long-tail keywords
Notice that a lot of variations of “seo book” are showing up in the list, in addition to the rather interesting Middle East search engines. Looking into this query data can present you with opportunities for delivering new content that addresses the intent behind these queries.
Branded versus nonbranded traffic
Branded search traffic refers to queries that involve your company name, domain name, or product brand name. Nonbranded search traffic can be much more valuable because it often represents new visitors to your site. Branded traffic will convert at a higher rate on average, but nonbranded search traffic is often from people who did not previously know your brand, or at least they were not yet committed to it to the point where they searched specifically for a variation on your brand name or domain name.
In the past, you could see the data on keywords driving traffic to your website in great detail, as the search engines provided that data and you could readily examine it in your analytics software. Now it’s common that 90% or more of the keywords for your organic search traffic will be reported as “not provided,” meaning that it is difficult to get a strong measurement of what keywords are driving traffic to your site, or even the split between branded and nonbranded traffic.
Number of pages getting search traffic
An indirect way of measuring effective indexation is to keep an eye on how many pages are getting search traffic. This number should represent a subset of the total pages indexed, but it is more valuable because these pages are not just indexed, they also ranked highly and were interesting enough that visitors decided to click on the listing.
This is an important metric to track as you work on addressing site architecture issues like duplicate content and bot traps. As you remove search engine spider roadblocks, the bots will find and index more pages. Those pages will rank and get search traffic, and this number should increase. The same happens as you consolidate duplicate content and the indexation of the site improves.
There are several ways in which someone knowledgeable in Google Analytics can configure your account to give you at least some insight into which of your pages are receiving Google organic traffic where the keyword is “not provided” (which, as noted earlier, will be the great majority of them). From this data, you can extrapolate which groups of related keywords those landing pages are optimized for and which keywords they actually rank for, with the assumption that the “not provided” traffic is coming from those keywords. For some examples of these solutions, see Dan Parker’s “How to steal some ‘not provided’ data back from Google” or Moz’s “Easing the Pain of Keyword Not Provided: 5 Tactics for Reclaiming Your Data”.
Segmenting Search Traffic
Next, you can consider putting these metrics together. Even the free tools provide substantial capability for building out custom reports. Google Analytics has options that show the search phrases just for Google, and the pages of the site that Google sent users to when they clicked on your link.
This is a key improvement to your SEO research for two reasons:
-
If you are looking into what terms can bring fast traffic benefits as a result of some additional optimization, you’ll want to know which search engines you are ranking in.
-
If you are going to optimize a page to rank higher, you’ll need to make sure you’re optimizing the right page!
Referring Sites
Referring site reports are useful for a number of reasons, but one of their more interesting SEO applications is to spot when you receive new links. You can often see those new links in these reports first, even before the search engines report them. Figure 11-5 shows a sample portion of the referring sites report from Google Analytics.
If you notice a site for the first time in your list of referrers, it can be a leading indicator that you have received a new link. This report can help you detect new links that result from your link-building campaigns, and therefore help you measure which of your link development campaigns are yielding the best results.

Figure 11-5. Referring sites report
Using Custom Analytics Dashboards
In analytics terms, a dashboard is a single-page view that contains your most critical metrics all in one place. Of course, your most critical metrics are different from those of the next publisher, because the needs of different sites vary greatly.
In addition, multiple dashboards may be required in any given organization. For example, the CEO of a large public company probably wants to see different data (and a lot less of it) than a senior business analyst.
Each analytics package provides methods for implementing a custom dashboard. Figure 11-6 is an example of one from IBM Digital Analytics.
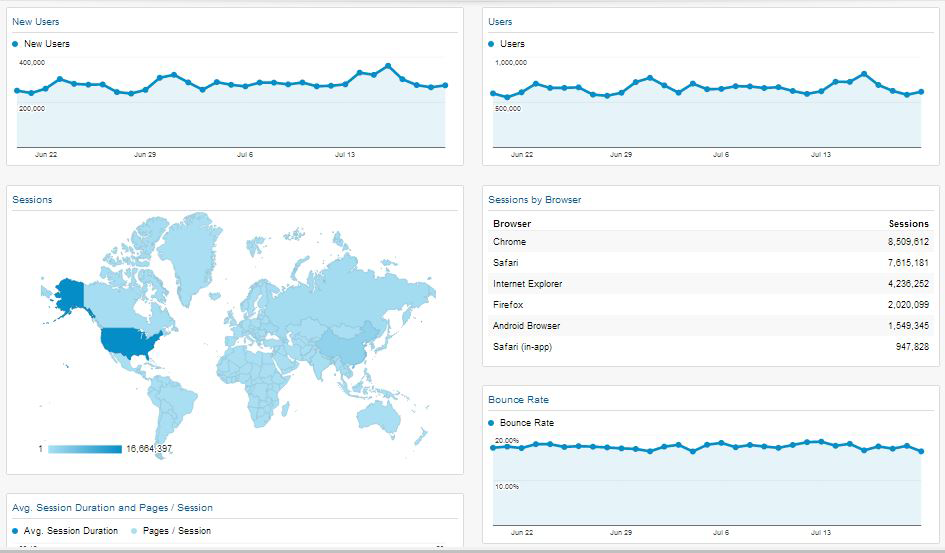
Figure 11-6. Custom dashboard
As you can see from Figure 11-6, a dashboard can be quite visual. What is most important, though, is that it provides the data that is most important to the person for whom it was designed. As an SEO practitioner, you can implement a dashboard to show your progress toward the goals you’ve set for your SEO campaign.
Providing this type of visibility has two important benefits:
-
The person viewing the report will appreciate the fact that she does not have to work hard to do a quick health check on the progress of the SEO efforts. As we suggested at the beginning of this chapter, the fact that you agree to measurable goals will be a great comfort to management.
-
You will know what data your managers are looking at. When something goes wrong (or right), or when management wants to discuss some aspect of the business, they will have started from the dashboard you set up for them.
NOTE
A key consideration in selecting analytics and dashboard solutions is whether your web analytics solution has prebuilt integrations with your preferred SEO solution, or whether your SEO solution is part of a larger cross-media dashboard platform. Otherwise, you may end up with siloed information or quite different conversion metrics in one dashboard than in another.
Taking a Deeper Look at Action Tracking
Action tracking goes one step deeper than basic analytics. Rather than simply observing what pages are visited and how many unique sessions are logged, action tracking allows you to narrow down groups of visitors based on the actions they take on your site.
In most instances, action tracking requires setting up a code in your analytics program and attaching that code to a button, page load, image rollover, or other JavaScript-trackable task (a click or hover).
You can see from Figure 11-7 that:
-
Moz has action tracking in place where the users click a particular button. Note that it is often the best choice to have the action tracking on the action confirmation page rather than the sign-up form itself, as tracking on the sign-up form can result in incomplete form fills being included as part of your action total.
-
Based on the people who take this action, you can predict which search terms will be better at converting visitors into applicants.
-
The Event Value and Avg. Value columns show 0, but if you were tracking ecommerce buyers, you could assign values to each event and track high-volume buyers. It is also a good idea to assign a value to different actions such as “contact us” requests, subscribers to free services, or any other user actions that could later lead to a conversion.
-
Expanding on this idea, you could also track users by time of day, the search engine they used, their geographic location, and so on.
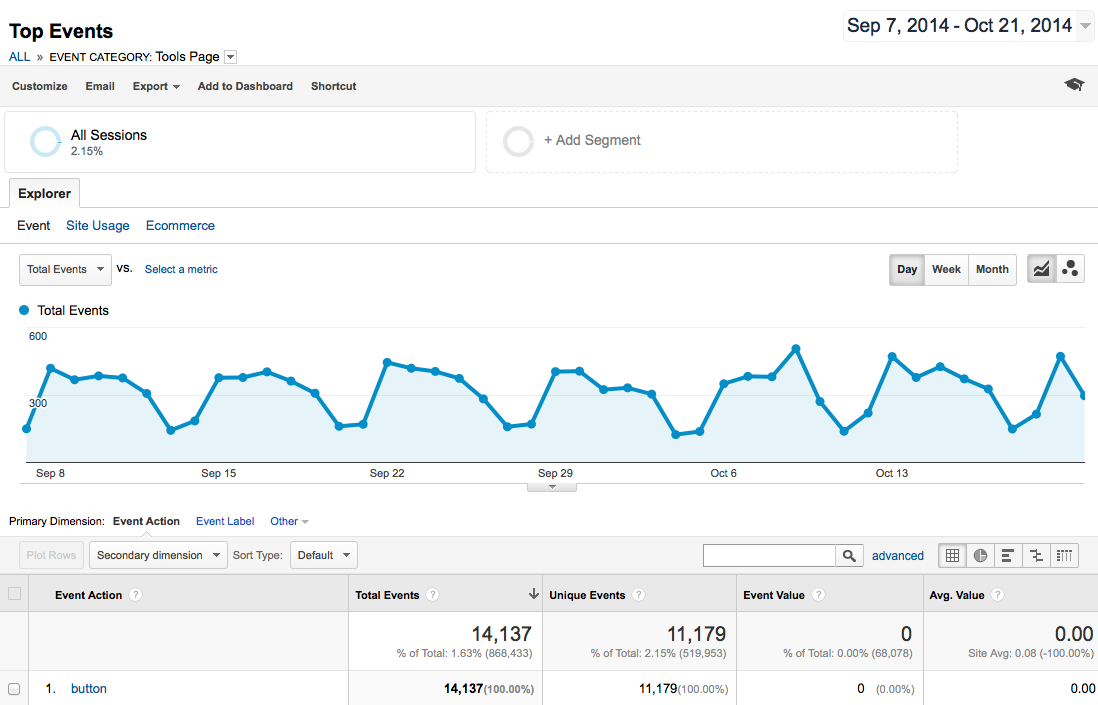
Figure 11-7. Action tracking in analytics
So, what types of actions should you track on your site? The answer varies depending on your business and site structure. Here are some suggestions segmented by site type.
Ecommerce sites:
- Add to Cart button
-
Studies have shown us that users who “add to cart,” even if they do not complete the checkout process, are more likely to return to make a purchase. This is also a good way to calculate shopping cart abandonment and make changes to refine and improve the process.
- Complete checkout
-
An obvious one, this action will show you what percentage of each user group is converting into sales. It is also useful to measure what percentage of people start the checkout process but do not complete it.
- Save to wish list
-
Ecommerce sites offering wish lists are still in the minority, but wish lists are a great way to track interest that isn’t quite a purchase.
- Send this to a friend
-
Many sites offer a “share this page” function, and it is a great action to be aware of. If folks are sending out your link, you know you have a hit.
B2B sites:
- Subscribe to newsletter
-
A subscription is a tacit endorsement of your brand and a desire to stay in contact. It may not be a conversion, but for B2B, it may be the next best thing.
- Contact form submission
-
A contact form submission can be even more valuable than a newsletter subscription, in some cases. Though some of these forms will report support issues, many may contain users’ questions about your products/services and will indicate their desire to open a sales conversation.
- Email link
-
As with contact forms, direct email links have the possibility of becoming sales contacts. The best thing you can do is clearly label sales emails and track them separately from support or business issues.
Blogs:
- Subscribe to RSS feed
-
An RSS feed subscriber is a blog’s equivalent of a conversion; tracking these is imperative. While the number of RSS subscribers is declining, this is still a useful metric to track.
- Add comment
-
Anyone who is contributing content to the blog or otherwise participating merits your attention (as do those channels that earn user engagement).
- Social bookmark/share
-
Anyone submitting your content to Facebook, Twitter, Delicious, StumbleUpon, reddit, and other social media and news aggregation/discussion sites deserves to be recognized (and sought after).
Forums or other sites based on user-generated content (UGC):
- Sign up for an account
-
These users are active contributors; you need to know where they come from.
- Contribute content
-
When a user publishes, discovering his path is important (especially if it is not from a bookmark/type-in).
- Add comment
-
As in the preceding list item, comments are a great predictor of engagement.
- Vote/rate
-
Even low levels of participation, such as a rating or a vote, are worth tracking when every piece of participation counts.
- Social shares
-
Facebook friends and likes, Google +1s, Twitter followers are all important data points. You can read more about this in “Tracking Social Media” in Chapter 8.
You can get very creative with many of these and track all sorts of actions. If you offer a tool or calculator, track its usage. If you want to follow who clicks a particular link (rather than just a page), add an action to it. You can even see which users hover on an image.
For many marketers, action tracking is the secret sauce. Once you install and activate this data, it is easy to adjust SEO (or PPC) marketing efforts on particular terms, phrases, or pages that will make a huge difference to the campaign’s efficacy.
For SEO practitioners, action tracking is a “cannot live without it” tool. The recommendations made based on this kind of tracking are backed up by real data. High-volume action-tracking studies almost always make a huge impact on a site’s bottom line. Action tracking also allows you to compare the performance of organic search against other channels such as paid search, email marketing, and social media.
Separating the Analytics Wheat from the Chaff
One of the big problems with web analytics is that there is so much data. There is seemingly an endless supply of the stuff—so much that you can get lost in the weeds and waste a lot of time. As Dennis Mortensen of Visual Revenue likes to say, do not “report-surf.”
By this he means you shouldn’t get lost in the data, looking at one interesting fact after another, without understanding what business objective you are attempting to accomplish. To avoid this trap, you need to have a plan.
The basis of this plan is the definition of actionable key performance indicators (KPIs). To summarize this concept very briefly, do not view a report unless there is a chance that it will provide you with enough insight to take action (such as reallocating resources to fix a problem or pursue a new opportunity you discovered).
Common analytics mistakes
Because of the complexity of web analytics, there are plenty of opportunities to make mistakes. Even if you are laser-focused on actionable KPIs, you can still draw wrong conclusions from the data. Here are a couple of examples:
- Making a decision on too small a sample size
-
A simplistic example would be if you had a keyword that brought you two visitors, and both of them bought something. What does that mean? Your conversion rate will always be 100%? Of course not.
-
You need to have a test run for a length of time that is statistically significant. According to Jonathan Mendez, long-time evangelist for Offermatica (which is now Adobe Target), the “golden rule” for test length is 100 conversions per branch (or tested element). For an A/B test, ideally you would have 200 conversions before you looked at the results. However, if after 50 conversions you have 40 on one branch and 10 on the other, your test is over. If your variance in results is lower, you need more data to make sure what you are seeing is accurate.
- Not recognizing when you have enough data
-
You can make this mistake in the opposite direction too. When you have enough data, you need to be willing to act on it.
- Working with biased data
-
You can easily collect biased data and make the wrong decision. For example, an ecommerce site basing its SEO plans on December’s traffic numbers is probably being misled. And temporal factors aren’t the only cause—visitor locations, referral sources, and in-house campaigns to existing lists can all skew information.
Tying SEO to Conversion and ROI
As we discussed previously in this chapter, it is important to tie your SEO efforts to the results they bring to the business. A fundamental piece of that is measuring the conversions driven by organic SEO traffic. Here are some of the most common types of conversions:
- Sales/sales revenue
-
This is the one that everyone assumes is part of conversions. Sales and sales revenue (or better still, margin) conversions can be the simplest things to track, except when you are selling many different products at different price points and in different quantities. In this case, the process would need to be a bit more sophisticated.
-
If your site is advertising-driven, you need to look at the impact of organic search traffic on advertising revenue. If you have no financial goals for your site, you need to look at some of the other types of conversions and determine their value or worth.
- Email/blog/newsletter subscriptions
-
Anytime a user signs up to receive regular communications from you, it is a win. Even though there are not direct financial consequences to this, it is still a conversion. Someone who has subscribed to something you offer is more likely to become a customer than a first-time visitor to your site, so you need to credit this type of conversion.
- Sign-ups
-
Closely related to the notion of subscriptions are other types of sign-ups. Perhaps you offer a service such as a tool that people need to sign up for to use. Even if the tool is free, you should track this as a conversion.
-
You most likely received the person’s email address in the process, and even if she indicates that she does not want to receive commercial communications from you, you should be building loyalty with the tool you provided her access to (or whatever she signed up for); otherwise, why would you be providing her with that service?
- Downloads
-
Many sites offer free downloads, such as white papers or tools. Even if you do not require a sign-up of any type, you should still count this as a conversion. You are getting your message out there with the downloads you offer.
- Contact forms and phone calls
-
When someone contacts you or requests that you contact him, via a “contact us” form or a phone call, it might count as a conversion. Phone calls can be tracked through unique numbers per type of action, landing page, and traffic source.
- Visitors who share
-
This conversion happens when a visitor shares the information she found on your site with someone else. This includes Facebook shares, Google+ shares, and links on Twitter. In addition, if your site has a “share with a friend” or an “email to friend” feature, you could keep track of conversions by noting each time a user used that feature.
- Visitors who link
-
Users who find your site’s content useful, entertaining, or otherwise compelling may link to it from their own sites. You should count such linking as a conversion.
- Visitors who publicize
-
Visitors can publicize your site by mentioning it in forums, blog comments, or social media sites such as Twitter and Facebook, or by writing about it on their own sites. These actions should count as conversions.
You should place a dollar value on every type of conversion you receive. Even a white paper download has some value to it; perhaps it may increase the potential of a future sale to that user. For example, if 100 people download your white paper and two of them become customers and buy a $100,000 consulting contract, you can estimate the value per download at $2,000.
SEO software packages such as Conductor Searchlight and Raven SEO Tools allow SEO professionals to view search ranking data together with traffic and revenue data. This enables them to tie natural search traffic to conversions, and therefore measure return on investment (ROI). You can see sample screens from Conductor Searchlight in Figure 11-8 and Raven SEO Tools in Figure 11-9.

Figure 11-8. Conductor Searchlight ranking data overlaid with traffic and revenue metrics

Figure 11-9. Raven SEO Tools ranking data and conversions
Managing Attribution
Another issue to be aware of is attribution—identifying the user actions that led to a specific outcome. The challenge is that there is a tremendous amount of interaction between types of media. Here are some examples:
-
A user does a search, clicks on an organic search result, and then reads a few things and leaves. The next day, she remembers what she read, does another search, and this time clicks on a paid search ad for the site and buys a product (organic search should receive some credit).
-
A user does a search, clicks on an organic search result, and leaves. A few days later, because of what she learned, she goes into a store and buys a product (organic search should receive some credit).
-
It goes in the other direction too: a user sees a TV ad, then does an organic search to find the website, and buys the product (the TV ad should get some credit for the sale!).
Such cross-channel interactions are becoming increasingly common. Data published on Search Engine Watch supports this.2 A ScanAlert study of a large number of ecommerce sites showed that 30% of transactions took place one to three days after the customer’s initial visit. So, the problem of attribution management is significant!
It is not always easy to track multivisit conversions in detail. Certainly, a direct interaction between TV/offline stores and a website is very difficult to track. But even looking at multiple site visits with an interaction between PPC and organic search can be difficult, partly because the tracking systems rely on cookies, which users have a tendency to delete.
So, attribution is something you should think about, and ideally you should attempt to track the impact across multiple site visits. However, the methods for attributing sales across multiple site visits are imperfect. One thing you can do to mitigate that is to count different types of conversions, such as filling out contact forms, downloading white papers, visiting key product pages, and so on. Tracking a larger number of events that indicate progress toward a sale (or whatever your end goal may be) can help you identify at which stage in the research and conversion process organic search comes into play for users.
Setting Up Analytics Software to Track Conversions
One of the great things about tracking conversions is that you can use the resulting data to focus your efforts. If a given page or referrer is showing much higher conversion rates than another source, you may want to focus more of your SEO efforts on those rather than on something else that does not convert as well.
Capturing conversion data takes some setup. Your analytics software does not know what you consider a conversion unless you define it. For example, in Google Analytics, you need to go into your Profile Settings to configure conversion goals and funnels (see Figure 11-10).
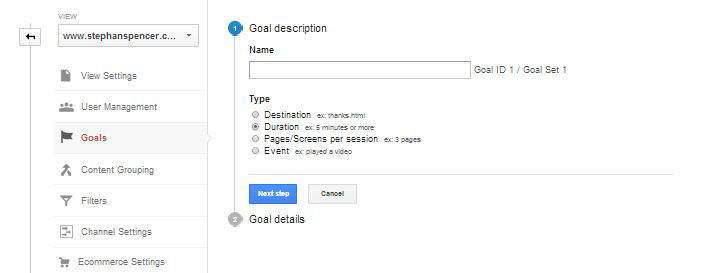
Figure 11-10. Google Analytics goals
Once you click Edit (on the right) for one of the goals, you come to a screen that allows you to define a goal (see Figure 11-11).

Figure 11-11. Google Analytics goals setup
In Figure 11-11, the primary data being tracked is when someone arrives at a given web page. These types of conversions are easy to set up.
Event tracking, such as someone clicking on a link, downloading a white paper, clicking on Flash or AJAX elements, or playing a video, is slightly more complicated. Because you cannot count on a page load to tell you when a link has been clicked on, you need to add a bit of tracking code to the link itself. Here is what the tracking code looks like for Google Analytics:
<a href="#"
  onClick="_gaq.push(['_trackEvent', 'Video',
    'Play', 'Art of SEO Book Launch']);">
  Play Video</a>
The key code is onClick="_gaq.push(['_trackEvent', 'Video', 'Play', 'Art of SEO Book Launch']). This tells Google Analytics to associate this event to the user’s action. Event configuration is best handled by an experienced developer. More information is available through the Google Analytics Event Tracker Developer Guide).
Google has also introduced a new analytics package called Universal Analytics, which allows you to track users across multiple devices and sessions. It also offers you the flexibility to implement tracking (including event tracking) through both JavaScript on your website and the Google Analytics SDK for mobile, and there’s even a protocol to measure engagement across other digital devices, such as game consoles. Implementing Universal Analytics requires several steps that are not intuitive, so we recommend engaging an experienced analytics professional to help you through the process.
Google Analytics provides the particularly useful capability of remarketing to previous site visitors in Google AdWords.3 You can segment your users based on a specific behavior, such as visiting a particular product page, and make a list of these users in Google Analytics. If the list is longer than 100 users, it is automatically sent over to Google AdWords. Then your ads will be marketed to solely those users across the Web.
Form submissions are another metric you may want to track. This category could include when someone has completed a request to sign up for a newsletter, requested or started a white paper download, or simply used a form to request that you contact him. These are usually quite easy to set up, provided that the result of the form submission is some sort of “thank you” page. All you need to do in this case is tell your analytics software that the loading of that “thank you” page is considered a conversion, and then give it a value.
Analytics is particularly useful if a portion of your customers tend to log in to a company’s features with a social media login, such as a “Login via Facebook” mechanism. In that case, you have the ability to track users across several devices, for even more advanced and thorough customer data.
Facebook Insights gives you yet another valuable data set for tracking conversion. Domain Insights shows all of the traffic from Facebook to your domain, including traffic from your Facebook business page, from links on status updates, from social plug-ins, and more.
Life gets more complicated when you want to track actual product sales on sites where products vary in price. Generally speaking, this will require putting some custom JavaScript on your order confirmation page.
In addition, you will need to have your web application populate certain data in the JavaScript before executing it, such as the total amount spent. Oftentimes, publishers choose to include a lot more data, such as listing all the products sold, the price per product, how many units, shipping costs, and so on.
Although the preceding examples used Google Analytics, any of the major analytics packages can do this type of conversion tracking.
Conversion tracking strategy
An important step in conversion tracking is deciding what you want to call a conversion. As we outlined earlier in this chapter, it is important to consider all types of conversions, such as sign-ups, contact requests, downloads, and so forth. There is one other decision you need to make: how to value each conversion.
What is a contact request worth? What about a newsletter sign-up? One way to back into this is to look at how many of your newsletter sign-ups become customers. For example, if 100 people sign up for the newsletter, 10 of them become customers, and the total dollar value of their orders is $200, the average value per sign-up is $2.
When you first set up conversion tracking, you may need to estimate some of these things. But as your data improves, you can improve your calculation and refine the value you place on each conversion.
Segmenting Campaigns and SEO Efforts by Conversion Rate
Now that you have conversion tracking set up, how do you use it to focus your SEO efforts? One of the things you will want to do is to track conversion data in different ways, such as looking at:
- Conversions by keyword
-
What keywords are bringing the best results? Note that this data has become far more obscured since the “not provided” update in 2013 but can still be useful to measure. Even linking Search Console to Google Analytics does not enable conversion tracking for those terms.
- Conversions by referrer
-
Which traffic source is offering the best conversion?
- Conversions by web page
-
Which pages on your site result in the highest number of conversions?
- Conversions by initial entry page
-
Which initial entry pages ultimately lead to the highest number of conversions?
For example, Moz actively tracks its conversions using Google Analytics. Tracking by keyword can be a useful way to do this, as shown in Figure 11-12.
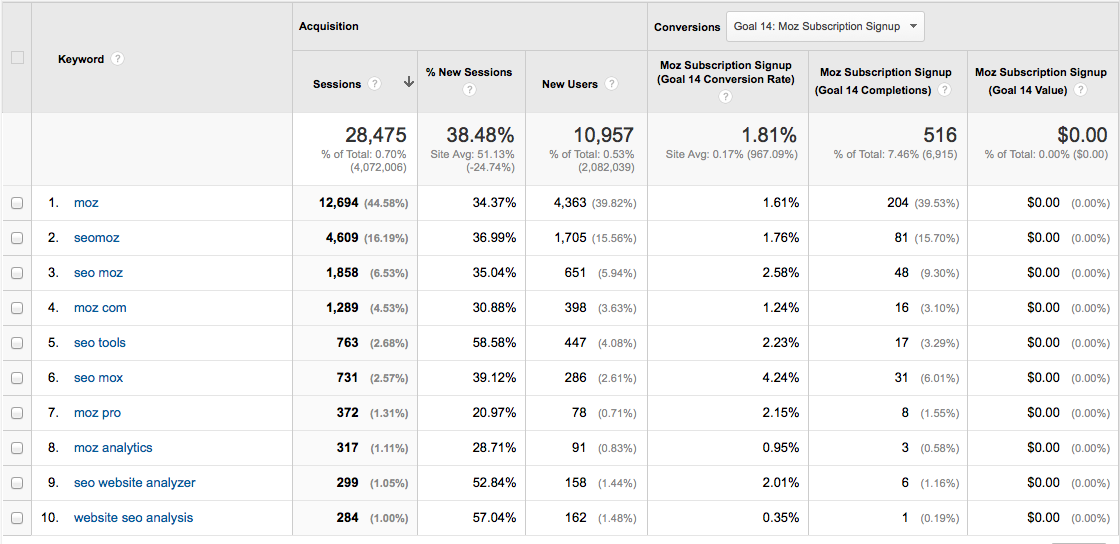
Figure 11-12. Google Analytics tracking conversions
You can see that the conversion rate on the keyword seo tools is high. Perhaps an SEO campaign to improve the ranking of Moz on these keywords is in order. Not only do you see high conversion, but you also see reasonable material volume.
Implementing an SEO campaign that doubles related traffic for this set of keywords will likely have a significant impact on the bottom line. Google’s move to obscure keyword data makes this form of measurement less valuable than it used to be, but it can still be a useful directional indicator.
Increasing Conversion
As an SEO practitioner, you should strive to become an expert at conversion optimization, because higher conversion rates mean higher impact for your SEO campaigns. Coauthor Stephan Spencer offers a viewpoint on this topic in a MultiChannel Merchant article “Be a Converter”.
Nonetheless, the average site conversion rate for a typical merchant today is only about 2.4% combined for new and returning visitors (source: Monetate E-Commerce Quarterly Report EQ1 2013).
So, how do you help your conversion rate by managing your content and refining your site design? Most web resources that give content advice are focused on blogs—specifically, what and how often you should publish. Those of us who use websites strictly for sales and marketing are equally concerned with good content, but from a totally different angle—one that traditional content advice doesn’t properly address.
What’s more, much of the design advice out there seems contradictory. The key to enhancing your conversions by adjusting your design and content is not in thinking strictly about the technology or the mechanics of site layout, but in understanding the needs of your visitors. In that, there are many different elements to consider. A book about SEO can’t cover this topic in depth, but you may want to pick up one of the following excellent books that do: You Should Test That! by Chris Goward (Sybex), A/B Testing by Dan Siroker and Pete Koomen (Wiley), Always Be Testing by Bryan Eisenberg and John Quarto-von Tivadar (Sybex), Landing Page Optimization by Tim Ash (Sybex), and Web Design for ROI by Lance Loveday and Sandra Niehaus (New Riders Press).
The content marketing bump
A specific example of how to use action tracking by referral source is to track a content marketing bump. The idea is that after successful content draws thousands of visitors to your site, a small percentage of those visitors will stick around and continue to visit on a semiregular basis (this is particularly true if you’re regularly delivering fresh, valuable content).
Action tracking by referral source
Figure 11-13 shows a sample report from Google Analytics.
In Figure 11-13, you can see a list of domains that sent Moz traffic over a few weeks’ time, along with the number of resulting Moz subscription sign-ups. You can see some clear patterns, including the following:
-
WebStatChecker, Feedly, Google Plus, Stack Overflow, and reddit are sending traffic, but less than .001% of those visitors sign up for membership on the site.
-
The domains that point primarily to the Moz tools (such as Backlinko) are responsible for a high number of sign-ups, but this is to be expected, as a visitor has to register to see the full data sets available in Moz’s tools such as Open Site Explorer.
-
SearchEngineJournal, Facebook, and QuickSprout are amazingly on-topic sources of traffic, which is directly borne out in the higher percentages of their referrals who become members.

Figure 11-13. Action tracking by referral source
Action tracking is one of the most valuable things you can do on any type of site. Most people limit its application to ecommerce, but you can see from the data in Figure 11-13 how valuable it can be, even for a simple blog. Even if you do not have a membership sign-up, you could attach the action tracking to your “add comment” link in a blog or to a newsletter sign-up on a content site. Segmenting that data by incoming referrals (search engines, direct type-ins, and links) gives you an even better picture of who’s sending you truly valuable traffic. You can also get an indication of traffic quality by looking at bounce rate, time on site, and number of pages viewed for each referrer.
In Figure 11-14, you can see that around late May, Moz published some successful content that helped bump up the site visitor count at least through mid-June. This traffic “bump” after the spike is another great benefit of creating viral-worthy content; this is a terrific way to grow the popularity of a site.

Figure 11-14. Traffic report
The tricky part is to continue to deliver great content after a viral piece and maintain the creative energy necessary to prove to visitors that you’re worth coming back to again and again. It is not an easy sell—people’s time is valuable. You have to make your content so targeted, interesting, and worthy of their attention that they cannot look away. It is challenging and time-consuming, but it is a great way to build a successful site.
Determining Project ROI
An effective SEO process is one that continuously works toward a positive return on investment. A basic SEO ROI business case would include these elements:
- Number of people searching for your keywords
-
This can be hard to estimate, because you cannot completely map out the long tail. One rough estimation strategy is to multiply the search volume for the top terms for your business by 3.3 (i.e., assume that the head terms are about 30% of the available volume).
- Expected click-through rate from organic search
-
This relates to the position you think you can achieve. The #1 position can net you approximately 19% of the available clicks.
- Average conversion rate
-
Once you have captured the visitor, how successful are you at completing a conversion? Typical conversion rates for a website might be between 2% and 5%. It should be easy to get this data from your analytics. You should already know what your conversion rate is!
- Average transaction amount
-
Last but not least, factor in the average transaction value. Again, this is data you already have.
Ultimately, the formulas look like this:
-
SEO revenue = people searching for your keywords * click-through rate * average conversion rate * average transaction amount
For example: 10,000 per day * 10% * 5% * $100 = $3,000 per day.
-
SEO ROI = SEO revenue / SEO cost (use total $ spent for salaries and consulting, or number of hours spent)
For example: $3,000 per day / $500 per day = an ROI of 6×.
An alternate theory and calculation
Predicting an SEO project’s ROI based on rankings and click-through rate can, in some cases, be problematic because you have very little control over the variables. You end up relying on numbers that you have a limited ability to influence. As an alternative approach, you can measure and track SEO ROI based on an increase in search visibility.
To do this, begin by determining two things:
-
How many pages are getting search clicks for the month
-
How many clicks per page your site is getting
Next, record these supporting metrics:
-
Average ranking across the whole keyword spectrum
-
Average click-through rate
Now, by making it easier for search bots to find more pages, consolidating duplicate content, improving the depth and breadth of content, changing your pages to better match your users’ needs, and improving page titles, metadata, and microdata, you should see an increase in the number of pages getting search clicks and/or the number of clicks per page. The combination should result in more traffic when compared year-over-year.
Modifying the previous formula to account for this alternate approach, we get:
-
SEO revenue = increase in (pages getting search clicks * search clicks per page) * average conversion rate * average transaction value
Note that CTR in the long tail is far more variable. Not as many searchers are going to go past the first couple of results, so this formula won’t always accurately show your return. ROI is always going to be a “best estimate,” but this type of ROI calculation will be more accurate for the short tail.
Competitive and Diagnostic Search Metrics
Thus far in this chapter we have focused on the basics—the dollars and cents of determining whether you have succeeded in your SEO campaign. As we noted at the beginning of the chapter, these should be your first priority in your analytics efforts. In this section, we will start looking at metrics that you can use to diagnose specific SEO issues. An example would be finding out whether a major section of your site is not indexed. Another example is seeing how your traffic growth compares to that of your competitors (this helps you decide whether you have set the right objectives for your efforts).
Search Engine and Competitive Metrics
Numerous tools allow you to monitor your site and those of your competitors, providing insight into your SEO progress. You can also use these tools to figure out what your competitors are doing from an SEO perspective. This type of intelligence can provide you with new ideas on how to adapt your strategy to get better results.
As with all such tools, it is always important to understand the context of the tools and to have an idea of what you are looking for. Better knowledge of your competitors’ strategy is certainly one valuable goal. Detecting a problem in how your website is crawled is another.
By selecting specific and actionable goals, you can set yourself up for the highest possible return.
Site Indexing Data
It is valuable to know how many pages in your site are in a search engine’s index. This is important for two reasons:
-
If you discover that key parts of the site are not in the index, you can embark on an effort to determine why.
-
Looking at competitors’ indexed pages can help you learn about those competitors’ sites and strategies.
You can get basic information on the number of indexed pages for a site using the site:<yourdomain.com>, as in a Google, Yahoo!, or Bing search. Figure 11-15 uses the results for Stephan Spencer’s blog.

Figure 11-15. Site indexing data
As shown in Figure 11-15, Google reports 787 pages in the index. Is that all of the site’s pages? Many site owners will have a pretty good idea of the number of pages on their site and therefore can get a gut feeling as to whether they have a problem. One important thing to note is that the results that the site: search operator return are fast estimates, and aren’t as accurate as the reports generated by Google Search Console based on your XML sitemap. You can use them to give you a general impression, but that is all.
You can improve this data by performing your site query, switching to 100 results per page, and going to the last page of the Google results to see if the number of results has changed. This will give you more accurate totals for the number of pages indexed.
If you think many pages are missing from the index, you can begin to explore a bit deeper. You can start by narrowing down sections of the site. Figure 11-16 shows the 2014 blog post archives on Stephan’s site.

Figure 11-16. Indexing data on a website section
As shown in Figure 11-16, this reports 23 pages in the Google index. By using these different search options, you can isolate what portions of the site appear to be less well indexed than others. You can also combine site: with other operators, as we outlined in Chapter 2. For example, consider combining it with the inurl: operator, as in Figure 11-17.

Figure 11-17. Combining the site: operator with inurl:
Figure 11-17 shows that http://www.practicalecommerce.com has 42 pages in the index that have the word productivity in the URL.
So far, we’ve shown website indexing tools that you can use on any website, which is great for competitive research. However, you can pull more accurate statistics for your website using Bing Webmaster Tools. You can also pull site indexing data from Google Search Console.
Both of these tools are very useful, and you should use them on every site you touch. By simply signing up and verifying site ownership, you will get a tremendous amount of valuable data at no cost. For example, Figure 11-18 shows the opening screen for Bing Webmaster Tools for http://stonetemple.com.

Figure 11-18. Bing Webmaster Tools
In Figure 11-18, it looks like Bing has 2,750 pages from the site indexed. If you search for site:stonetemple.com in Bing itself, it shows something rather different (see Figure 11-19).

Figure 11-19. Results of the site:stonetemple.com search on Bing
This search shows 10,500 indexed pages. Of the two, you should consider the report from Bing Webmaster Tools to have more accurate data than the results from a site search at Bing.
Bear in mind that Google Search Console and Bing Webmaster Tools do not keep track of historical data for you. If you want to maintain a history of the data, you should plan on downloading and saving the reports.
Link-Based Tracking of Content Marketing
Measurement of content marketing campaigns is another must for the expert SEO practitioner. This can help you refine your campaigns to bring better results, compare link growth to your search rankings, and perform analysis to see how your campaigns are faring compared to the efforts of your competitors.
Search engine–supplied tools
There are three basic tools for checking backlinks:
-
Google Search Console is a powerful start. With Google Search Console, publishers can easily download a spreadsheet of all the links Google has in its database (note that Google might not include some links that it does not consider significant). With this tool, publishers can see only the links to their own site. Figure 11-20 shows the report.
-
Bing Webmaster Tools is also a great asset. It offers a similar capability for downloading a spreadsheet of the links that Bing has in its database for a site. Once again, publishers can use this tool only to see the links to their own site. Figure 11-21 shows what the report looks like.
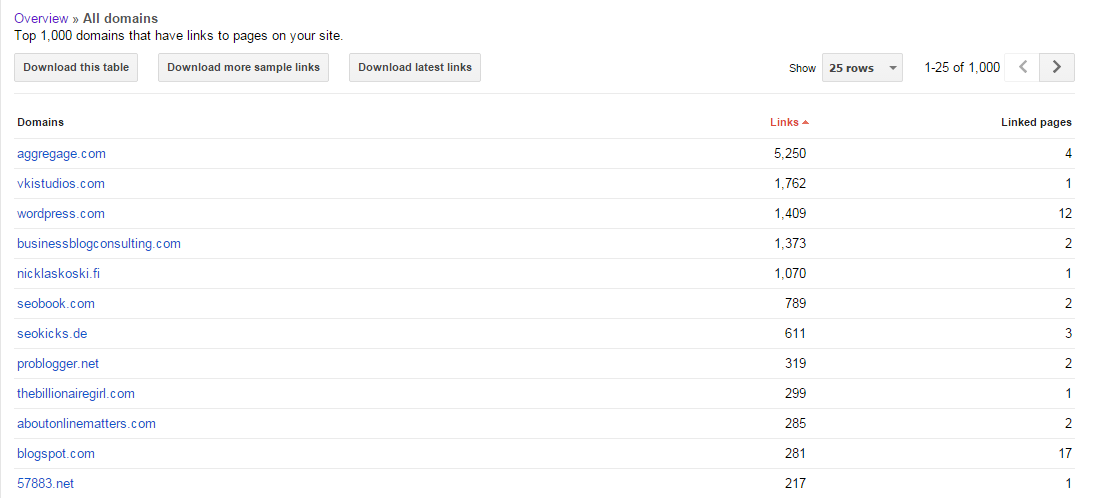
Figure 11-20. Google report on external links
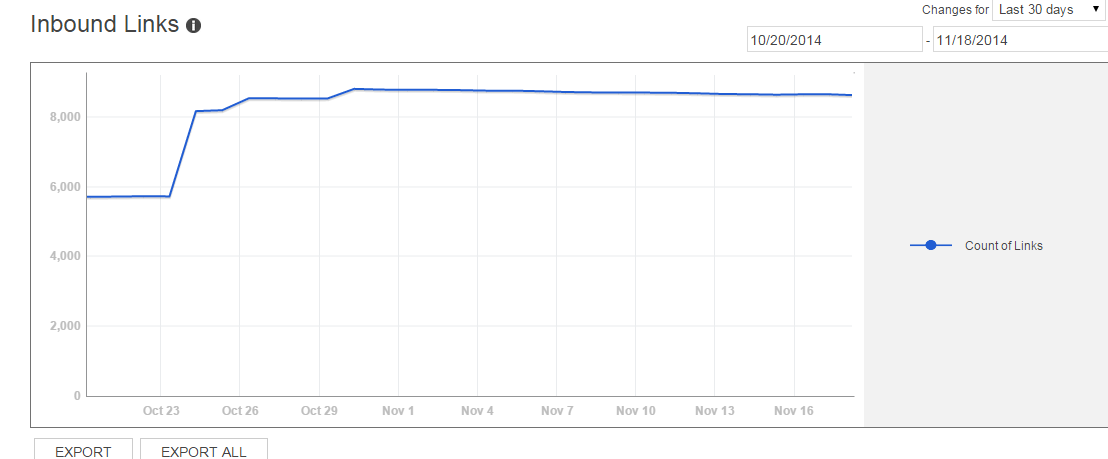
Figure 11-21. Bing report on external links
For quick-and-dirty link totals, you can use a Firefox plug-in known as SearchStatus, which provides basic link data on the fly with just a couple of mouse clicks. Figure 11-22 shows the backlinks menu you’ll see.

Figure 11-22. SearchStatus plug-in
Notice also in Figure 11-22 that the SearchStatus plug-in offers an option for highlighting nofollow links, as well as many other capabilities. It is a great tool to help you pull these kinds of numbers much more quickly than would otherwise be possible.
An option for quickly referencing link totals in Google Chrome is Majestic’s Backlink Analyzer browser extension, shown in Figure 11-23.

Figure 11-23. Majestic Chrome extension
The Majestic plug-in gives you rankings for Citation Flow (authority) and Trust Flow (trustworthiness) as well as the number of external backlinks and referring domains for the current URL, the subdomain that URL resides on, and the root domain for the current site.
Another useful tool for seeing link data at a glance is the MozBar Chrome and Firefox extension is shown in Figure 11-24.
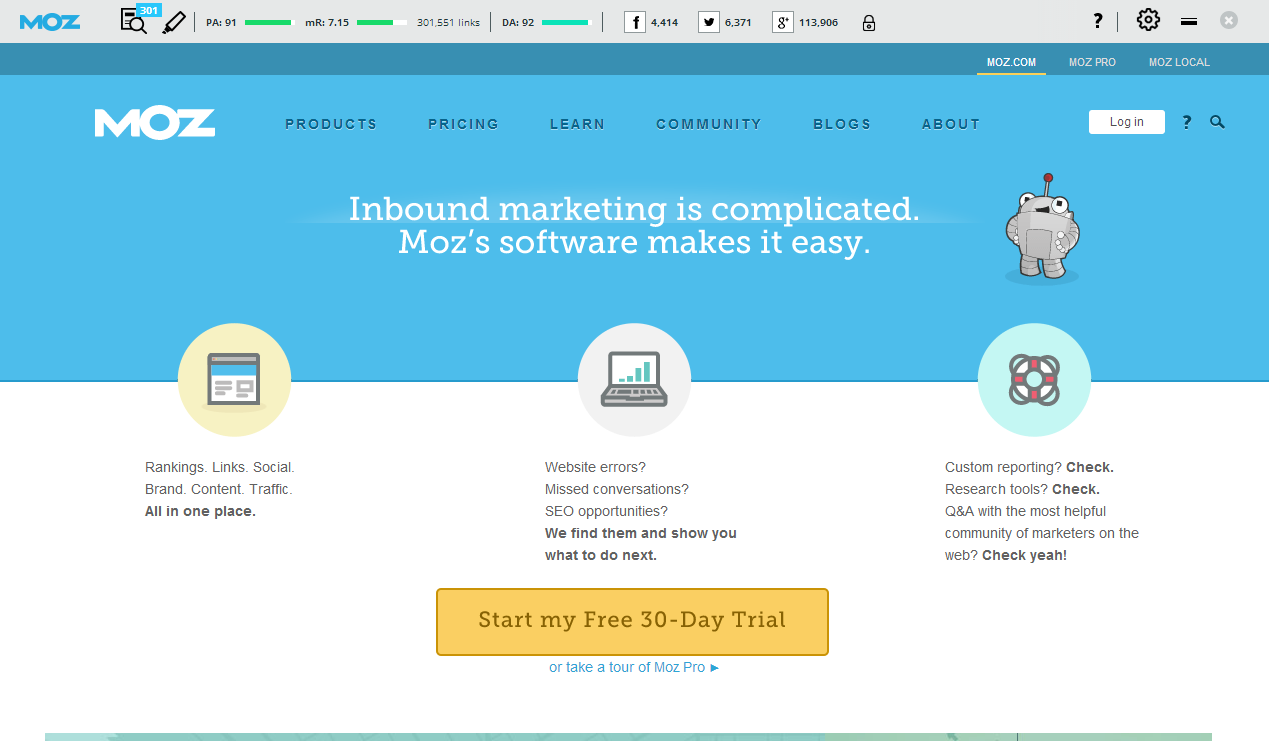
Figure 11-24. MozBar Chrome extension
The MozBar shows a great deal of data that is useful for SEO. For the purposes of quick backlink analysis, it shows Page Authority, MozRank (Moz’s answer to PageRank), total number of links to the current URL, and Domain Authority. Figure 11-24 shows the data you can get for free. If you have a paid Moz membership, the toolbar will display additional link metrics such as the number of unique linking domains and data for the subdomain.
Third-party link-measuring tools
Next, we’ll look at some of the better-known advanced third-party tools for gathering link data.
Open Site Explorer
Open Site Explorer was developed based on crawl data obtained by Moz, plus a variety of parties engaged by Moz. When you enter a competitor site’s URL in Open Site Explorer, you can scope out where it’s getting links, discover which pages are the most influential, and compare its link profile to yours to see how your performance stacks up. This tool lets you get as many links as it can find and then extract them all into a spreadsheet. Figure 11-25 shows a sample report.

Figure 11-25. Open Site Explorer report
Included with this report are Page Authority and Domain Authority scores for each URL listed and each domain. Be aware that these metrics are useful in assessing the value of a domain or a page, but what the search engines actually measure and use may be substantially different.
The tool also flags redirects so that you can see them. The beauty of Open Site Explorer is that it allows SEO practitioners and publishers to collect competitive intelligence on other people’s domains. All the data is extractable in a spreadsheet to allow for easy offline processing.
Majestic
Majestic offers comprehensive backlink analysis for your domains (see Figure 11-26). Majestic’s flagship tool is the Majestic Site Explorer, which is particularly useful for auditing the links to a website. You can quickly analyze any website’s backlinks, new links, lost links, and anchor text—all in one place.
Majestic has two unique metrics: Trust Flow and Citation Flow. These are scored between 0 and 100. Trust Flow is a good quality metric; it allows you to easily analyze how trustworthy a website or backlink is. Citation Flow can give you an idea of how influential a site or page is—its “link juice”—based on the number of links coming into it and the authority of those links. Looking at the ratio between the Trust Flow and Citation Flow scores can also help you determine if a backlink might be toxic. A page with a high Citation score but low Trust may be one you want to avoid getting a link from, as there are many links pointing to the page but overall they’re untrusted.
Topical Trust Flow, a newly available feature of Trust Flow, is also worth noting. It breaks down the links of your site by industry to identify what comprises your Trust Flow. Then, you can check out the Topics tab for a more in-depth look at the exact number of external backlinks and linking domains from that industry. This can be great for scoping out PR opportunities; you can filter the chart by industry to get more specific topics. For example, filtering by “computers” gives you topics about web design, Internet resources, open source, domain names, shareware, and dozens more.
The Clique Hunter is another clever tool that you can use to see where your competitors may have the edge on their backlinks. Input up to 10 different domains or competitors to see where they are getting their backlinks and where you have missed out within your industry. Needless to say, this is another little gem from Majestic that can be used for link prospecting.

Figure 11-26. Majestic backlink report
LinkResearchTools.com
European-based Cemper.com offers a link building toolkit called LinkResearchTools. The toolkit is a report-oriented system that provides qualified link data in real time from 23 sources. Some basic SEO metrics include the number of links to the page and domain, linking root domains (domain popularity), theme of the site, and CEMPER Power* Trust™ metrics. In addition, LinkResearchTools reports can be customized to international search engine, language, and country settings. When analyzing links from a domain in such great detail, you can find potential backlinks, identify link networks, analyze competition, and discover toxic and suspicious links.
LinkResearchTools includes a number of tools for different use cases. The Quick Backlinks and Quick Domain Compare tools provide the top links of a domain/page and enable you to compare SEO metrics of other domains within a minute. The Backlink Profiler and the Juice Tool allow you to analyze link profiles for any domain. The Link Juice Thief, Missing Links Tool, and SERP Research Tool help you identify new link prospects. Link Alerts monitor link growth for you or your competitors. The Common Backlinks Tool is a hub finder that helps you find sites that are powering your competitors. The Strongest Subpages Tool identifies a domain’s strongest subpages. The Link Juice Recovery Tool helps a webmaster identify missing/broken pages with external links. The Contact Finder finds contact information for domains by searching the site for email addresses, social media profiles, or contact forms.
The Link Detox tool is primarily used to identify bad links easily and create the necessary file to submit to Google’s Disavow Links tool. The data-driven organic Link Detox Genesis algorithm helps locate unnatural links by analyzing a website link profile and automatically classifying each link as toxic, suspicious, or healthy. Furthermore, the Link Detox Risk Metric assists with link risk management and provides safe search engine optimization. Webmasters should allocate the time and effort to clean toxic and suspicious links from their sites’ link profiles.
Figure 11-27 shows a screenshot from the Competitive Landscape Analyzer. For competitive research, LinkResearchTools includes the Competitive Landscape Analyzer, Competitive Link Detox, Competitive Link Velocity, and Competitive Keyword Analyzer. All relevant information and SEO metrics are crawled and displayed in clear graphics. The overview gives you a qualitative statement of how your link profile appears compared to the top competitors in your niche/industry. In this figure, nine competitors are analyzed by their Power*Trust score, which measures both the Power and Trust of a site.
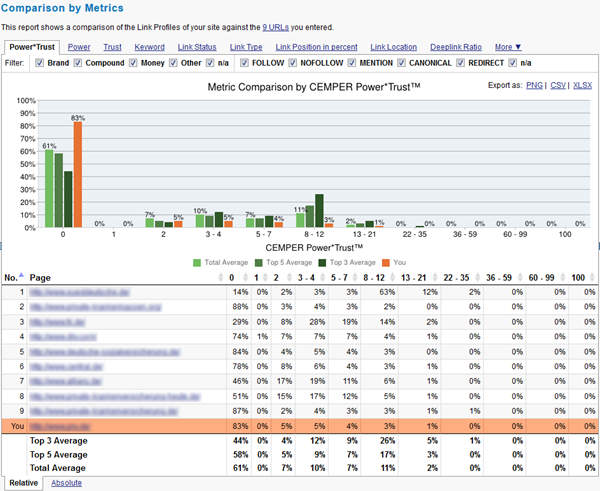
Figure 11-27. LinkResearchTools report
Ahrefs
Ahrefs offers a comprehensive website analysis toolset with a strong focus on backlink analysis. Ahrefs builds its own index and crawler, which can crawl billions of pages daily and update databases with fresh backlinks found on the Web every 15 minutes. With this capability, Ahrefs is well known as having the largest index of live backlinks and covering universal results (all top-level domains included) to support users worldwide. Ahrefs also designs its own 100-scale AhrefsRank, which has a strong positive correlation value with the PageRank model for you to easily measure and compare your domain (or link) quality to your competitors.
Ahrefs Site Explorer is a link analysis tool that helps you perform granular analysis on link profiles for your or your competitor’s sites. With this tool, you can identify where the site links are coming from, detect whether any problematic backlinks (or unnatural links) are linked to the site, determine how many backlinks are newly acquired or lost in 60 days, and explore new link-building opportunities by reverse-engineering your competitors’ backlinks. The SEO report allows you to rapidly evaluate on-page SEO performance of the site. This often involves a thorough examination to assess the site’s accessibility to the search engines, and the SEO-friendliness of the site information architecture.
Ahrefs tools are straightforward, with a neat UI and easy-to-read data visualization (see Figure 11-28). Social metrics including Facebook shares/likes, tweets, and Google +1s are available at both the domain and link level. Filtering options are available for almost every metric, which makes the tools highly customizable. Data is downloadable in CSV format for further data sorting or uploading to third-party research tools, while the backlinks report is available in PDF format.

Figure 11-28. The Overview report under ahrefs
Raven Tools
Raven provides another comprehensive toolset for link development. One of Raven’s tools is the Link Manager, which tracks links that you plan on acquiring, have requested, or have successfully built (see Figure 11-29). The Link Manager also includes conversion and ROI tracking. It will go out and automatically check the identified pages to see whether you have acquired a link on them, and return the results—thus automating the process of identifying targets and tracking the progress of your campaign on an ongoing basis.
Raven also offers Research Central, which mashes up data from Majestic, Open Site Explorer, and SEMRush. Research Central generates a screenshot of the site you’re researching and displays results for the domain’s Authority/Ranking, Social Metrics, Site Metrics, and Keywords Metrics. Raven also offers a tool called Site Finder that allows you to enter a keyword phrase, and then the tool will automatically review the top 10 Google results for that phrase and evaluate the value of a link from each of those pages.

Figure 11-29. Raven Tools Link Manager
LinkBuilder and LinkGalaxy
One commercial alternative for link analytics is Rio’s LinkBuilderTM solution powered by its LinkGalaxy link collection vehicle, which is geared more toward enterprise-class clients.
Link quality is much more important than link quantity, and the LinkBuilder feature provides multiple unique views to analyze and prioritize which link hubs are the most critical to obtain, in order of importance.
Figure 11-30 shows a LinkHub analysis report from the Rio LinkBuilder tool.
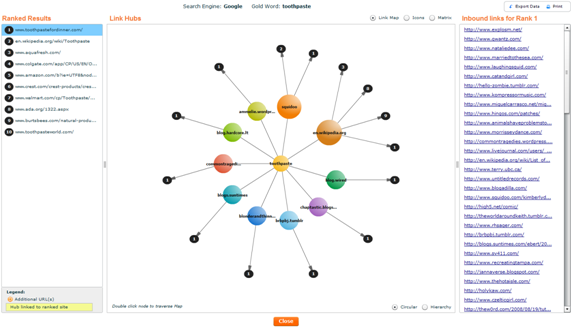
Figure 11-30. Rio LinkBuilder LinkHub Analysis for “toothpaste”
Conductor Searchlight
The Conductor Searchlight platform transforms a brand’s web presence in “unpaid” channels (e.g., organic search, content, and social) into a powerful acquisition method resulting in meaningful traffic and revenue increases. The technology gathers data from the Web to deliver insight into where a brand’s content is getting discovered, how its competition is being found, and what is needed to win the “unpaid” media war.
Conductor Searchlight makes use of the Open Site Explorer data set from Moz. A sample report is shown in Figure 11-31.

Figure 11-31. Conductor Searchlight
Exalead
Exalead has developed a European search engine that offers the capability to use a link: operator. What makes Exalead particularly interesting are the advanced filtering capabilities this operator provides, as you can see in Figure 11-32.

Figure 11-32. Exalead link: data
Note the ability to specify options such as language and site type, which could be useful for segmenting link data. These filters are shown in a red box.
Measuring the value of a link
People often ask what the value of a particular inbound link is. There is no simple way to answer that question, but there are some metrics that can give you a sense of a link’s importance.
These are the primary indicators of a link’s value:
- Where does the linking page rank for the term/phrase you want to rank for?
-
If the page is ranking #1 at Google for sliced bread and you want to be #1 at Google for sliced bread, guess what? That’s the #1 most valuable link you can get. Keep going down the list to about positions 25 to 30, and you’re still getting solid gold in link value.
- Where does the linking page rank for one to two important, competitive terms in its
<title>tag? -
This will give you a very solid idea about how much overall link juice and respect the search engines are giving the page. It is also a good way to identify the global link value that could be provided.
- Where does content on the linking domain generally rank for competitive terms in its pages’ respective
<title>tags? -
As in the preceding list item, we’re trying to identify how positively the engines view pages on the domain. If the pages generally rank in the top 20 results, you can rest assured that search engines think the domain’s value is pretty high, and that links from that domain will pass significant value.
- How many keyword phrases do the linking domain and page rank for in the top 20 results?
-
Sites that rank for a very small set of keywords may be overoptimized and thus have lower-value links, whereas sites that rank for a larger set of relevant keywords provide your site with more relevant links.
- Does the linking site carry any brokered sets of links?
-
Sites that sell links may lose their ability to pass link authority. This really applies to any type of low-quality, manipulative linking. If you can see it, chances are that Google might see it someday too. In addition, Google may penalize a site retroactively for repeated bad behavior, even if that behavior has been stopped.
- What is the relevance of the linking page/site to your target page?
-
Answering this question requires you to think critically about the visitors to both the potential linking page and the domain. If the relevance of the subject matter to your site is high, the link will provide more semantic and topic-specific value.
- When was the last time Google crawled the page?
-
A fresh timestamp is a great indicator of the importance of the page. The older the page is, the less likely it is to be relevant to a modern search query. You can check a page’s timestamp by looking at its cache in Google.
- Inlinks to page
-
Next, look at the links to the specific page you want to get a link from (or perhaps that already links to you). You want to know whether the domain links into this individual page heavily, or whether it is practically an orphan. Also, the more traffic that site gets, the more likely it is that the traffic will pass on to your page. See whether it is a page that other sites reference, which can help illuminate its potential value.
-
The Hilltop algorithm, adopted by Google in 2003, essentially says that if your site is listed along with other relevant and quality sites within a niche on a site, the site that lists it is considered a topical authority, and your site is given more value. An example might be “10 Startups to Watch in 2014” by Entrepreneur Magazine. If your site is listed as one of the “startups to watch” along with other high-quality startup sites, you would benefit from the authority conferred by Entrepreneur Magazine and your site would be valued more highly.
These are some secondary indicators of link value:
- Links to high-ranking competitors
-
Although this isn’t always an indication of direct value, it can be a good signal. Your competitors are obviously ranking partly based on the strength of their links, so researching those sources can provide insight into where they derive that value.
- PageRank of the domain
-
Though Google’s PageRank of a domain is not a value you can get at directly, you can approximate it by looking at the PageRank of the website’s home page. The home page’s PageRank should give you an idea of whether the site has been penalized and of its overall link authority (i.e., the potential value of its links). You can also assess a domain’s link strength using Moz’s Open Site Explorer tool, which we discussed earlier in this chapter.
-
A PageRank 6 (or higher) home page clearly has some link love and respect, while PageRank 2 obviously has less; a gray bar can be a red flag; and a PageRank 0 tells you that the domain is either new or completely invisible. However, as link-building expert Eric Ward points out, avoiding lower PageRank domains simply because they are PageRank 3 or 4 is not necessarily a good thing, as you could be missing out on very relevant links that, in volume, contribute to your relevance.
NOTE
PageRank may decline as a link quality signal over time. Google’s John Mueller noted in an October 2014 Google Webmaster Central Hangout that the company had not updated the PageRank ratings available to third parties (Toolbar PageRank) for over a year—that is, since October 2013—and may well not update them again in the future.
- Inlinks to domain
-
If a site has been picking up many new links over the past few months, it might be a much better candidate than the PageRank or other link data might indicate. This is a pretty indirect measurement, but it’s not completely useless. However, the number often takes into account lots of links from a single domain, so it can be misleading.
- Number of external links on the page
-
Pages generally pass some of their link authority to each page they link to. Therefore, if you have a link from a page with 10 outbound links, it is far better than having a link from an equivalent page with 100 outbound links, so this is a parameter worth knowing about.
- Domain Authority/Page Authority
-
Domain Authority and Page Authority are two of the main metrics Moz uses to estimate the link authority of the site. Domain Authority is a combination of over 40 signals intended to track the overall “strength of a website” as compared to other sites. Page Authority measures similar metrics but is intended to rank the overall strength of individual pages as opposed to the domain overall. Google has stopped updating Toolbar PageRank, so many in the industry use Domain Authority and Page Authority metrics instead of PageRank.
- Citation Flow and Trust Flow
-
Citation Flow and Trust Flow are metrics from Majestic. Essentially, these flow metrics look not only at links to a given page, but also to the links that point at those links, and so on up a “chain” of links. They calculate a rating that reflects not only the number of links flowing through to a URL, but also their power and trustworthiness. Citation Flow looks at the “strength” of the chain of links leading to a URL, while Trust Flow looks at the chain’s trustworthiness.
- LRT Power*Trust
-
As another alternative to Google’s PageRank, Power*Trust (or CEMPER Power*Trust) is a metric calculated by CEMPER’s LinkResearchTools that combines the power (or authority) and trustworthiness rankings from many of the aforementioned tools into a single metric. Power*Trust is a useful metric to use to quickly gauge the overall influence of a set of links pointing to a URL. It combines data from many sources—including Google, Moz, and Majestic—in real time.
Ranking
Many people get obsessed with checking their rankings. While rankings do have some correlation with traffic, you shouldn’t spend too much time checking them. For one thing, many tools that are available today for checking rankings scrape Google results, which is against Google’s Webmaster Guidelines. Google results vary by user, and the scraped results do not represent what everyone is seeing—because there is no such thing as a search result that “everyone” sees at this stage.
Rankings data can be helpful in a few scenarios, however:
-
Where a #1 (or a very high) ranking for a trophy search term provides brand value
-
When there is a sudden significant change (such as a move from position #5 to #50, or a similar change in the other direction)
-
Where a long-term trend can be established, such as a steady improvement in position, or a steady decline
-
In aggregate, where you can measure a site’s overall activity and popularity
While evaluating this data, bear in mind that the search engines are constantly being fine-tuned. Google is believed to adjust and test its algorithms every day. This can result in a lot of movement in rankings on a regular basis, and this type of movement is usually meaningless from an SEO perspective.
What follows are some examples of tools that allow you to obtain rankings data. First, you can get the data directly from Google Search Console (see Figure 11-33).
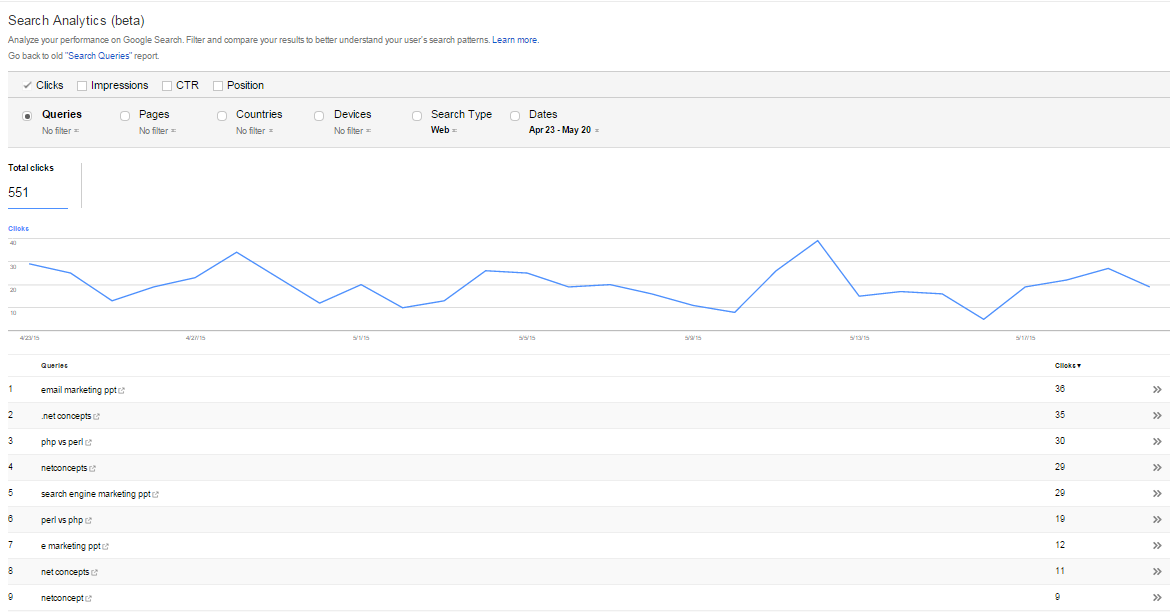
Figure 11-33. Top search queries report
Google handily shows the top queries for which your site came up, as well as the queries that were clicked on the most. This is nice data to give you a snapshot of where things stand, and you can download it into a spreadsheet.
AuthorityLabs
AuthorityLabs provides an array of reporting tools that help you track rankings across the major search engines. One reporting tool of note is its new Now Provided tool (see Figure 11-34), which is positioned as an answer to the difficulties brought on by the “not provided” update of 2013. Now Provided uses a mixture of Google Analytics data, competition data, and a few volume and ranking metrics to seek out your most important keyword opportunities. This helps you understand how much traffic a keyword is getting you. Another feature of the tool allows you to see the number of pages sending traffic to your site on any given day.
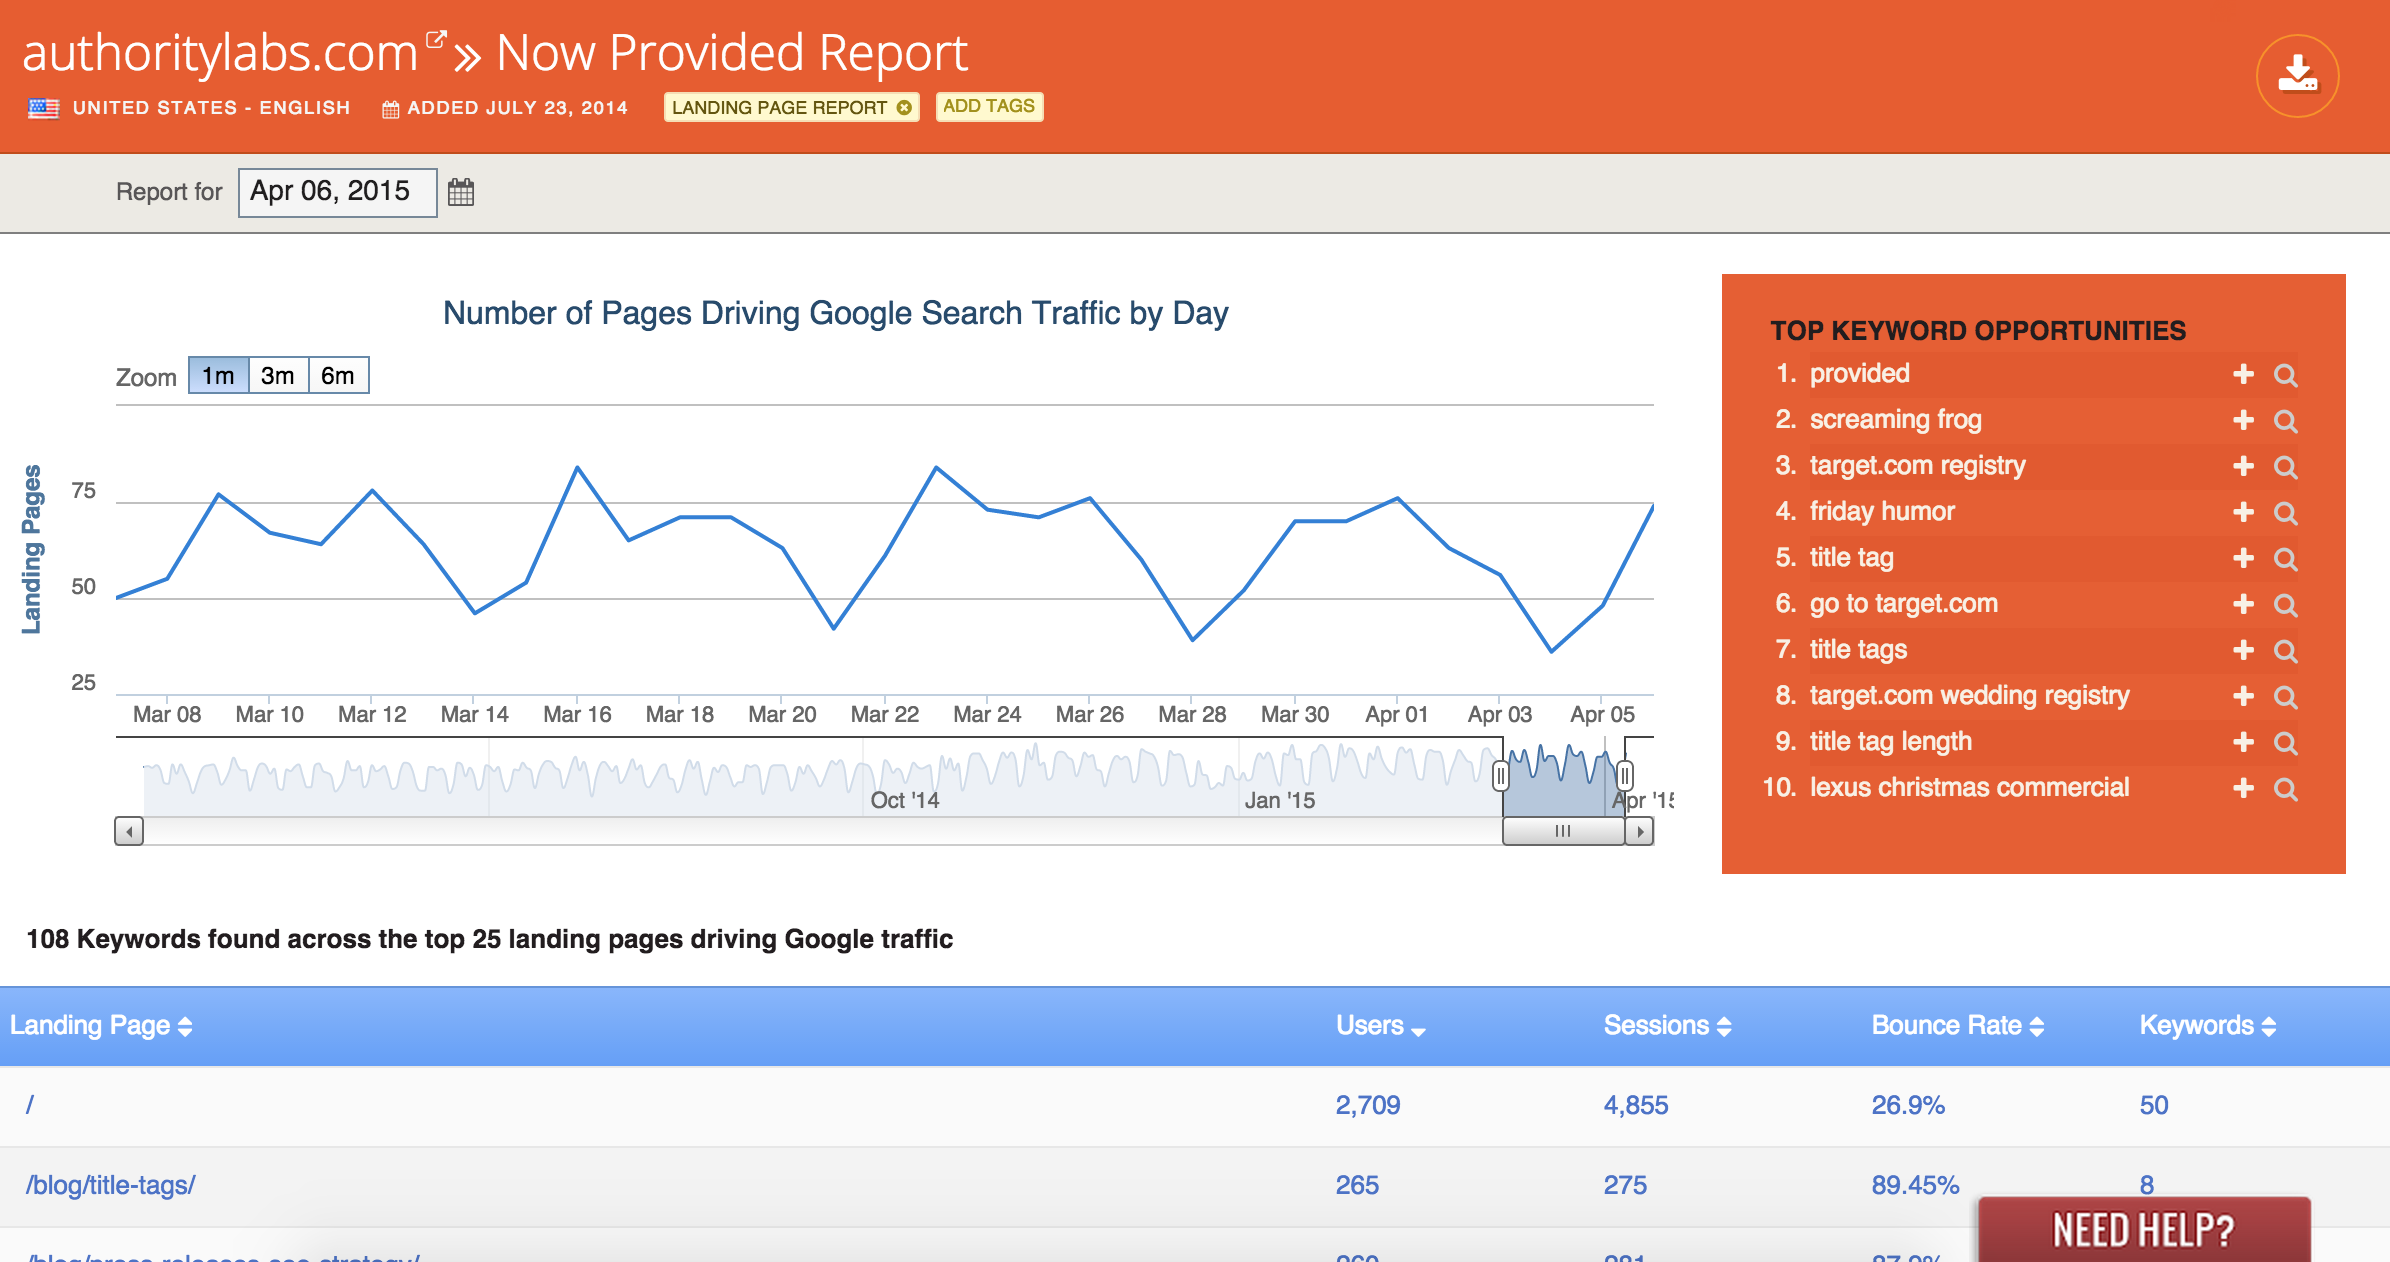
Figure 11-34. AuthorityLabs Now Provided report
Shelf space
Shelf space is an SEO metric that assigns a fraction of the total SERP to each listing—for example, 33% for the first listing, 10% for the second listing, 0.0000001% for the 123rd listing, and so on. Each point of presence yields more shelf space. Links to your site, images or videos in the results, and anything else that appears on a search result page all count toward shelf space. The sum of the shelf space for all of the listings for a particular query is 100%.
Shelf space summarizes the value of several listings on the same SERP. It allows you to easily examine the trend of your shelf space over time and compare it to that of your competitors. You can also compute your average shelf space across 1,000 keywords. If it’s 10%, you know that you control 10% of those SERPs.
Here are some tips:
-
When looking at SERP shelf space (or rank), treat your social media and user-generated content listings (Facebook, YouTube, etc.) as your own, including in “universal search” results.
-
In reporting, draw a distinction among the shelf space controlled by your social media pages, your preferred landing pages, your other web pages, your competitors’ pages, and independent (Wikipedia, government, university, etc.) pages.
-
If you care about more than a few keywords, or if you want to get a lot of long-tail traffic to your site, categorize your keywords and queries. Typical categories include branded versus nonbranded, product, subject or topic, and the geographical location mentioned in the query.
-
Benchmark your SERP shelf space changes against your competitors. Then you can tell whether a change is due to something you did or due to a change in Google’s algorithms.
-
YouTube and Facebook are search engines, too, so you should care about your rankings there just as much as you do on Bing.
-
When you’re dealing with paid/organic interaction, the following simple formula estimates the cost per incremental click (CPIC; a.k.a. cost per incremental conversion) for paid search above and beyond what organic would drive to your site in the absence of paid:
CPIC = CPC / (1 – shelf space)
You can estimate CPIC at the query level or at the category level, as just described. Paid search marketers can optimize their campaigns to minimize their measured CPIC, truly maximizing their return, rather than choosing the ads that are best at shifting clicks from their own organic to paid listings.
SEO Platforms
Visibility into your and your competitors search rankings over time is an important indicator of your search landscape and share of search. Here are two examples of companies that offer SEO platforms:
-
Conductor offers Conductor Searchlight, which can crawl your website, enable visibility into your competitive search landscape, and bring on- and off- page data (such as backlink and on-page factor analysis) together in one place.
-
Rio offers SEO Search Analytics, which uses the company’s patented SEO Audit Score methodology to measure the SEO health of your websites.
Crawl Errors
Complex websites will ultimately develop errors. For example, a publisher might move a page and forget to redirect the old page to the new page, or make a mistake in the robots.txt file that prevents the crawling of key parts of her site. Or someone might implement a link to the publisher’s site incorrectly by linking to a page that does not exist (possibly due to a typographical error).
Tools from the search engines
All of these errors are easy to diagnose in either Google Search Console or Bing Webmaster Tools. Figure 11-35 shows the Crawl Information page in Bing Webmaster Tools.

Figure 11-35. Bing Crawl Information page
You can see that Bing will provide data on 400–499 errors, 500–599 errors, 301 redirects, 302 redirects, robots.txt exclusion, DNS failures, and connection timeouts in this report.
Google provides similar data, with some notable differences (see Figure 11-36).

Figure 11-36. Google crawl errors
Notice the additional types of errors provided by Google. In addition, if you look at the 404 report in Google Search Console, you have the option of seeing what pages link to the page generating the 404 error, as shown in Figure 11-37.
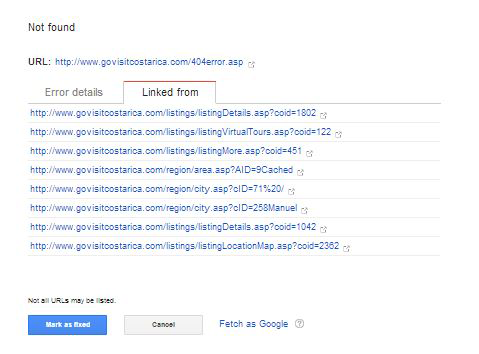
Figure 11-37. Google 404 errors report
The great thing about the 404 reports in both tools is that they can help you spot pages that have been implemented with the wrong URL on your site, or instances when someone links to one of your pages using the wrong URL. In the latter case, as we suggested in Chapter 7, you can 301-redirect the page that received the bad link to the correct page, and pick up an easy link. In short, 404 errors provide great opportunities to request updated links from sites linking to old URLs.
Another problem occurs when a page no longer exists but the web server erroneously returns a 200 status code. This is sometimes referred to as a soft 404, and it can occur when you’ve created a custom 404 landing page. In these instances, a “Page not found” error will redirect to a valid page, which results in an HTTP 200 “OK” result. This can hide the presence of broken links. A soft 404 can limit a site’s crawl coverage because the landing page URL may be indexed instead of the intended (but missing) unique content pages.
So in addition to traditional HTTP 404 errors, examine your reports for HTTP 200 errors and give them the same weight as a standard 404. Google Search Console provides 404 and 200 error codes in its reports, and can be helpful for identifying broken links that need to be 301-redirected.
Third-party tools to check for crawl errors
There are some excellent third-party tools available to help you see how a search engine crawler will look at your site. One of these is SEO-Browser. This tool can be useful during a technical SEO evaluation of a site, or when you are debugging site indexation problems. Figure 11-38 shows the basic view from SEO-Browser for the TripAdvisor home page.

Figure 11-38. Trip Advisor home page in SEO-Browser
Interestingly, this report indicates that the website shows that the surfer used an unknown browser. It might be interesting to determine why that is happening. If you look at the Amazon home page using the Advanced mode, you see some interesting data there as well (see Figure 11-39).

Figure 11-39. Amazon home page in SEO-Browser Advanced mode
The Advanced view provides a wide range of stats above the view of the web page itself.
Another excellent tool is the Moz Crawl Test tool, which provides an extensive set of statistics on any website you choose to check. Figure 11-40 shows a small sample of the data provided.
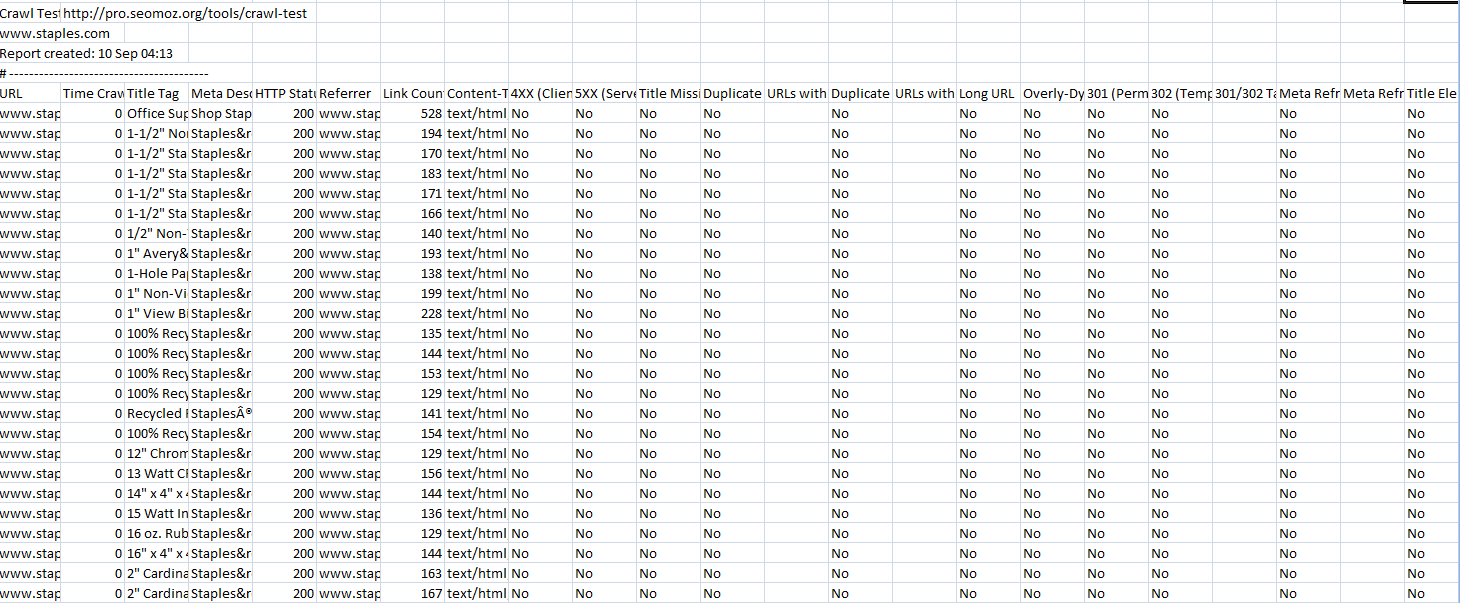
Figure 11-40. Moz Crawl Test tool
The tool also provides a detailed look at some of the more important pages on the site, including the indexing status in the major search engines, the most important keywords, metadata, and the number of internal links to the page.
Tools such as these that provide a crawler’s-eye view of your web page or website can be effective in helping you to rapidly diagnose problems with your site. Other companies that offer proprietary crawl analysis tools are:
-
Screaming Frog, shown in Figure 11-41

Figure 11-41. Screaming Frog tool
There are free tools that offer a lot of functionality as well. These include:
Tracking the Blogosphere
The blogosphere is a very dynamic part of the Web—always fresh and constantly updated. News tends to break in the blogosphere, and in Twitter, before it hits mainstream media or the Web at large. Tracking the blogosphere will help you stay current on both your industry and the SEO industry. Major influencers tend to hang out in the blogosphere as well as have their own blogs. Identifying these influencers is the first step to reaching them.
Here are four major uses for tracking blogs:
- Reputation monitoring
-
We talked earlier in this chapter about the importance of tracking your domain and brand mentions across the Web. Reputation monitoring takes this idea one step further, where you look to identify problems and risks to your reputation as they materialize on the Web. For example, knowing when someone starts to write negatively about your brand somewhere on the Web is important. Tracking down those issues early and addressing them quickly is a wise thing to do.
- Tracking buzz and public relations campaigns
-
A closely related activity is tracking buzz and the response to your PR campaigns. When you make a major press push of some sort or you succeed in getting a write-up about your website on an influential blog, you should monitor the ripple effect across the rest of the Web.
-
Using the type of brand tracking we’ve already discussed can be a great way to do that. For example, did the number of mentions you received on the Web this week increase significantly over the number of mentions the week before?
- Identifying potential influencers
-
Identifying influencers is a key part of link building. As we’ve discussed throughout the book, establishing yourself as a recognized expert is an important part of your content strategy. Part of that is creating world-class content, but that won’t mean much unless you get the word out somehow. A great way to do that is to reach out and develop relationships with the key influencers.
- Competitive analysis
-
If you can do this type of research for your own site, why not do it for your competitors’ sites? You can see reputation problems that are developing for them, or see the impact of their media campaigns as they roll them out.
Tracking Your Blog(s)
Blogs offer numerous benefits to the online marketer. They can offer a great way to position yourself or the team behind your site as experts. For that reason, you can reach major influencers as well as a broad audience of people at the same time. This can become a nice source of links as a part of your ongoing content and link development efforts.
Blog links
There are a few ways to extract data on the number of links to your posts. You can also use either Google Search Console or Bing Webmaster Tools (see Figure 11-42) to track the number of links to your blog.
As we outlined in the discussion on link tracking, you can use these tools to get link data on your website. You can also take a more granular look at your data. For example, if you have a blog at http://www.example.com/blog, you can pull a report from Bing Webmaster Tools (or your tool of choice) and sort your spreadsheet on the URLs of the pages receiving the links. When you are done with this, your data might look something like Table 11-1.
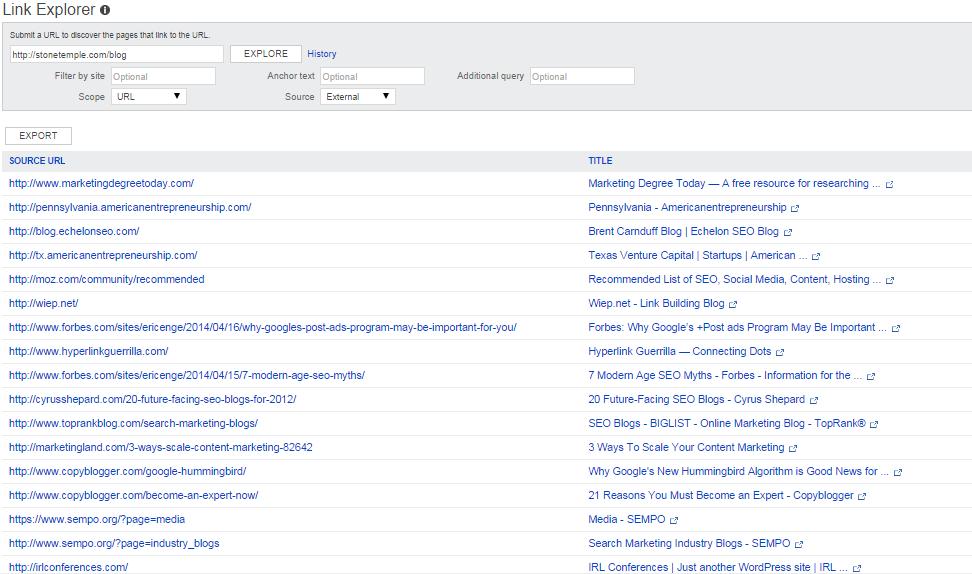
Figure 11-42. Inbound blog links crawled from Bing Webmaster Tools
You can then find the end of the list of links that go to the blog and see how many total links you have. So, for example, if the last link is found on line 12,367 of the spreadsheet, the total number of links to the blog is 12,367 – 8,437 = 3,930. To go further, you can start analyzing what parts of the blog have the most links as well.
Google Alerts
A good way to monitor search engines’ awareness of your company, brand, and products is to set up alert notifications. Use Google Alerts to get automatic emails when there are new results for the keywords you specify. Note that sometimes this “news” can be outdated and redundant.
In addition to monitoring your own web presence and reputation, it pays to keep tabs on your competitors’ keywords, rankings, links, traffic, and news. Consider setting up alerts for your competitors as well as your own brands. You may even want to sign up for your competitors’ email marketing messages so that you can monitor the news and offers they are sending to their customers and prospects.
Search Engine Robot Traffic Analysis
Understanding how robots are spidering their sites is another thing that expert SEO practitioners should know how to do. For one thing, spidering frequency is a clue as to which pages on your site have the highest PageRank and trust, because Google generally crawls the Web in roughly reverse PageRank order. It can also help you detect spidering problems on your site.
You can use the tools we discuss in this section to help you find potential spidering issues, and analyze how important the search engines consider your content to be. You should be looking for clues of SEO problems, such as robots.txt blocking the crawlers, architectural problems, or even signs of a penalty (as might be signified by a big drop in crawling frequency).
However, it is important to know that this data will not tell you everything. For example, the fact that a web page was crawled does not mean it will be placed in the index. The page will still need to pass some additional tests to achieve such placement (such as having unique content and enough links to justify its inclusion).
For pages that are indexed, you can look at how often the spiders visit/crawl your pages versus how often the engine actually shows a new version of your page in the index. To do this, look at the last cached date the search engine reported, and compare it with your crawling data.
Tools that perform log analysis include Webtrends, IBM Unica NetInsight, and Lyris HQ Web Analytics.
Other logfile analysis programs include:
What is crawl efficiency and why is it important?
Analyzing search bot behavior involves three main goals:
-
Ensuring all of your important pages are found by the bots
-
Preventing PageRank from being diluted by duplicate content problems
-
Getting time-sensitive content (ads/promotions, breaking news) indexed as soon as possible
Crawl efficiency is about helping search bots reach these goals. To do this, you must analyze their behavior on your site, understand the obstacles they face, and remove any roadblocks that prevent successful indexation.
Manually removing duplicate content and providing an XML sitemap are an excellent ways to address crawl efficiency problems. If the XML sitemap is comprehensive, and there is enough PageRank flowing through the site, the most important pages will be found. If the XML sitemap includes additional metadata, like how often specific pages are changed, and this metadata is accurate, then your new and time-sensitive content can be discovered quickly.
Addressing duplicate content properly is extremely important, from the perspective of both increasing crawl efficiency and improving the PageRank of canonical pages. As the PageRank consolidates, canonical page rankings will increase, and the result will be more clicks and more sales.
Google Search Console
You can also get detailed information about spidering activity on your own website using Google Search Console. Figure 11-43 shows the statistics for one site.
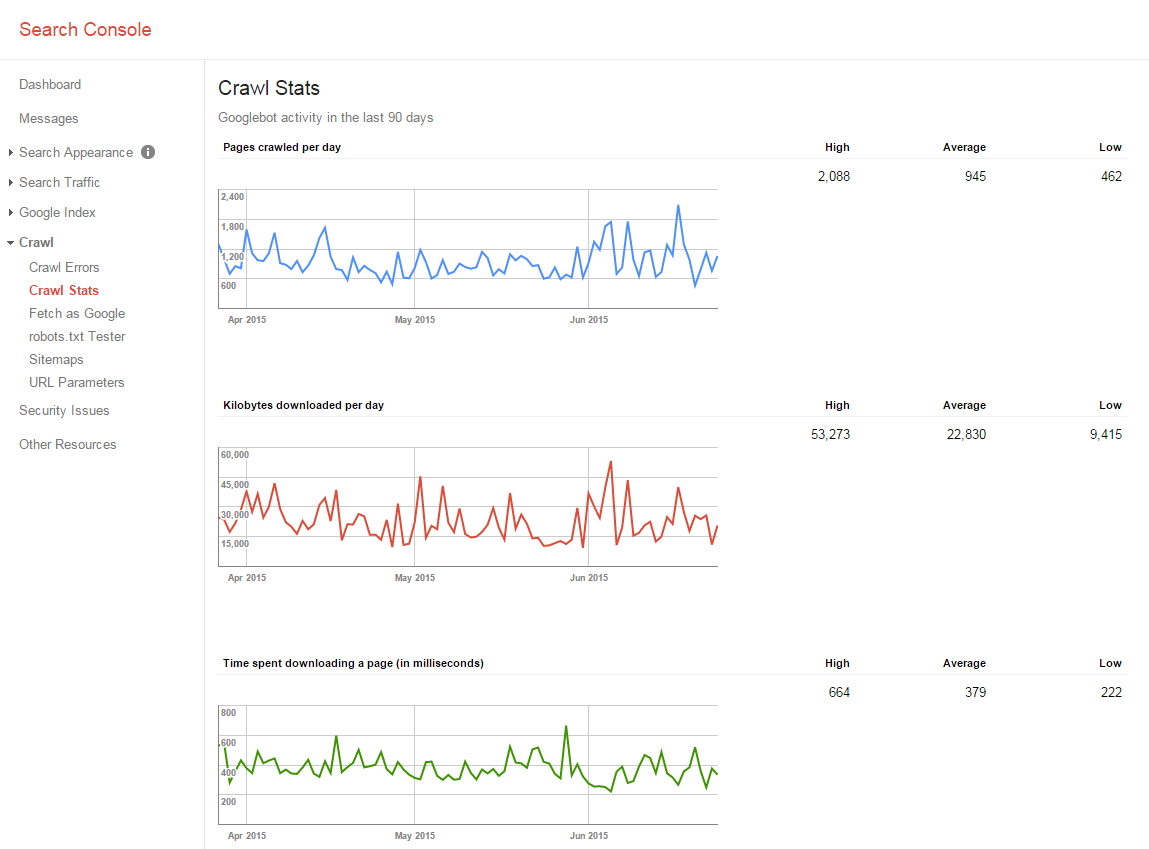
Figure 11-43. Google Search Console spider activity report
This report provides a great visual snapshot. It is most valuable when you see major changes in the data. For example, if you change your hosting provider, and the page download time subsequently jumps upward, this may be an indication of a problem with the new hosting company. When you see these types of changes, it can be a flag that something happened with your website, and you should investigate it.
Web Traffic Comparison
When you set your goals for growing your online business, you may, for example, target a sales increase of 50% from search referral traffic. However, in setting those goals you may also want to take into account where your competitor is relative to you. If your competitor has twice your traffic, for example, you may not be happy with a goal to increase yours by 50%.
In addition, when you measure the results of a completed SEO campaign, it is useful to see how much your competitor grew during the same timeframe, because you can use this data to set your goals for your next campaign. For example, if you grew your traffic by 50% and your competitor grew by 100%, you may want to adjust accordingly.
Several tools offer ways to compare the traffic of different websites. However, each tool has accuracy issues and significant bias.
For example, Alexa relies on data obtained from users who have the Alexa toolbar on their systems. This is a limited number of users, and of course, only certain types of people are willing to have the toolbar on their system. This introduces a bias to the data, which means it is not completely reliable. In addition, you can get software to artificially inflate your Alexa rankings by spoofing the Alexa toolbar. This is not something you should do, but you should understand the issues with these types of measurement systems.
Other companies that offer traffic measurement services, such as Compete and Quantcast, suffer from similar problems with bias and limited sample sites. Note also that all of these data sets are limited to the United States. However, these tools still have value when you are comparing the traffic of one site to another in the same market space (perhaps you and your competitor) because the bias should affect both sites equally.
Alexa
Alexa provides you with a quick and easy look at how the traffic for two sites compares, as shown in Figure 11-44.

Figure 11-44. Alexa traffic comparison
Underneath the chart you will notice a lot of additional data on SearchEngineWatch.com (the site listed first in the search box), such as the most popular content and where the readers are coming from.
Compete
Compete offers both a free and a paid service. As with Alexa, you can get basic traffic data on a site or compare traffic between sites (see Figure 11-45).
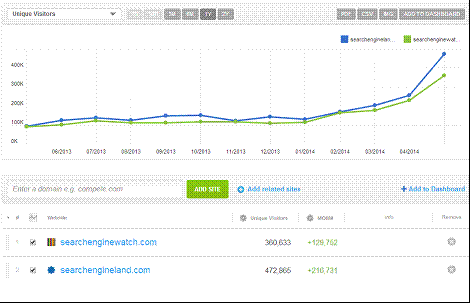
Figure 11-45. Compete traffic comparison
Compete also offers additional data for a fee. This includes data on the major keywords driving traffic to a site (see Figure 11-46).

Figure 11-46. Compete keyword data
Compete leverages multiple sources, including ISP, panel, and toolbar data, and has a total panel of about 2 million users. Compete’s diverse data sources help in reducing bias in the data.
Quantcast
Quantcast is a competitor of the other services we’ve listed. With Quantcast, you can get detailed data about individual sites.
The demographic data is interesting, as well as the other sites that users visit. Quantcast collects “pixel data” from scripts running on websites that are part of the program. It claims that these sites represent about 50 million visitors per month. Quantcast supplements this data with data from ISPs. Figure 11-47 shows a sample report for USA.gov.
Quantcast also offers publishers an opportunity to participate in its Quantcast Advertise for Publishers program. This program enables publishers to make public much more accurate data through Quantcast and requires a tracking tag to be placed on their sites. Publishers who sell advertising on a cost-per-impression basis can use this as third-party validation of their traffic levels.
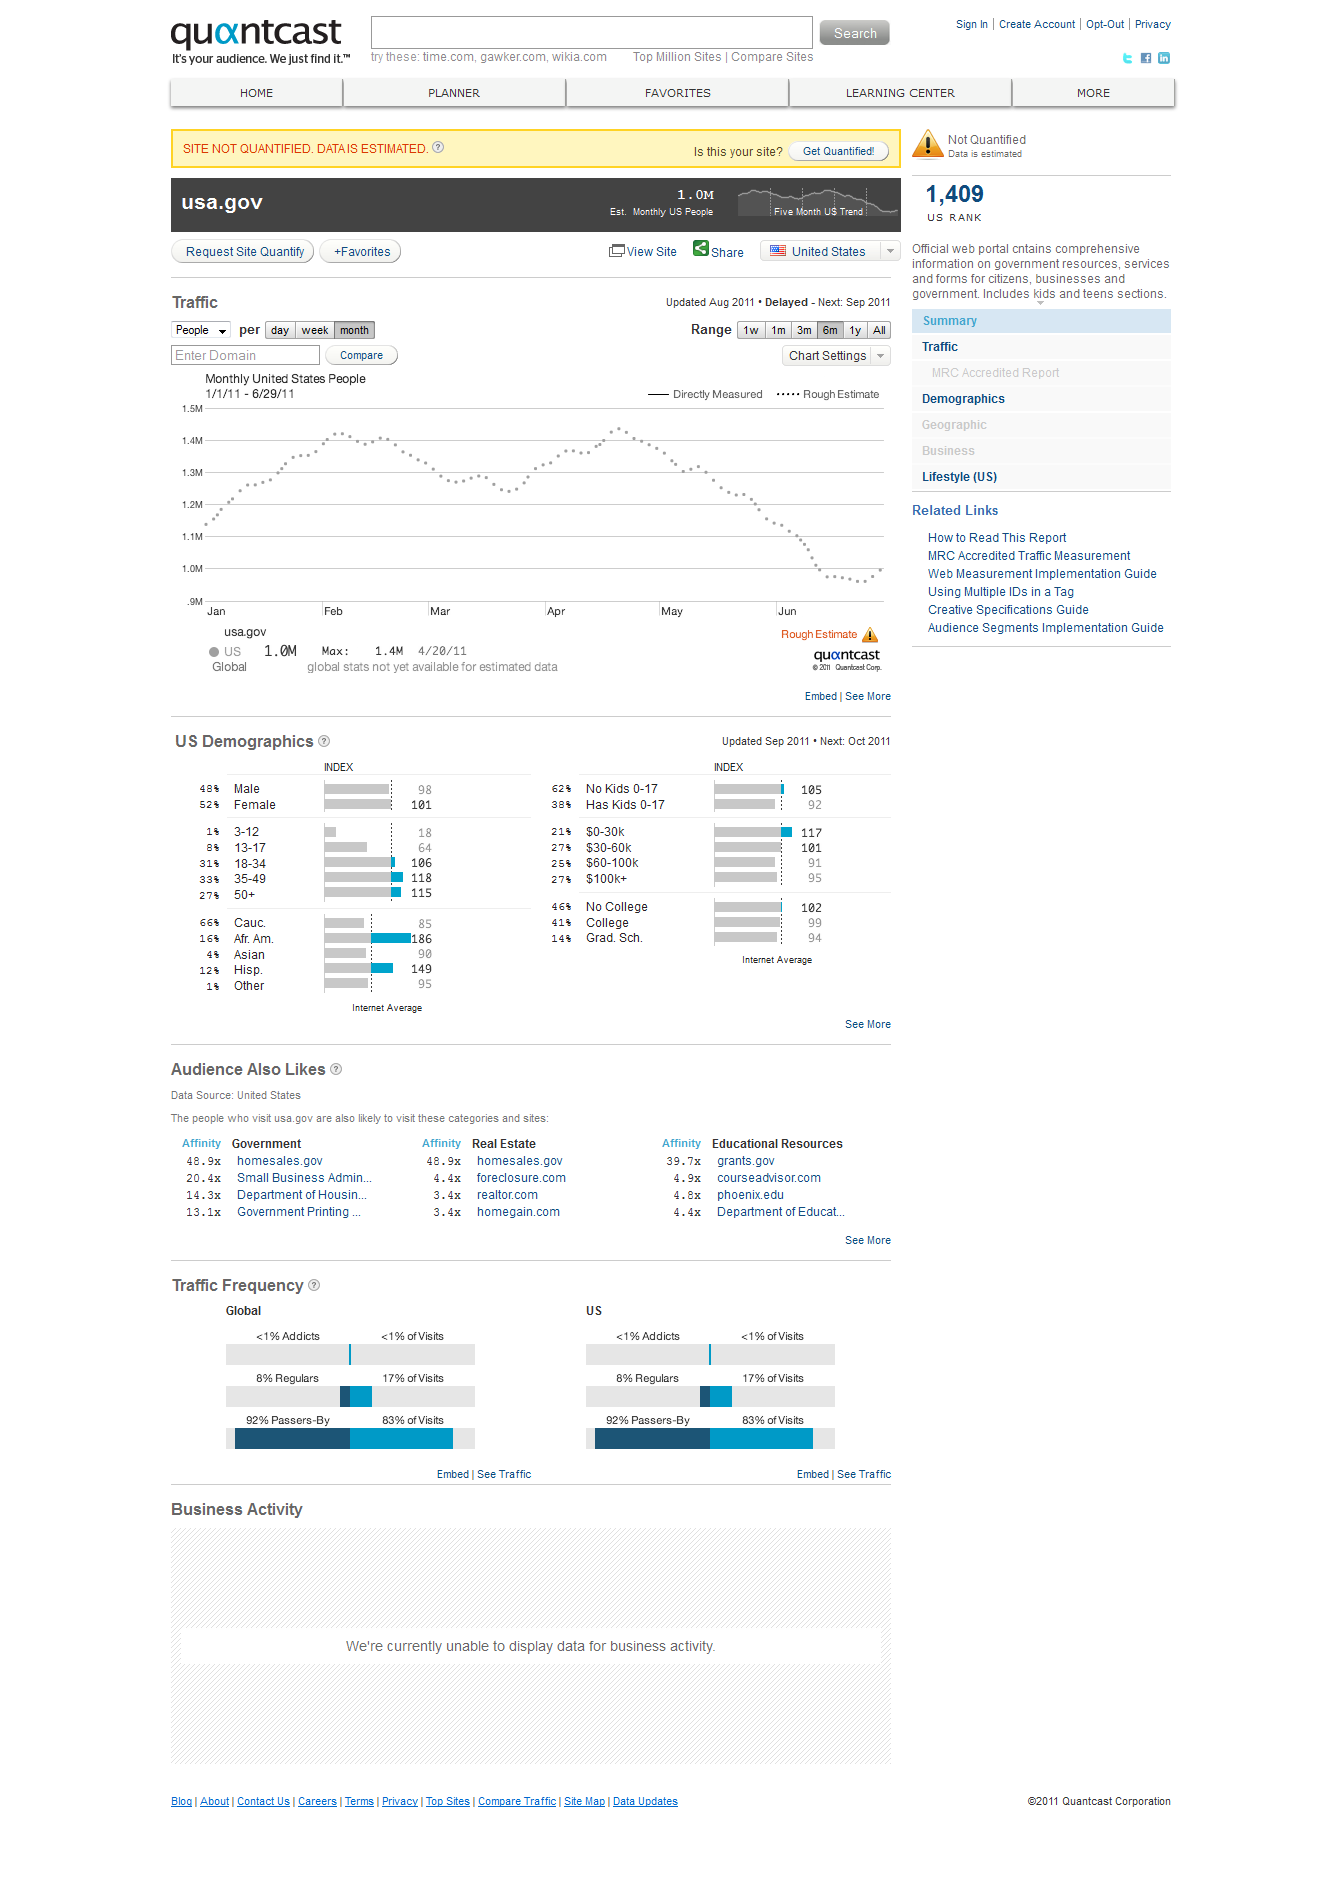
Figure 11-47. Quantcast site data
Temporal Link Growth Measurements
Since Google released its patent application on historical information in March 2005 (read more at http://moz.com/blog/google-patent-on-historical-data), search marketers have recognized that trends in temporal link and content analysis do have a real impact on rankings.
The engines are trying to measure patterns—they’re looking for indications of increasing or decreasing relevance and authority that temporal trends provide. They want to identify several specific items:
- Content growth patterns
-
How often does a particular site tend to add new pages?
- Content update patterns
-
How often are documents edited and updated?
- Link growth patterns
-
How often do new links appear pointing to the site?
- Link stagnation patterns
-
Does the number of links to the site stagnate or decrease?
The engines aren’t interested only in how many links pointed to the site today versus yesterday (or how many pages were added); they are also fundamentally interested in tracking patterns over time. Figure 11-48 and Figure 11-49 depict some example graphs showing the rate of new external links (and in the last two instances, pages) created over time, with some speculation on what the trends might indicate.

Figure 11-48. Interpreting new external link data

Figure 11-49. More link data speculation
These assumptions do not necessarily hold true for every site or instance, but the graphs make it easy to see how the engines can use temporal link and content growth information to make guesses about the relevance or worthiness of a particular site. Figure 11-50 shows data of a few real sites and how these trends have affected them.
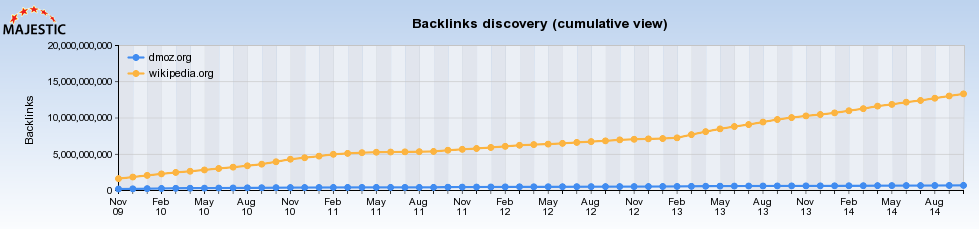
Figure 11-50. DMOZ versus Wikipedia backlink discovery
As you can see in Figure 11-50, Wikipedia has had tremendous growth in both pages and links from 2009 through 2014. This success manifests itself in the search engines, which reward Wikipedia’s massive link authority with high rankings for much of its content.
DMOZ was once a default reference link for many sites, but its relative influence has waned. Although it continues to grow, Wikipedia simply trumps it immensely. Figure 11- 51 shows backlink domain discovery indicating that Wikipedia not only has breadth of links, but also of linking domains.

Figure 11-51. DMOZ versus Wikipedia referring domains
Many forms of spam and manipulative link building are likely to stand out like a sore thumb when put under the temporal microscope. When there’s a large gain in links relative to a site’s sphere, influence, and historical link growth, the engines can take a closer look at the source of the links or even trigger a manual review. Common sense would dictate that a small-time local real estate site doesn’t usually attract a few thousand new links in a week unless it has done something newsworthy or link-worthy.
There are few limits to what the engines can do with such data, and there is no reason they shouldn’t be analyzing it (it is readily available, after all). Do consider how the link and content growth patterns for your sites may affect the engines’ perspectives on your rankings and trustworthiness.
Key Performance Indicators for Long-Tail SEO
As we have discussed throughout the book, the long tail is an important part of SEO. Here are some available metrics for diagnosing the health of your long-tail search traffic:
- Branded-to-nonbranded ratio
-
This is the percentage of your natural search traffic that comes from branded keywords versus nonbranded keywords.
-
If the ratio is high and most of your traffic is coming from searches for your brand, this signals that your SEO is fundamentally broken. The lower the ratio, the more of the long tail of natural search you likely are capturing. This metric is an excellent gauge of the success of your optimization initiatives. What constitutes a high ratio is going to vary depending on your brand’s level of recognition and how web savvy your users are. Certainly anything over 50% brand searches warrants closer examination.
- Unique crawled URLs
-
This is the number of unique (nonduplicate) web pages crawled by search engine spiders such as Googlebot and BingBot. Your website is like your virtual sales force, bringing in prospects from the search engines. Think of each unique page as one of your virtual salespeople. The more unique pages you have, the more opportunities you have to sell through the search engines.
- Search visitors per contributing page
-
This is the percentage of unique pages that yield search-delivered traffic in a given month.
-
This ratio is a key driver of the length of your long tail of natural search. The more pages yielding traffic from search engines, the healthier your SEO program. If only a small portion of your website is delivering searchers to your door, most of your pages—your virtual salespeople—are warming the bench instead of working hard for you. You can think of these nonperforming pages as “freeloaders.”
- Keywords per page
-
This is the average number of keywords driving traffic to each page (minus the freeloaders) in a given month. Put another way, it is the ratio of the total number of keywords driving search traffic to pages receiving search traffic.
-
The higher your keywords per page, the more of the long tail of natural search your site will capture. In other words, the more keywords each page attracts or targets, the longer your tail. So, an average of eight search terms per page indicates pages with much broader appeal to the engines than, say, three search terms per page. The average online retailer in a Netconcepts study on the long tail of natural search) had 2.4 keywords per page. A larger number of keywords per page should also indicate that your content is more varied in its keyword usage and that it is better meeting the needs of a wide variety of users (which the search engines will recognize).
- Search visitors per keyword
-
This is the ratio of search engine–delivered visitors to search terms. This metric indicates how much traffic each keyword drives and is a function of your rankings in the SERPs. Put another way, this metric determines the height or thickness of your long tail.
-
The average merchant in the aforementioned Netconcepts study obtained 1.9 visitors per keyword.
- Index-to-crawl ratio
-
This is the ratio of pages indexed to unique crawled pages. If a page gets crawled by Googlebot, that doesn’t guarantee it will show up in Google’s index. A low ratio can mean your site doesn’t carry much weight in Google’s eyes.
- Search visitors per crawled page
-
Calculated for each search engine separately, this is how much traffic the engine delivers for every page it crawls.
-
Each search engine has a different audience size. This metric helps you fairly compare the referral traffic you get from each. The Netconcepts study found that Bing and Yahoo! tended to crawl significantly more pages, but the yield per crawled page from Google was typically significantly higher.
-
As you optimize your site through multiple iterations, watch the aforementioned KPIs to ensure that you’re heading in the right direction. Those who are not privy to these metrics will have a much harder time capturing the long tail of SEO.
Duplicate Content
Duplicate content—one or more pages with multiple unique URLs—is, in effect, making your own long tail unnecessarily longer. You only want one canonical URL for each page of content, and you don’t want that content to be repeated verbatim on other pages or sites.
Once you find duplicate content, figure out which page and URL you want to be the canonical resource (typically the ones with the highest PageRank), and 301-redirect the others to it.
Some analytics packages and independent SEO tools can track duplicate content, such as SEObook.com’s Duplicate Content Checker.
Other Third-Party Tools
Throughout this chapter, several third-party tools have been mentioned or recommended for analysis, research, and testing. This section outlines a few more worth noting.
MozBar
As previously mentioned in this chapter, the MozBar provides at-a-glance link and social sharing metrics, but it also offers much more. Through a series of available drop-down menus (see Figure 11-52) the MozBar can provide information on on-page elements, general attributes, in-depth link metrics, semantic markup, and HTTP status of the page. Some of the on-page elements it details are the URL, <title tag>, meta description, meta keywords, heading tags, bolded text, italicized text, and alt text for images on the page. Some of the “general attributes” it details are the content of the meta robots tag, the rel="canonical" link element, the page load time, a link to the URL for Google’s cache of the page, the IP address, and the country the site is perceived to be located in. It offers a wide variety of link metrics for the current URL, the current subdomain, and the current root domain including Page Authority, Domain Authority, External Followed Links, Linking Root Domains, MozRank (mR), and MozTrust (mT). The tool also shows whether various types of markup are present on the page and provides links to further analyze that markup. Some of the types of markup it can detect are: Schema.org, Open Graph Protocol, Twitter cards, microformats, and authorship. Also offered are links to more of Moz’s SEO tools.
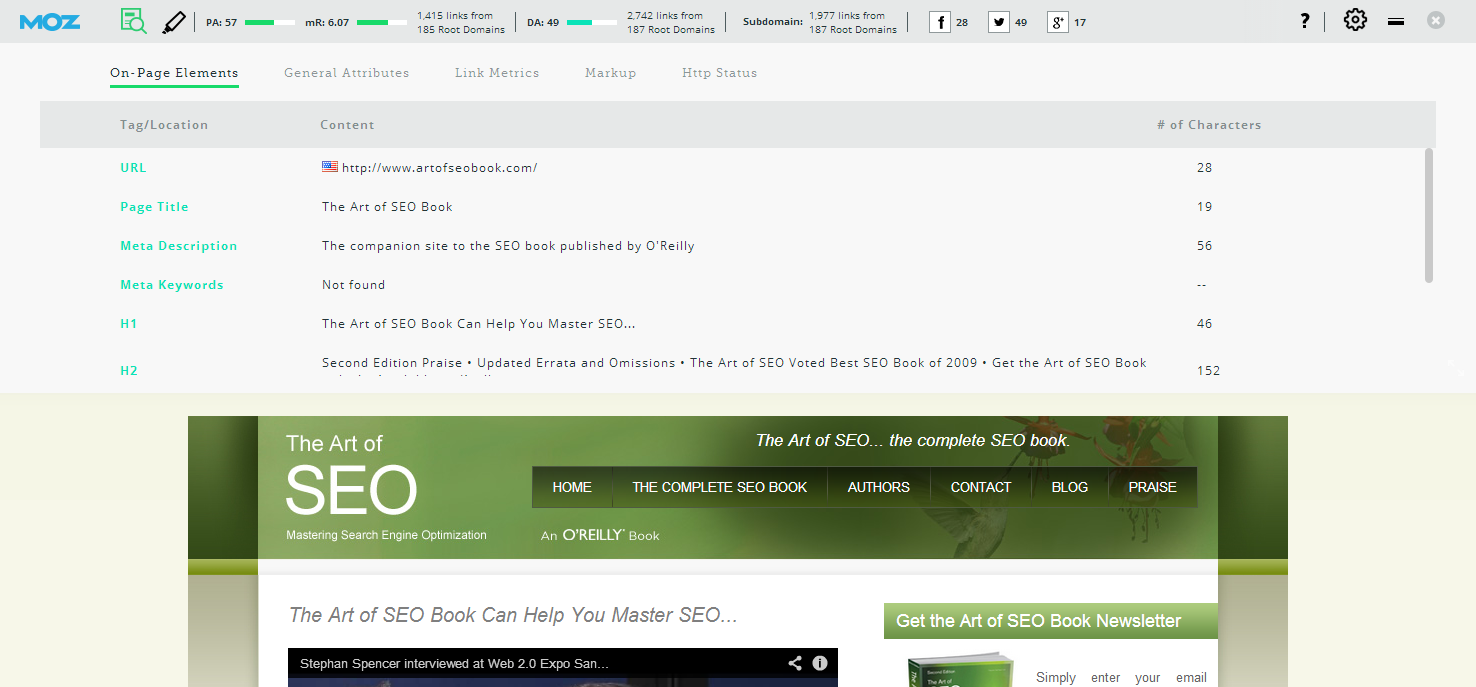
Figure 11-52. MozBar drop-down menus
SEO Quake
SEO Quake offers both a Firefox plug-in and a Chrome extension. SEO Quake adds a toolbar to your browser for at-a-glance statistics and offers links to more in-depth page information (see Figure 11-53). Some of the metrics this add-on allows you to view are: PageRank, number of pages indexed in Google, SEMrush links to both the page and domain, number of pages indexed in Bing, Alexa rank, domain age, social shares, links to whois information, the page’s source code, and the SEMrush domain rank.
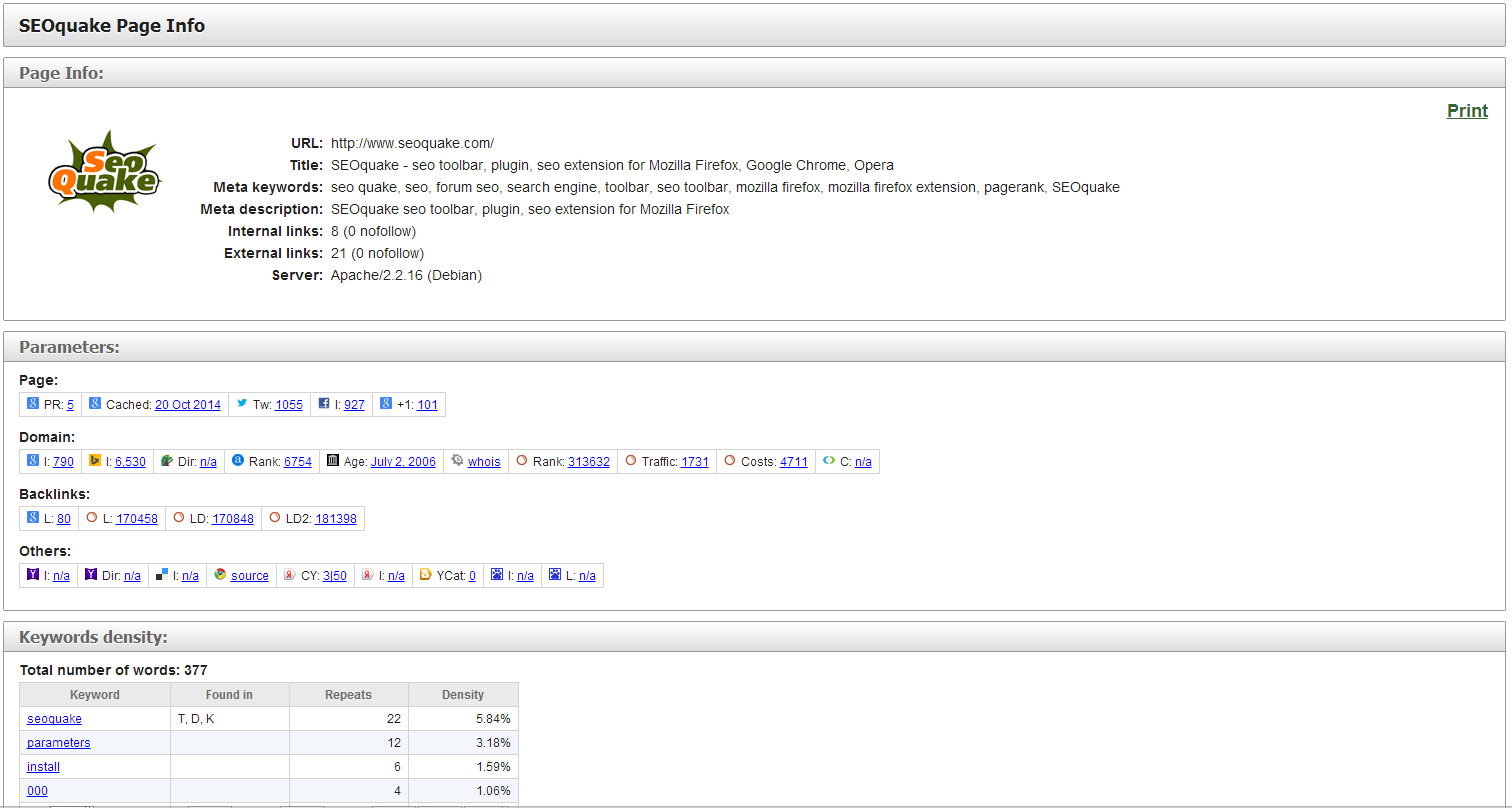
Figure 11-53. SEO Quake page info report
SEO for Firefox
Aaron Wall of SEO Book created a useful data enhancement tool with the SEO for Firefox extension. When turned on, this tool provides extra data that can be populated automatically or upon request from within the regular search results of Google, Yahoo!, and Bing. Some of the most popular data points this add-on provides for the URL or domain of each search result include: Google PageRank, site age, various backlink metrics, .edu and .gov link counts, bookmarking and social metrics (like number of YouTube views), DMOZ listings, and additional reporting from other third-party tools.
SpyFu
SpyFu offers valuable keyword data for SEO professionals as well as resources for PPC advertisers. There is both a free version that provides valuable but limited data, as well as a paid version that provides additional data. For SEO, SpyFu offers the Domain Research, Keyword Research, and Backlink Discovery tools.
Domain Research allows you to review a site’s organic keywords by their latest changes, by their page, and by clicks (see Figure 11-54). This allows you to monitor for rank, scout for potential algorithm penalties and manual penalties, and even compare these rankings to competitors.
Keyword Research, as expected, focuses on the stats of an individual keyword. The tool provides a history of domains that have ranked for a specific keyword, the URLs of pages ranking for a keyword, and keyword mapping ideas. These results can be incredibly helpful for developing a content strategy.
The Backlink Discovery tool doesn’t work like other backlinking tools, which show current backlinks to the site. Instead, it suggests potential backlinking opportunities, such as hubs that are linking to various competitors or other sites within the niche. Getting deeper into it, you can even organize results by keyword, and single out backlinks that would be helpful to rank for a specific keyword.
For PPC, SpyFu can provide information on a site’s estimated daily ad budget, total ad clicks per day, average cost per click, average ad clicks per day, average ad position, average ad competitors, average ad percentile, paid and organic keywords, top paid and organic competitors, and other domains that share the same owner.

Figure 11-54. SpyFu Domain Research for SEO
SEMrush
SEMrush is another tool that offers useful keyword information to SEO and paid search professionals. Figure 11-55 shows a paid search report that is interesting from an SEO perspective because it shows the target landing page for the keyword, as well as the estimated CPC. This can provide insight into the value your competitors are placing on various keywords and landing pages on their site.
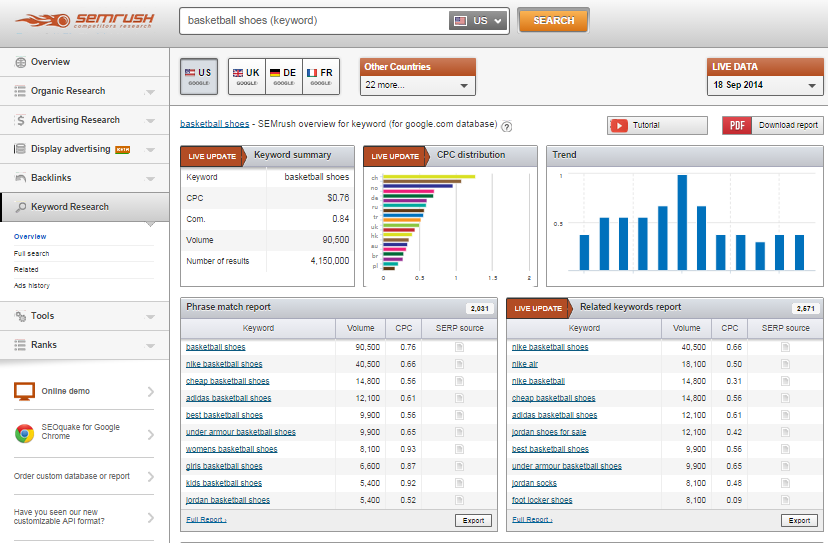
Figure 11-55. SEMrush keyword report
Rio SEO Search Analytics
Rio SEO Search Analytics is an enterprise class SEO platform that includes many more features than simple rank checking, crawl error alerts, and basic recommendations. Some of its features include:
-
Keyword research solutions
-
Long-tail analysis and recommendations
-
Workflow tracking and automation
-
Portfolio analysis for multiple sites, microsites, and landing pages
-
Prioritization mechanisms
-
Competitive analysis features
-
Advanced link analytics
-
Ad hoc analysis capabilities
-
Advanced reporting capabilities
-
Alerting capabilities
-
Universal search metrics (image, video, etc.)
-
Social signal inclusion and analytics
Rio SEO Website Optimizer
In some enterprise environments there are fundamental challenges with the content management system (CMS) or the ecommerce platform that make it very difficult to implement desired SEO changes.
There are only a few solutions in this space, and one of the best known is Rio’s SEO Website Optimizer, formerly Covario’s Organic Search Optimizer, originally developed by Stephan Spencer (one of the coauthors of this book) at Netconcepts and previously known as GravityStream.
Rio’s Website Optimizer takes a complementary approach to whatever system is currently in place and helps SEOs get around IT to dynamically fix the SEO errors. Website Optimizer enables you to modify the pages without having to directly deal with the CMS or ecommerce platform.
Searchmetrics Essentials
Searchmetrics Essentials allows you to rapidly see how your competition is doing in organic search, paid search, news search, image search video search, and more (see Figure 11-56). The Keyword Research tab gives you search volume, cost per click, competition for keywords, and the average ad spend on a per-keyword basis. This can be more helpful and informative than simply using the Google Keyword Planner. You can actually see what people are spending to target specific keywords.
Searchmetrics Essentials also lets you peer deep into your competition’s social media campaign. You can see which pages are the most liked, commented on, and shared throughout all of the popular networks. The platform offers many other features as well.

Figure 11-56. Searchmetrics Essentials
Conclusion
One of the biggest challenges for an SEO professional is the relatively long delay between implementation and results. Paid search campaigns can begin to show results in 24 hours, yet for SEO the process can take months. This makes effective measurement of results and progress critical. Putting the right analytics tools in place can provide the accountability required by budget managers. For the SEO practitioner, it can also provide valuable insight that can be used to fine-tune SEO efforts for the best possible results.
1 Christine Churchill, “Getting Query Data from Google Webmaster Tools to Correlate with SEO Query Data in Google Analytics,” SEM Clubhouse, March 11, 2013, http://bit.ly/correlate_data.
2 Eric Enge, “The Impact of Comparison Shopping Sites on E-Commerce Sales,” Search Engine Watch, August 1, 2007, http://bit.ly/comparison_shopping
3 Justin Cutroni, “Getting Started with Google Analytics Remarketing,” Anaytics Talk, November 20, 2012, http://cutroni.com/blog/2012/11/20/getting-started-with-google-analytics-remarketing/.