Chapter 10. Operating Flink and Streaming Applications
Streaming applications are long-running and their workloads are often unpredictable. It is not uncommon for a streaming job to be continuously running for months, so its operational needs are quite different than those of short-lived batch jobs. Consider a scenario where you detect a bug in your deployed application. If your application is a batch job, you can easily fix the bug offline and then redeploy the new application code once the current job instance finishes. But what if your job is a long-running streaming job? How do you apply a reconfiguration with low effort while guaranteeing correctness?
If you are using Flink, you have nothing to worry about. Flink will do all the hard work so you can easily monitor, operate, and reconfigure your jobs with minimal effort while preserving exactly-once state semantics. In this chapter, we present the tools Flink offers for operating and maintaining continuously running streaming applications. We will show you how to collect metrics and monitor your applications and how to preserve result consistency when you want to update application code or adjust the resources of your application.
Running and Managing Streaming Applications
As you might expect, maintaining streaming applications is more challenging than maintaining batch applications. While streaming applications are stateful and continuously running, batch applications are periodically executed. Reconfiguring, scaling, or updating a batch application can be done between executions, which is a lot easier than upgrading an application that is continuously ingesting, processing, and emitting data.
However, Apache Flink has many features to significantly ease the maintenance of streaming applications. Most of these features are based on savepoints.1 Flink exposes the following interfaces to monitor and control its master and worker processes, and applications:
-
The command-line client is a tool used to submit and control applications.
-
The REST API is the underlying interface that is used by the command-line client and Web UI. It can be accessed by users and scripts and provides access to all system and application metrics as well as endpoints to submit and manage applications.
-
The Web UI is a web interface that provides details and metrics about a Flink cluster and running applications. It also offers basic functionality to submit and manage applications. The Web UI is described in “Flink Web UI”.
In this section, we explain the practical aspects of savepoints and discuss how to start, stop, pause and resume, scale, and upgrade stateful streaming applications using Flink’s command-line client and Flink’s REST API.
Savepoints
A savepoint is basically identical to a checkpoint—it is a consistent and complete snapshot of an application’s state. However, the lifecycles of checkpoints and savepoints differ. Checkpoints are automatically created, loaded in case of a failure, and automatically removed by Flink (depending on the configuration of the application). Moreover, checkpoints are automatically deleted when an application is canceled, unless the application explicitly enabled checkpoint retention. In contrast, savepoints must be manually triggered by a user or an external service and are never automatically removed by Flink.
A savepoint is a directory in a persistent data storage. It consists of a subdirectory that holds the data files containing the states of all tasks and a binary metadata file that includes absolute paths to all data files. Because the paths in the metadata file are absolute, moving a savepoint to a different path will render it unusable. Here is the structure of a savepoint:
# Savepoint root path
/savepoints/

# Path of a particular savepoint
/savepoints/savepoint-:shortjobid-:savepointid/

# Binary metadata file of a savepoint
/savepoints/savepoint-:shortjobid-:savepointid/_metadata

# Checkpointed operator states
/savepoints/savepoint-:shortjobid-:savepointid/:xxx
Managing Applications with the Command-Line Client
Flink’s command-line client provides the functionality to start, stop, and manage Flink applications. It reads its configuration from the ./conf/flink-conf.yaml file (see “System Configuration”). You can call it from the root directory of a Flink setup with the command./bin/flink.
When run without additional parameters, the client prints a help message.
Command-Line Client on Windows
The command-line client is based on a bash script. Therefore, it does not work with the Windows command line. The ./bin/flink.bat script for the Windows command line provides only very limited functionality. If you are a Windows user, we recommend using the regular command-line client and running it on WSL or Cygwin.
Starting an application
You can start an application with the run command of the command-line client:
./bin/flink run ~/myApp.jar
The above command starts the application from the main() method of the class that is referenced in the program-class property of the JAR file’s META-INF/MANIFEST.MF file without passing any arguments to the application. The client submits the JAR file to the master process, which distributes it to the worker nodes.
You can pass arguments to the main() method of an application by appending them at the end of the command:
./bin/flink run ~/myApp.jar my-arg1 my-arg2 my-arg3
By default, the client does not return after submitting the application but waits for it to terminate. You can submit an application in detached mode with the -d flag as shown here:
./bin/flink run -d ~/myApp.jar
Instead of waiting for the application to terminate, the client returns and prints the JobID of the submitted job. The JobID is used to specify the job when taking a savepoint, canceling, or rescaling an application. You can specify the default parallelism of an application with the -p flag:
./bin/flink run -p 16 ~/myApp.jar
The above command sets the default parallelism of the execution environment to 16. The default parallelism of an execution environment is overwritten by all settings explicitly specified by the source code of the application—the parallelism that is defined by calling setParallelism() on StreamExecutionEnvironment or on an operator has precedence over the default value.
If the manifest file of your application JAR file does not specify an entry class, you can specify the class using the -c parameter:
./bin/flink run -c my.app.MainClass ~/myApp.jar
The client will try to start the static main() method of the my.app.MainClass class.
By default, the client submits an application to the Flink master specified by the ./conf/flink-conf.yaml file (see the configuration for different setups in “System Configuration”). You can submit an application to a specific master process using the -m flag:
./bin/flink run -m myMasterHost:9876 ~/myApp.jar
This command submits the application to the master that runs on host myMasterHost at port 9876.
Note
Note that the state of an application will be empty if you start it for the first time or do not provide a savepoint or checkpoint to initialize the state. In this case, some stateful operators run special logic to initialize their state. For example, a Kafka source needs to choose the partition offsets from which it consumes a topic if no restored read positions are available.
Listing running applications
For all actions you want to apply to a running job, you need to provide a JobID that identifies the application. The ID of a job can be obtained from the Web UI, the REST API, or using the command-line client. The client prints a list of all running jobs, including their JobIDs, when you run the following command:
./bin/flink list -r Waitingforresponse... ------------------ Running/Restarting Jobs ------------------- 17.10.2018 21:13:14 : bc0b2ad61ecd4a615d92ce25390f61ad : Socket Window WordCount(RUNNING)--------------------------------------------------------------
In this example, the JobID is bc0b2ad61ecd4a615d92ce25390f61ad.
Taking and disposing of a savepoint
A savepoint can be taken for a running application with the command-line client as follows:
./bin/flink savepoint <jobId>[savepointPath]
The command triggers a savepoint for the job with the provided JobID. If you explicitly specify a savepoint path, it is stored in the provided directory. Otherwise, the default savepoint directory as configured in the flink-conf.yaml file is used.
To trigger a savepoint for the job bc0b2ad61ecd4a615d92ce25390f61ad and store it in the directory hdfs:///xxx:50070/savepoints, we call the command-line client:
./bin/flink savepoint bc0b2ad61ecd4a615d92ce25390f61adhdfs:///xxx:50070/savepoints Triggering savepointforjob bc0b2ad61ecd4a615d92ce25390f61ad. Waitingforresponse... Savepoint completed. Path: hdfs:///xxx:50070/savepoints/savepoint-bc0b2a-63cf5d5ccef8 You can resume your program from this savepoint with the run command.
Savepoints can occupy a significant amount of space and are not automatically deleted by Flink. You need to manually remove them to free the consumed storage. A savepoint is removed with the command:
./bin/flink savepoint -d <savepointPath>
In order to remove the savepoint we triggered before, call the command:
./bin/flink savepoint -dhdfs:///xxx:50070/savepoints/savepoint-bc0b2a-63cf5d5ccef8 Disposing savepoint'hdfs:///xxx:50070/savepoints/savepoint-bc0b2a-63cf5d5ccef8'. Waitingforresponse... Savepoint'hdfs:///xxx:50070/savepoints/savepoint-bc0b2a-63cf5d5ccef8'disposed.
Deleting a Savepoint
You must not delete a savepoint before another checkpoint or savepoint is completed. Since savepoints are handled by the system similarly to regular checkpoints, operators also receive checkpoint completion notifications for completed savepoints and act on them. For example, transactional sinks commit changes to external systems when a savepoint completes. To guarantee exactly-once output, Flink must recover from the latest completed checkpoint or savepoint. A failure recovery would fail if Flink attempted to recover from a savepoint that was removed. Once another checkpoint (or savepoint) completes, you can safely remove a savepoint.
Canceling an application
An application can be canceled in two ways: with or without a savepoint. To cancel a running application without taking a savepoint run the following command:
./bin/flink cancel <jobId>
In order to take a savepoint before canceling a running application add the -s flag to the cancel command:
./bin/flink cancel -s[savepointPath]<jobId>
If you do not specify a savepointPath, the default savepoint directory as configured in the ./conf/flink-conf.yaml file is used (see “System Configuration”). The command fails if the savepoint folder is neither explicitly specified in the command nor available from the configuration. To cancel the application with the JobID bc0b2ad61ecd4a615d92ce25390f61ad and store the savepoint at hdfs:///xxx:50070/savepoints, run the command:
./bin/flink cancel -s
Canceling an Application Might Fail
Note that the job will continue to run if taking the savepoint fails. You will need to make another attempt at canceling the job.
Starting an application from a savepoint
Starting an application from a savepoint is fairly simple. All you have to do is start an application with the run command and additionally provide a path to a savepoint with the -s option:
./bin/flink run -s <savepointPath>[options]<jobJar>[arguments]
When the job is started, Flink matches the individual state snapshots of the savepoint to all states of the started application. This matching is done in two steps. First, Flink compares the unique operator identifiers of the savepoint and application’s operators. Second, it matches for each operator the state identifiers (see “Savepoints” for details) of the savepoint and the application.
You Should Define Unique Operator IDs
If you do not assign unique IDs to your operators with the uid() method, Flink assigns default identifiers, which are hash values that depend on the type of the operator and all previous operators. Since it is not possible to change the identifiers in a savepoint, you will have fewer options to update and evolve your application if you do not manually assign operator identifiers using uid().
As mentioned, an application can only be started from a savepoint if it is compatible with the savepoint. An unmodified application can always be restarted from its savepoint. However, if the restarted application is not identical to the application from which the savepoint was taken, there are three cases to consider:
-
If you added a new state to the application or changed the unique identifier of a stateful operator, Flink will not find a corresponding state snapshot in the savepoint. In this case, the new state is initialized as empty.
-
If you removed a state from the application or changed the unique identifier of a stateful operator, there is state in the savepoint that cannot be matched to the application. In this case, Flink does not start the application to avoid losing the state in the savepoint. You can disable this safety check by adding the
-noption to the run command. -
If you changed a state in the application—changed the state primitive or modified the data type of the state—the application fails to start. This means that you cannot easily evolve the data type of a state in your application, unless you designed your application with state evolution in mind from the start. The Flink community is currently working on improving the support for state evolution. (See “Modifying the State of an Operator”.)
Scaling an Application In and Out
Decreasing or increasing the parallelism of an application is not difficult. You need to take a savepoint, cancel the application, and restart it with an adjusted parallelism from the savepoint. The state of the application is automatically redistributed to the larger or smaller number of parallel operator tasks. See “Scaling Stateful Operators” for details on how the different types of operator state and keyed state are scaled. However, there are a few things to consider.
If you require exactly-once results, you should take the savepoint and stop the application with the integrated savepoint-and-cancel command. This prevents another checkpoint from completing after the savepoint, which would trigger exactly-once sinks to emit data after the savepoint.
As discussed in “Setting the Parallelism”, the parallelism of an application and its operators can be specified in different ways. By default, operators run with the default parallelism of their associated StreamExecutionEnvironment. The default parallelism can be specified when starting an application (e.g., using the -p parameter in the CLI client). If you implement the application such that the parallelism of its operators depends on the default environment parallelism, you can simply scale an application by starting it from the same JAR file and specifying a new parallelism. However, if you hardcoded the parallelism on the StreamExecutionEnvironment or on some of the operators, you might need to adjust the source code and recompile and repackage your application before submitting it for execution.
If the parallelism of your application depends on the environment’s default parallelism, Flink provides an atomic rescale command that takes a savepoint, cancels the application, and restarts it with a new default parallelism:
./bin/flink modify <jobId> -p <newParallelism>
To rescale the application with the jobId bc0b2ad61ecd4a615d92ce25390f61ad to a parallelism of 16, run the command:
./bin/flink modify bc0b2ad61ecd4a615d92ce25390f61ad -p 16 Modify job bc0b2ad61ecd4a615d92ce25390f61ad. Rescaled job bc0b2ad61ecd4a615d92ce25390f61ad. Its new parallelism is 16.
As described in “Scaling Stateful Operators”, Flink distributes keyed state on the granularity of so-called key groups. Consequently, the number of key groups of a stateful operator determines its maximum parallelism. The number of key groups is configured per operator using the setMaxParallelism() method. (See “Defining the Maximum Parallelism of Keyed State Operators”.)
Managing Applications with the REST API
The REST API can be directly accessed by users or scripts and exposes information about the Flink cluster and its applications, including metrics as well as endpoints to submit and control applications. Flink serves the REST API and the Web UI from the same web server, which runs as part of the Dispatcher process. By default, both are exposed on port 8081. You can configure a different port at the ./conf/flink-conf.yaml file with the configuration key rest.port. A value of -1 disables the REST API and Web UI.
A common command-line tool to interact with REST API is curl. A typical curl REST command looks like:
curl -X <HTTP-Method>[-d <parameters>]http://hostname:port/v1/<REST-point>
The v1 indicates the version of the REST API. Flink 1.7 exposes the first version (v1) of the API. Assuming you are running a local Flink setup that exposes its REST API on port 8081, the following curl command submits a GET request to the /overview REST point:
curl -X GET http://localhost:8081/v1/overview
The command returns some basic information about the cluster, such as the Flink version, the number of TaskManagers, slots, and jobs that are running, finished, cancelled, or failed:
{
 "taskmanagers":2,
 "slots-total":8,
 "slots-available":6,
 "jobs-running":1,
 "jobs-finished":2,
 "jobs-cancelled":1,
 "jobs-failed":0,
 "flink-version":"1.7.1",
 "flink-commit":"89eafb4"
}
In the following, we list and briefly describe the most important REST calls. Refer to the official documentation of Apache Flink for a complete list of supported calls. “Managing Applications with the Command-Line Client” provides more details about some of the operations, such as upgrading or scaling an application.
Managing and monitoring a Flink cluster
The REST API exposes endpoints to query information about a running cluster and to shut it down. Tables 10-1, 10-2, and 10-3 show the REST requests to obtain information about a Flink cluster, such as the number of task slots, running and finished jobs, the configuration of the JobManager, or a list of all connected TaskManagers.
| Request | GET /overview |
| Response | Basic information about the cluster as shown above |
| Request | GET /jobmanager/config |
| Response | Returns the configuration of the JobManager as defined in ./conf/flink-conf.yaml |
| Request | GET /taskmanagers |
| Response | Returns a list of all TaskManagers including their IDs and basic information, such as memory statistics and connection ports |
Table 10-4 shows the REST request to list all metrics that are collected for the JobManager.
| Request | GET /jobmanager/metrics |
| Response | Returns a list of metrics that are available for the JobManager |
In order to retrieve one or more JobManager metrics, add the get query parameter with all the requested metrics to the request:
curl -X GET http://hostname:port/v1/jobmanager/metrics?get=metric1,metric2
Table 10-5 shows the REST request to list all metrics that are collected for the TaskManagers.
| Request |
GET /taskmanagers/<tmId>/metrics |
| Parameters | tmId: The ID of a connected TaskManager |
| Response | Returns a list of metrics available for the chosen TaskManager |
To retrieve one or more metrics for a TaskManager, add the get query parameter with all the requested metrics to the request:
curl -X GET http://hostname:port/v1/taskmanagers/<tmId>/metrics?get=metric1
You can also shutdown a cluster using the REST call that is shown in Table 10-6.
| Request | DELETE /cluster |
| Action | Shuts down the Flink cluster. Note that in standalone mode, only the master process will be terminated and the worker processes will continue to run. |
Managing and montioring Flink applications
The REST API can also be used to manage and monitor Flink applications. To start an application, you first need to upload the application’s JAR file to the cluster. Tables 10-7, 10-8, and 10-9 show the REST endpoints to manage these JAR files.
| Request | POST /jars/upload |
| Parameters | The file must be sent as multipart data |
| Action | Uploads a JAR file to the cluster |
| Response |
The storage location of the uploaded JAR file |
The curl command to upload a JAR file:
curl -X POST -H"Expect:"-F"jarfile=@path/to/flink-job.jar"http://hostname:port/v1/jars/upload
| Request | GET /jars |
| Response | A list of all uploaded JAR files. The list includes the internal ID of a JAR file, its original name, and the time when it was uploaded. |
| Request | DELETE /jars/<jarId> |
| Parameters | jarId: The ID of the JAR file as provided by the list JAR file command |
| Action |
Deletes the JAR file referenced by the provided ID |
An application is started from an uploaded JAR file using the REST call that is shown in Table 10-10 .
| Request | POST /jars/<jarId>/run |
| Parameters | jarId: The ID of the JAR file from which the application is started. You can pass additional parameters such as the job arguments, the entry class, the default parallelism, a savepoint path, and the allow-nonrestored-state flag as a JSON object. |
| Action | Starts the application defined by the JAR file (and entry-class) with the provided parameters. If a savepoint path is provided, the application state is initialized from the savepoint. |
| Response |
The job ID of the started application |
The curl command to start an application with a default parallelism of 4 is:
curl -d'{"parallelism":"4"}'-X POSThttp://localhost:8081/v1/jars/43e844ef-382f-45c3-aa2f-00549acd961e_App.jar/run
Tables 10-11, 10-12, and 10-13 show how to manage running applications using the REST API.
| Request | GET /jobs |
| Response | Lists the job IDs of all running applications and the job IDs of the most recently failed, canceled, and finished applications. |
| Request | GET /jobs/<jobId> |
| Parameters | jobId: The ID of a job as provided by the list application command |
| Response | Basic statistics such as the name of the application, the start time (and end time), and information about the executed tasks including the number of ingested and emitted records and bytes |
The REST API also provides more detailed information about the following aspects of an application:
-
The operator plan of the application
-
The configuration of the application
-
Collected metrics of an application at various levels of detail
-
Checkpointing metrics
-
Backpressure metrics
-
The exception that caused an application to fail
Take a look at the official documentation for details about how to access this information.
| Request |
PATCH /jobs/<jobId> |
| Parameters | jobId: The ID of a job as provided by the list application command |
| Action | Cancels the application |
You can also take a savepoint of a running application via the REST call that is shown in Table 10-14 .
The curl command to trigger a savepoint without canceling is:
curl -d'{"target-directory":"file:///savepoints", "cancel-job":"false"}'-X POST http://localhost:8081/v1/jobs/e99cdb41b422631c8ee2218caa6af1cc/savepoints{"request-id":"ebde90836b8b9dc2da90e9e7655f4179"}
Canceling an Application with a Savepoint Might Fail
A request to cancel the application will only succeed if the savepoint was successfully taken. The application will continue running if the savepoint command failed.
To check if the request with the ID ebde90836b8b9dc2da90e9e7655f4179 was successful and to retrieve the path of the savepoint run:
curl -X GET http://localhost:8081/v1/jobs/e99cdb41b422631c8ee2218caa6af1cc/savepoints/ebde90836b8b9dc2da90e9e7655f4179{"status":{"id":"COMPLETED"}"operation":{"location":"file:///savepoints/savepoint-e99cdb-34410597dec0"}}
To dispose a savepoint use the REST call that is shown in Table 10-15 .
| Request |
POST /savepoint-disposal |
| Parameters | The path of the savepoint to dispose needs to be provided as a parameter in a JSON object |
| Action | Disposes of a savepoint |
| Response |
A request ID to check whether the savepoint was successfully disposed or not |
To dispose a savepoint with curl, run:
curl -d'{"savepoint-path":"file:///savepoints/savepoint-e99cdb-34410597"}'-X POST http://localhost:8081/v1/savepoint-disposal{"request-id":"217a4ffe935ceac2c281bdded76729d6"}
Table 10-16 shows the REST call to rescale an application.
To rescale an application with curl to a new default parallelism of 16 run:
curl -X PATCH http://localhost:8081/v1/jobs/129ced9aacf1618ebca0ba81a4b222c6/rescaling?parallelism=16{"request-id":"39584c2f742c3594776653f27833e3eb"}
The Application Might Not Rescale
The application will continue to run with the original parallelism if the triggered savepoint failed. You can check the status of the rescale request using the request ID.
Bundling and Deploying Applications in Containers
So far we have explained how to start an application on a running Flink cluster. This is what we call the framework style of deploying applications. In “Application Deployment”, we briefly explained an alternative—the library mode that does not require a running Flink cluster to submit a job.
In library mode, the application is bundled into a Docker image that also includes the required Flink binaries. The image can be started in two ways—as a JobMaster container or a TaskManager container. When the image is deployed as a JobMaster, the container starts a Flink master process that immediately picks up the bundled application to start it. A TaskManager container registers itself at the JobMaster and offers its processing slots. As soon as enough slots become available, the JobMaster container deploys the application for execution.
The library style of running Flink applications resembles the deployment of microservices in a containerized environment. When being deployed on a container orchestration framework, such as Kubernetes, the framework restarts failed containers. In this section, we describe how to build a job-specific Docker image and how to deploy a library-style bundled application on Kubernetes.
Building a job-specific Flink Docker image
Apache Flink provides a script to build job-specific Flink Docker images. The script is included in the source distribution and Flink’s Git repository. It is not part of Flink’s binary distributions.
You can either download and extract a source distribution of Flink or clone the Git repository. Starting from the base folder of the distribution, the script is located at ./flink-container/docker/build.sh.
The build script creates and registers a new Docker image that is based on a Java Alpine image, a minimal base image that provides Java. The script requires the following parameters:
To build an image with Flink 1.7.1 that contains the example applications of this book, execute the script as follows:
cd./flink-container/docker ./build.sh--from-archive <path-to-Flink-1.7.1-archive>--job-jar <path-to-example-apps-JAR-file>--image-name flink-book-apps
If you run the docker images command after the build script finishes, you should see a new Docker image called flink-book-apps.
The ./flink-container/docker directory also contains a docker-compose.yml file to deploy a Flink application with docker-compose.
If you run the following command, the example application from “A Quick Look at Flink” is deployed on one master and three worker containers to Docker:
FLINK_DOCKER_IMAGE_NAME=flink-book-jobsFLINK_JOB=io.github.streamingwithflink.chapter1.AverageSensorReadingsDEFAULT_PARALLELISM=3docker-compose up -d
You can monitor and control the application by accessing the Web UI running a http://localhost:8081.
Running a job-specific Docker image on Kubernetes
Running a job-specific Docker image on Kubernetes is very similar to starting a Flink cluster on Kubernetes as described in “Kubernetes”. In principle, you only need to adjust the YAML files that describe your deployments to use an image that contains the job code and configure it to automatically start the job when the container is started.
Flink provides templates for the YAML files provided in the source distribution or found in the project’s Git repository. Starting from the base directory, the templates are located in:
./flink-container/kubernetes
The directory contains two template files:
- job-cluster-job.yaml.template configures the master container as a Kubernetes job.
- task-manager-deployment.yaml.template configures the worker container as a Kubernetes deployment.
Both template files contain placeholders that need to be replaced with actual values:
-
${FLINK_IMAGE_NAME}: The name of the job-specific image. -
${FLINK_JOB}: The main class of the job to start. -
${FLINK_JOB_PARALLELISM}: The degree of parallelism for the job. This parameter also determines the number of started worker containers.
As you can see, these are the same parameters we used when deploying the job-specific image with docker-compose. The directory also contains a YAML file job-cluster-service.yaml that defines a Kubernetes service. Once you have copied the template files and configured required values, you can deploy the application to Kubernetes as before with kubectl:
kubectl create -f job-cluster-service.yaml
kubectl create -f job-cluster-job.yaml
kubectl create -f task-manager-deployment.yaml
Running Job-Specific Images on Minikube
Running a job-specific image on a Minikube cluster requires a few more steps than those discussed in “Kubernetes”. The problem is that Minikube tries to fetch the custom image from a public Docker image registry instead of the local Docker registry of your machine.
However, you can configure Docker to deploy its images to Minikube’s own registry by running the following command:
eval$(minikube docker-env)
All images you build afterwards in this shell are deployed to Minikube’s image registry. Minikube needs to be running.
Moreover, you need to set the ImagePullPolicy in the YAML files to Never to ensure Minikube fetches the image from its own registry.
Once the job-specific containers are running, you can treat the cluster as a regular Flink cluster as described in “Kubernetes”.
Controlling Task Scheduling
Flink applications are executed in parallel by parallelizing operators into tasks and distributing these tasks across the worker processes in a cluster. Just like in many other distributed systems, the performance of a Flink application depends a lot on how the tasks are scheduled. The worker process to which a task is assigned, the tasks that are colocated with a task, and the number of tasks that are assigned to a worker process can have a significant impact on an application’s performance.
In “Task Execution”, we described how Flink assigns tasks to slots and how it leverages task chaining to reduce the cost of local data exchange. In this section, we discuss how you can tweak the default behavior and control task chaining and the assignment of tasks to slots to improve the performance of your applications.
Controlling Task Chaining
Task chaining fuses the parallel tasks of two or more operators into a single task that is executed by a single thread. The fused tasks exchange records by method calls and thus with basically no communication costs. Since task chaining improves the performance of most applications, it is enabled by default in Flink.
However, certain applications might not benefit from task chaining. One reason is to break a chain of expensive functions in order to execute them on different processing slots. You can completely disable task chaining for an application via the StreamExecutionEnvironment:
StreamExecutionEnvironment.disableOperatorChaining()
In addition to disabling chaining for the whole application, you can also control the chaining behavior of individual operators. To disable chaining for a specific operator, you can call its disableChaining() method. This will prevent the tasks of the operator from being chained to preceding and succeeding tasks (Example 10-1).
Example 10-1. Disable task chaining for an operator
valinput:DataStream[X]=...valresult:DataStream[Y]=input.filter(newFilter1()).map(newMap1())// disable chaining for Map2.map(newMap2()).disableChaining().filter(newFilter2())
The code in Example 10-1 results in three tasks—a chained task for Filter1 and Map1, an individual task for Map2, and a task for Filter2, which is not allowed to be chained to Map2.
It is also possible to start a new chain with an operator by calling its startNewChain() method (Example 10-2). The tasks of the operator will not be chained to preceding tasks but will be chained to succeeding tasks if the requirements for chaining are met.
Example 10-2. Start a new task chain with an operator
valinput:DataStream[X]=...valresult:DataStream[Y]=input.filter(newFilter1()).map(newMap1())// start a new chain for Map2 and Filter2.map(newMap2()).startNewChain().filter(newFilter2())
In Example 10-2 two chained tasks are created: one task for Filter1 and Map1 and another task for Map2 and Filter2. Note that the new chained task starts with the operator on which the startNewChain() method is called—Map2 in our example.
Defining Slot-Sharing Groups
Flink’s default task scheduling strategy assigns a complete slice of a program—up to one task of each operator of an application to a single processing slot.2 Depending on the complexity of the application and the computational costs of the operators, this default strategy can overload a processing slot. Flink’s mechanism to manually control the assignment of tasks to slots is slot-sharing groups.
Each operator is a member of a slot-sharing group. All tasks of operators that are members of the same slot-sharing group are processed by the same slots. Within a slot-sharing group, the tasks are assigned to slots as described in “Task Execution”—each slot processes up to one task of each operator that is a member. Hence, a slot-sharing group requires as many processing slots as the maximum parallelism of its operators. Tasks of operators that are in different slot-sharing groups are not executed by the same slots.
By default, each operator is in the "default" slot-sharing group. For each operator, you can explicitly specify its slot-sharing group with the slotSharingGroup(String) method. An operator inherits the slot-sharing group of its input operators if they are all members of the same group. If the input operators are in different groups, the operator is in the "default" group. Example 10-3 shows how to specify slot-sharing groups in a Flink DataStream application.
Example 10-3. Controlling task scheduling with slot-sharing groups
// slot-sharing group "green"vala:DataStream[A]=env.createInput(...).slotSharingGroup("green").setParallelism(4)valb:DataStream[B]=a.map(...)// slot-sharing group "green" is inherited from a.setParallelism(4)// slot-sharing group "yellow"valc:DataStream[C]=env.createInput(...).slotSharingGroup("yellow").setParallelism(2)// slot-sharing group "blue"vald:DataStream[D]=b.connect(c.broadcast(...)).process(...).slotSharingGroup("blue").setParallelism(4)vale=d.addSink()// slot-sharing group "blue" is inherited from d.setParallelism(2)
The application in Example 10-3 consists of five operators, two sources, two intermediate operators, and a sink operator. The operators are assigned to three slot-sharing groups: green, yellow, and blue. Figure 10-1 shows the JobGraph of the application and how its tasks are mapped to processing slots.

Figure 10-1. Controlling task scheduling with slot-sharing groups
The application requires 10 processing slots. The blue and green slot-sharing groups require four slots each due to the maximum parallelism of their assigned operators. The yellow slot-sharing group requires two slots.
Tuning Checkpointing and Recovery
A Flink application that runs with fault tolerance enabled periodically takes a checkpoint of its state. Checkpointing can be an expensive operation since the amount of data that needs to be copied to a persistent storage can be quite large. Increasing the checkpointing interval reduces the overhead of fault tolerance during regular processing. However, it also increases the amount of data a job needs to reprocess after recovering from a failure before it catches up to the tail of the stream.
Flink provides a couple of parameters to tune checkpointing and state backends. Configuring these options is important to ensure reliable and smooth operation of streaming applications in production. For instance, reducing the overhead of each checkpoint can facilitate a higher checkpointing frequency, leading to faster recovery cycles. In this section, we describe the parameters used to control checkpointing and recovery of applications.
Configuring Checkpointing
When you enable checkpointing for an application, you have to specify the checkpointing interval—the interval in which the JobManager will initiate checkpoints at the sources of the application.
Checkpoints are enabled on the StreamExecutionEnvironment:
valenv:StreamExecutionEnvironment=???// enable checkpointing with an interval of 10 seconds.env.enableCheckpointing(10000);
Further options to configure the checkpointing behavior are provided by the CheckpointConfig, which can be obtained from the StreamExecutionEnvironment:
// get the CheckpointConfig from the StreamExecutionEnvironmentvalcpConfig:CheckpointConfig=env.getCheckpointConfig
By default, Flink creates checkpoints to guarantee exactly-once state consistency. However, it can also be configured to provide at-least-once guarantees:
// set mode to at-least-oncecpConfig.setCheckpointingMode(CheckpointingMode.AT_LEAST_ONCE);
Depending on the characteristics of an application, the size of its state, and the state backend and its configuration, a checkpoint can take up to a few minutes. Moreover, the size of the state can grow and shrink over time, perhaps due to long-running windows. Hence, it is not uncommon for a checkpoint to take more time than the configured checkpointing interval. By default, Flink allows only one checkpoint to be in progress at a time to avoid checkpointing takeing away too many resources needed for regular processing. If—according to the configured checkpointing interval—a checkpoint needs to be started, but there is another checkpoint in progress, the second checkpoint will be put on hold until the first checkpoint completes.
If many or all checkpoints take longer than the checkpointing interval, this behavior might not be optimal for two reasons. First, it means that the regular data processing of the application will always compete for resources with the concurrent checkpointing. Hence, its processing slows down and it might not be able to make enough progress to keep up with the incoming data. Second, a checkpoint may be delayed because we need to wait for another checkpoint to complete results in a lower checkpointing interval, leading to longer catch-up processing during recovery. Flink provides parameters to address these situations.
To ensure an application can make enough progress, you can configure a minimum pause between checkpoints. If you configure the minimum pause to be 30 seconds, then no new checkpoint will be started within the first 30 seconds after a checkpoint completed. This also means the effective checkpointing interval is at least 30 seconds and there is at most one checkpoint happening at the same time.
// make sure we process at least 30s without checkpointingcpConfig.setMinPauseBetweenCheckpoints(30000);
In certain situations you might want to ensure that checkpoints are taken in the configured checkpointing interval even though a checkpoint takes longer than the interval. One example would be when checkpoints take a long time but do not consume much resources; for example, due to operations with high-latency calls to external systems. In this case you can configure the maximum number of concurrent checkpoints.
// allow three checkpoint to be in progress at the same timecpConfig.setMaxConcurrentCheckpoints(3);
Note
Savepoints are taken concurrently with checkpoints. Flink does not delay explicitly triggered savepoints due to checkpointing operations. A savepoint will always be started regardless of how many checkpoints are in progress.
To avoid long-running checkpoints, you can configure a timeout interval after which a checkpoint is canceled. By default, checkpoints are canceled after 10 minutes.
// checkpoints have to complete within five minutes, or are discardedcpConfig.setCheckpointTimeout(300000);
Finally, you might also want to configure what happens if a checkpoint fails. By default, a failing checkpoint causes an exception that results in an application restart. You can disable this behavior and let the application continue after a checkpointing error.
// do not fail the job on a checkpointing errorcpConfig.setFailOnCheckpointingErrors(false);
Enabling checkpoint compression
Flink supports compressed checkpoints and savepoints. Until Flink 1.7, the only supported compression algorithm is Snappy. You can enable compressed checkpoints and savepoints as follows:
valenv:StreamExecutionEnvironment=???// enable checkpoint compressionenv.getConfig.setUseSnapshotCompression(true)
Note
Note that checkpoint compression is not supported for incremental RocksDB checkpoints.
Retaining checkpoints after an application has stopped
The purpose of checkpoints is to recover an application after a failure. Hence, they clean up when a job stops running, either due to a failure or explicit cancellation. However, you can also enable a feature called externalized checkpoints to retain checkpoints after the application has stopped.
// Enable externalized checkpointscpConfig.enableExternalizedCheckpoints(ExternalizedCheckpointCleanup.RETAIN_ON_CANCELLATION)
There are two options for externalized checkpoints:
-
RETAIN_ON_CANCELLATIONretains the checkpoint after the application completely fails and when it is explicitly canceled. -
DELETE_ON_CANCELLATIONretains the checkpoint only after the application completely fails. If the application is explicitly canceled, the checkpoint is deleted.
Note
Externalized checkpoints do not replace savepoints. They use a state backend–specific storage format and do not support rescaling. Hence, they are sufficient to restart an application after it failed but provide less flexibility than savepoints. Once the application is running again, you can take a savepoint.
Configuring State Backends
The state backend of an application is responsible for maintaining the local state, performing checkpoints and savepoints, and recovering the application state after a failure. Hence, the choice and configuration of the application’s state backend has a large impact on the performance of the checkpoints. The individual state backends are described in more detail in “Choosing a State Backend”.
The default state backend of an application is MemoryStateBackend. Since it holds all state in memory and checkpoints are completely stored in the volatile and JVM-size limited JobManager heap storage, it is not recommended for production environments. However, it serves well for locally developing Flink applications. “Checkpointing and State Backends” describes how you can configure a default state backend of a Flink cluster.
You can also explicitly choose the state backend of an application:
valenv:StreamExecutionEnvironment=???// create and configure state backend of your choicevalstateBackend:StateBackend=???// set state backendenv.setStateBackend(stateBackend)
The different state backends can be created with minimum settings as shown in the following. MemoryStateBackend does not require any parameters. However, there are constructors that take parameters to enable or disable asynchronous checkpointing (enabled by default) and limit the size of state (5 MB by default):
// create a MemoryStateBackendvalmemBackend=newMemoryStateBackend()
FsStateBackend only requires a path to define the storage location for checkpoints. There are also constructor variants to enable or disable asynchronous checkpointing (enabled by default):
// create a FsStateBackend that checkpoints to the /tmp/ckp foldervalfsBackend=newFsStateBackend("file:///tmp/ckp",true)
RocksDBStateBackend only requires a path to define the storage location for checkpoints and takes an optional parameter to enable incremental checkpoints (disabled by default). RocksDBStateBackend is always writing checkpoints asynchronously:
// create a RocksDBStateBackend that writes incremental checkpoints// to the /tmp/ckp foldervalrocksBackend=newRocksDBStateBackend("file:///tmp/ckp",true)
In “Checkpointing and State Backends”, we discussed the configuration options for state backends. You can, of course, also configure the state backend in your application, overriding the default values or cluster-wide configuration. For that you have to create a new backend object by passing a Configuration object to your state backend. See “Checkpointing and State Backends” for a description of the available configuration options:
// all of Flink's built-in backends are configurablevalbackend:ConfigurableStateBackend=???// create configuration and set optionsvalsbConfig=newConfiguration()sbConfig.setBoolean("state.backend.async",true)sbConfig.setString("state.savepoints.dir","file:///tmp/svp")// create a configured copy of the backendvalconfiguredBackend=backend.configure(sbConfig)
Since RocksDB is an external component, it brings its own set of tuning parameters that can also be tweaked for your application. By default, RocksDB is optimized for SSD storage and does not provide great performance if state is stored on spinning disks. Flink provides a few predefined settings to improve the performance for common hardware setups. See the documentation to learn more about the available settings. You can apply predefined options to RocksDBStateBackend as follows:
valbackend:RocksDBStateBackend=???// set predefined options for spinning disk storagebackend.setPredefinedOptions(PredefinedOptions.SPINNING_DISK_OPTIMIZED)
Configuring Recovery
When a checkpointed application fails, it will be restarted by bringing up its tasks, recovering their states, including the reading offsets of the source tasks, and continuing the processing. Right after the application was restarted it is in a catch-up phase. Since the application’s source tasks were reset to an earlier input position, it processes data that it processed before the failure and data that accumulated while the application was down.
To be able to catch up with the stream—reach its tail—the application must process the accumulated data at a higher rate than new data is arriving. While the application is catching up, the processing latency—the time at which input is available until it is actually processed—increases.
Consequently, an application needs enough spare resources for the catch-up phase after the application was restarted to successfully resume its regular processing. This means an application should not run close to 100% resource consumption during regular processing. The more resources available for recovery, the faster the catch-up phase completes and the faster processing latencies go back to normal.
Besides resource considerations for the recovery, there are two other recovery-related topics we will discuss: restart strategies and local recovery.
Restart strategies
Depending on the failure that caused an application to crash, the application could be killed by the same failure again. A common example is invalid or corrupt input data the application is not able to handle. In such a situation, an application would end up in an infinite recovery cycle consuming lots of resources without a chance of ever getting back into regular processing. Flink features three restart strategies to address this problem:
-
The fixed-delay restart strategy restarts an application a fixed number of times and waits a configured time before a restart attempt.
-
The failure-rate restart strategy restarts an application as long as a configurable failure rate is not exceeded. The failure rate is specified as the maximum number of failures within a time interval. For example, you can configure that an application be restarted as long as it did not fail more than three times in the last ten minutes.
-
The no-restart strategy does not restart an application, but fails it immediately.
The restart strategy of an application is configured via StreamExecutionEnvironment as shown in Example 10-4.
Example 10-4. Configuring the restart strategy of an application
valenv=StreamExecutionEnvironment.getExecutionEnvironmentenv.setRestartStrategy(RestartStrategies.fixedDelayRestart(5,// number of restart attemptsTime.of(30,TimeUnit.SECONDS)// delay between attempts))
The default restart strategy used if no restart strategy is explicitly defined is a fixed-delay restart strategy with Integer.MAX_VALUE restart attempts and a 10-second delay.
Local recovery
Flink’s state backends (except for MemoryStateBackend) store checkpoints in a remote filesystem. This ensures first that the state is saved and persistent and second that it can be redistributed if a worker node is lost or the application is rescaled. However, reading state from remote storage during recovery is not very efficient. Moreover, on recovery, it might be possible to restart an application on the same workers it was running before the failure.
Flink supports a feature called local recovery to significantly speed up recovery if the application can be restarted on the same machines. When enabled, state backends also store a copy of the checkpoint data on the local disk of their worker node in addition to writing the data to the remote storage system. When the application is restarted, Flink tries to schedule the same tasks to the same worker nodes. If that succeeds, the tasks first try to load the checkpoint data from the local disk. In case of any problem, they fall back to the remote storage.
Local recovery is implemented so that the state copy in the remote system is the source of truth. A task only acknowledges a checkpoint if the remote write succeeded. Also, a checkpoint will not fail because a local state copy failed. Since the checkpoint data is written twice, local recovery adds overhead to checkpointing.
Local recovery can be enabled and configured for a cluster in the flink-conf.yaml file or per application by including the following in the state backend configuration:
-
state.backend.local-recovery: This flag enables or disables local recovery. By default, local recovery is deactivated. -
taskmanager.state.local.root-dirs: This parameter specifies one or more local paths at which the local state copies are stored.
Note
Local recovery only affects keyed state, which is always partitioned and usually accounts for most of the state size. Operator state will not be stored locally and needs to be retrieved from the remote storage system. However, it is typically much smaller than keyed state. Moreover, local recovery is not supported by the MemoryStateBackend, which does not support large state anyway.
Monitoring Flink Clusters and Applications
Monitoring your streaming job is essential to ensure its healthy operation and to detect potential symptoms of misconfigurations, underprovisioning, or unexpected behavior early. Especially when a streaming job is part of a larger data processing pipeline or event-driven service in a user-facing application, you probably want to monitor its performance as precisely as possible and make sure it meets certain targets for latency, throughput, resource utilization, etc.
Flink gathers a set of predefined metrics during runtime and also provides a framework that allows you to define and track your own metrics.
Flink Web UI
The simplest way to get an overview of your Flink cluster as well as a glimpse of what your jobs are doing internally is to use Flink’s Web UI. You can access the dashboard by visiting http://<jobmanager-hostname>:8081.
On the home screen, you will see an overview of your cluster configuration including the number of TaskManagers, number of configured and available task slots, and running and completed jobs. Figure 10-2 shows an instance of the dashboard home screen. The menu on the left links to more detailed information on jobs and configuration parameters and also allows job submission by uploading a JAR.
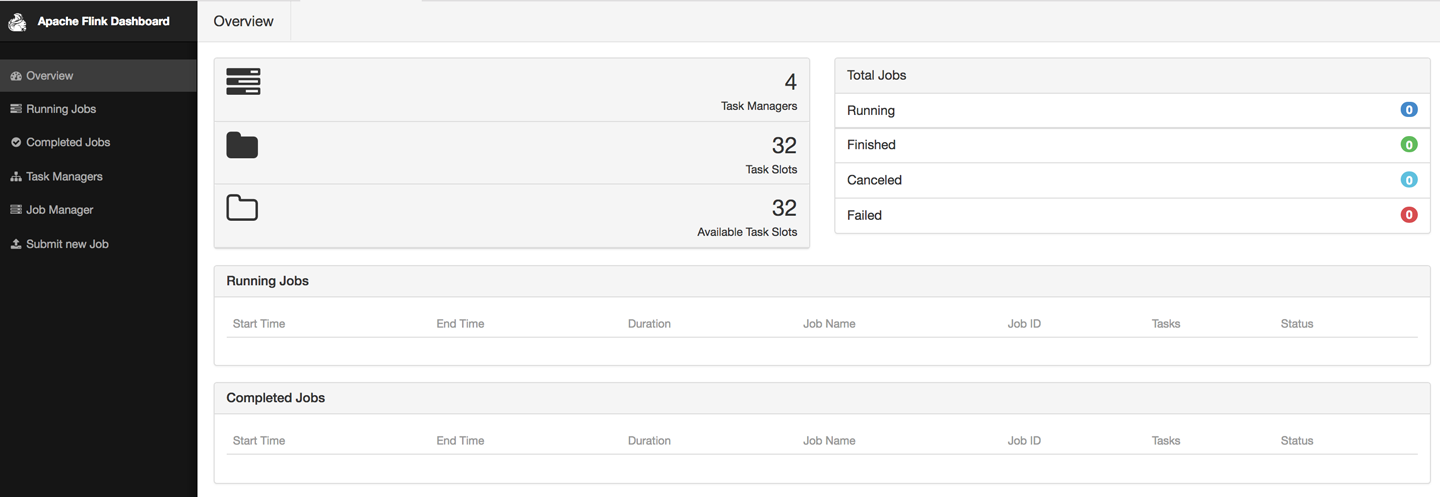
Figure 10-2. Apache Flink Web UI home screen
If you click on a running job, you can get a quick glimpse of running statistics per task or subtask as shown in Figure 10-3. You can inspect the duration, bytes, and records exchanged, and aggregate those per TaskManager if you prefer.

Figure 10-3. Statistics for a running job
If you click on the Task Metrics tab, you can select more metrics from a dropdown menu, as shown in Figure 10-4. These include more fine-grained statistics about your tasks, such as buffer usage, watermarks, and input/output rates.

Figure 10-4. Selecting metrics to plot
Figure 10-5 shows how selected metrics are shown as continuously updated charts.

Figure 10-5. Real-time metric plots
The Checkpoints tab (Figure 10-3) displays statistics about previous and current checkpoints. Under Overview you can see how many checkpoints have been triggered, are in progress, have completed successfully, or have failed. If you click on the History view, you can retrieve more fine-grained information, such as the status, trigger time, state size, and how many bytes were buffered during the checkpoint’s alignment phase. The Summary view aggregates checkpoint statistics and provides minimum, maximum, and average values over all completed checkpoints. Finally, under Configuration, you can inspect the configuration properties of checkpoints, such as the interval and the timeout values set.
Similarly, the Back Pressure tab displays back-pressure statistics per operator and subtask. If you click on a row, you trigger back-pressure sampling and you will see the message Sampling in progress... for about five seconds. Once sampling is complete, you will see the back-pressure status in the second column. Back-pressured tasks will display a HIGH sign; otherwise you should see a nice green OK message displayed.
Metric System
When running a data processing system such as Flink in production, it is essential to monitor its behavior to be able to discover and diagnose the cause of performance degradations. Flink collects several system and application metrics by default. Metrics are gathered per operator, TaskManager, or JobManager. Here we describe some of the most commonly used metrics and refer you to Flink’s documentation for a full list of available metrics.
Categories include CPU utilization, memory used, number of active threads, garbage collection statistics, network metrics such as the number of queued input/output buffers, cluster-wide metrics such as the number or running jobs and available resources, job metrics including runtime, the number of retries and checkpointing information, I/O statistics including the number of record exchanges locally and remotely, watermark information, connector-specific metrics, etc.
Registering and using metrics
To register metrics you have to retrieve a MetricGroup by calling the getMetrics() method on the RuntimeContext, as shown in Example 10-5.
Example 10-5. Registering and using metrics in a FilterFunction
classPositiveFilterextendsRichFilterFunction[Int]{@transientprivatevarcounter:Counter=_overridedefopen(parameters:Configuration):Unit={counter=getRuntimeContext.getMetricGroup.counter("droppedElements")}overridedeffilter(value:Int):Boolean={if(value>0){true}else{counter.inc()false}}}
Metric groups
Flink metrics are registered and accessed through the MetricGroup interface. The MetricGroup provides ways to create nested, named metrics hierarchies and provides methods to register the following metric types:
- Counter
-
An
org.apache.flink.metrics.Countermetric measures a count and provides methods for increment and decrement. You can register a counter metric using thecounter(String name, Counter counter)method onMetricGroup. - Gauge
-
A
Gaugemetric calculates a value of any type at a point in time. To use aGaugeyou implement theorg.apache.flink.metrics.Gaugeinterface and register it using thegauge(String name, Gauge gauge)method onMetricGroup. The code in Example 10-6 shows the implementation of theWatermarkGaugemetric, which exposes the current watermark.Example 10-6. Implementation of a WatermarkGauge metric that exposes the current watermark
publicclassWatermarkGaugeimplementsGauge<Long>{privatelongcurrentWatermark=Long.MIN_VALUE;publicvoidsetCurrentWatermark(longwatermark){this.currentWatermark=watermark;}@OverridepublicLonggetValue(){returncurrentWatermark;}}
Metrics Reported as Strings
Metric reporters will turn the Gauge value into a String, so make sure you provide a meaningful toString() implementation if it is not provided by the type you use.
- Histogram
-
You can use a histogram to represent the distribution of numerical data. Flink’s histogram is especially implemented for reporting metrics on long values. The
org.apache.flink.metrics.Histograminterface allows you to collect values, get the current count of collected values, and create statistics, such as min, max, standard deviation, and mean, for the values seen so far.Apart from creating your own histogram implementation, Flink also allows you to use a DropWizard histogram by adding the dependency in the following:
<dependency><groupId>org.apache.flink</groupId><artifactId>flink-metrics-dropwizard</artifactId><version>flink-version</version></dependency>You can then register a >DropWizard histogram in your Flink program using the
DropwizardHistogramWrapperclass as shown in Example 10-7.Example 10-7. Using the DropwizardHistogramWrapper
// create and register histogramDropwizardHistogramWrapperhistogramWrapper=newDropwizardHistogramWrapper(newcom.codahale.metrics.Histogram(newSlidingWindowReservoir(500)))metricGroup.histogram("myHistogram",histogramWrapper)// update histogramhistogramWrapper.update(value) - Meter
-
You can use a
Metermetric to measure the rate (in events per second) at which certain events happen. Theorg.apache.flink.metrics.Meterinterface provides methods to mark the occurrence of one or more events, get the current rate of events per second, and get the current number of events marked on the meter.As with histograms, you can use
DropWizardmeters by adding theflink-metrics-dropwizarddependency in yourpom.xmland wrapping the meter in aDropwizardMeterWrapperclass.
Scoping and formatting metrics
Flink metrics belong to a scope, which can be either the system scope, for system-provided metrics, or the user scope for custom, user-defined metrics. Metrics are referenced by a unique identifier that contains up to three parts:
- The name that the user specifies when registering the metric
- An optional user scope
- A system scope
For instance, the name “myCounter,” the user scope “MyMetrics,” and the system scope “localhost.taskmanager.512” would result into the identifier “localhost.taskmanager.512.MyMetrics.myCounter.” You can change the default “.” delimiter by setting the metrics.scope.delimiter configuration option.
The system scope declares what component of the system the metric refers to and what context information it should include. Metrics can be scoped to the JobManager, a TaskManager, a job, an operator, or a task. You can configure which context information the metric should contain by setting the corresponding metric options in the flink-conf.yaml file. We list some of these configuration options and their default values in Table 10-17.
| Scope | Configuration key | Default value |
|---|---|---|
| JobManager | metrics.scope.jm | <host>.jobmanager |
| JobManager and job | metrics.scope.jm.job | <host>.jobmanager.<job_name> |
| TaskManager | metrics.scope.tm | <host>.taskmanager.<tm_id> |
| TaskManager and job | metrics.scope.tm.job |
<host>.taskmanager.<tm_id>.<job_name> |
| Task | metrics.scope.task | <host>.taskmanager.<tm_id>.<job_name>.<task_name>.<subtask_index> |
| Operator | metrics.scope.operator | <host>.taskmanager.<tm_id>.<job_name>.<operator_name>.<subtask_index> |
The configuration keys contain constant strings, such as “taskmanager,” and variables shown in angle brackets. The latter will be replaced at runtime with actual values. For instance, the default scope for TaskManager metrics might create the scope “localhost.taskmanager.512” where “localhost” and “512” are parameter values. Table 10-18 shows all variables that are available to configure metrics scopes.
| Scope | Available Variables |
|---|---|
JobManager: |
<host> |
TaskManager: |
<host>, <tm_id> |
Job: |
<job_id>, <job_name> |
Task: |
<task_id>, <task_name>, <task_attempt_id>, <task_attempt_num>, <subtask_index> |
Operator: |
<operator_id>, <operator_name>, <subtask_index> |
Scope Identifiers per Job Must Be Unique
If multiple copies of the same job are run concurrently, metrics might become inaccurate, due to string conflicts. To avoid such risk, you should make sure that scope identifiers per job are unique. This can be easily handled by including the <job_id>.
You can also define a user scope for metrics by calling the addGroup() method of the MetricGroup, as shown in Example 10-8.
Example 10-8. Defining the user scope “MyMetrics”
counter=getRuntimeContext.getMetricGroup.addGroup("MyMetrics").counter("myCounter")
Exposing metrics
Now that you have learned how to register, define, and group metrics, you might be wondering how to access them from external systems. After all, you probably gather metrics because you want to create a real-time dashboard or feed the measurements to another application. You can expose metrics to external backends through reporters and Flink provides implementation for several of them (see Table 10-19 ).
| Reporter | Implementation |
|---|---|
JMX |
org.apache.flink.metrics.jmx.JMXReporter |
Graphite |
org.apache.flink.metrics.graphite.GraphiteReporter |
Prometheus |
org.apache.flink.metrics.prometheus.PrometheusReporter |
PrometheusPushGateway |
org.apache.flink.metrics.prometheus.PrometheusPushGatewayReporter |
StatsD |
org.apache.flink.metrics.statsd.StatsDReporter |
Datadog |
org.apache.flink.metrics.datadog.DatadogHttpReporter |
Slf4j |
org.apache.flink.metrics.slf4j.Slf4jReporter |
If you want to use a metrics backend that is not included in the above list, you can also define your own reporter by implementing the org.apache.flink.metrics.reporter.MetricReporter interface.
Reporters need to be configured in flink-conf.yaml. Adding the following lines to your configuration will define a JMX reporter “my_reporter” that listens to ports 9020-9040:
metrics.reporters: my_reporter
Metrics.reporter.my_jmx_reporter.class: org.apache.flink.metrics.jmx.JMXReporter
metrics.reporter.my_jmx_reporter.port: 9020-9040
Consult the Flink documentation for a full list of configuration options per supported reporter.
Monitoring Latency
Latency is probably one of the first metrics you want to monitor to assess the performance characteristics of your streaming job. At the same time, it is also one of the trickiest metrics to define in a distributed streaming engine with rich semantics such as Flink. In “Latency”, we defined latency broadly as the time it takes to process an event. You can imagine how a precise implementation of this definition can get problematic in practice if we try to track the latency per event in a high-rate streaming job with a complex dataflow. Considering window operators complicate latency tracking even further, if an event contributes to several windows, do we need to report the latency of the first invocation or do we need to wait until we evaluate all windows an event might belong to? And what if a window triggers multiple times?
Flink follows a simple and low-overhead approach to provide useful latency metric measurements. Instead of trying to strictly measure latency for each and every event, it approximates latency by periodically emitting a special record at the sources and allowing users to track how long it takes for this record to arrive at the sinks. This special record is called a latency marker, and it bears a timestamp indicating when it was emitted.
To enable latency tracking, you need to configure how often latency markers are emitted from the sources. You can do this by setting the latencyTrackingInterval in the ExecutionConfig as shown here:
env.getConfig.setLatencyTrackingInterval(500L)
The interval is specified in milliseconds. Upon receiving a latency marker, all operators except sinks forward it downstream. Latency markers use the same dataflow channels and queues as normal stream records, thus their tracked latency reflects the time records wait to be processed. However, they do not measure the time it takes for records to be processed or the time that records wait in state until they are processed.
Operators keep latency statistics in a latency gauge that contains min, max, and mean values, as well as 50, 95, and 99 percentile values. Sink operators keep statistics on latency markers received per parallel source instance, thus checking the latency marker at sinks can be used to approximate how long it takes for records to traverse the dataflow. If you would like to customize the handling the latency marker at operators, you can override the processLatencyMarker() method and retrieve the relevant information using the LatencyMarker’s methods getMarkedTime(), getVertexId(), and getSubTaskIndex().
Configuring the Logging Behavior
Logging is another essential tool for debugging and understanding the behavior of your applications. By default, Flink uses the SLF4J logging abstraction together with the log4j logging framework.
Example 10-9 shows a MapFunction that logs every input record conversion.
Example 10-9. Using logging in a MapFunction
importorg.apache.flink.api.common.functions.MapFunctionimportorg.slf4j.LoggerFactoryimportorg.slf4j.LoggerclassMyMapFunctionextendsMapFunction[Int,String]{LoggerLOG=LoggerFactory.getLogger(MyMapFunction.class)overridedefmap(value:Int):String={LOG.info("Converting value {} to string.",value)value.toString}}
To change the properties of log4j loggers, modify the log4j.properties file in the conf/ folder. For instance, the following line sets the root logging level to “warning”:
log4j.rootLogger=WARN
To set a custom filename and location of this file, pass the -Dlog4j.configuration= parameter to the JVM. Flink also provides the log4j-cli.properties file used by the command-line client and the log4j-yarn-session.properties file used by the command-line client when starting a YARN session.
An alternative to log4j is logback and Flink provides default configuration files for this backend as well. To use logback instead of log4j, you will need to remove log4j from the lib/ folder. We refer you to Flink’s documentation and the logback manual for details on how to set up and configure the backend.
Summary
In this chapter, we discussed how to run, manage, and monitor Flink applications in production. We explained the Flink component that collects and exposes system and application metrics, how to configure a logging system, and how to start, stop, resume, and rescale applications with the command-line client and the REST API.