Preface
Life is about stories. For many, these stories revolve around sports, and football specifically. A lot of us remember playing games in the backyard with our family and friends, while some were lucky enough to play those games under the lights and in front of fans. We love our heroes and loathe our rivals. We tell these stories to help us understand the past and try to predict the future. Football analytics, at its core, allows us to use information to tell more accurate stories about the game we love. They give us ammunition for some of the game’s most vexing questions.
For example, do the most championships make the best quarterback? Or the best passing statistics? What do the “best passing statistics” even mean? Are there things that players do that transcend the math? If so, are they simply transcending our current understanding of the game mathematically, only to be shown as brilliant once we have new and better information? Who should your favorite team draft if it is trying to win this year? What about in three years from now? Who should your grandmother draft in fantasy football? Which team should you bet on during your layover in Las Vegas during a football Sunday?
Following the success of the Moneyball approach in baseball (captured by Michael Lewis in the 2003 book published by W. W. Norton & Company), people now increasingly use math and statistics to help them properly formulate and answer questions like these. While football, an interconnected game of 22 players on a 100-yard field, might seem less amenable to statistical analysis than baseball, a game with many independent battles between pitcher and batter, folks have made substantial progress toward understanding and changing the game for the better.
Our aim is to get you started toward understanding how statistical analysis may also be applied to football. Hopefully, some of you will take what you learn from this book and contribute to the great data revolution of the game we all love. Each chapter of this book focuses on a problem in American football, while covering skills to answer the problem.
-
Chapter 1, “Football Analytics”, provides an overview of football analytics to this date, including problems that have been solved within the last few years. It then explores publicly available, play-by-play data to measure aggressiveness by National Football League (NFL) quarterbacks by looking at their average depth of target (aDOT).
-
Chapter 2, “Exploratory Data Analysis: Stable Versus Unstable Quarterback Statistics”, introduces exploratory data analysis (EDA) to examine which subset of quarterback passing data—short passing or long passing—is more stable year to year and how to use such analyses to look at regression candidates year to year or even week to week.
-
Chapter 3, “Simple Linear Regression: Rushing Yards Over Expected”, uses linear regression to normalize rushing data for NFL ball carriers. Normalizing data helps us adjust for context, such as the number of yards a team needs for a first down, which can affect the raw data outputs that a player produces.
-
Chapter 4, “Multiple Regression: Rushing Yards Over Expected”, expands upon the work in Chapter 3 to include more variables to normalize. For example, down and distance both affect expectation for a ball carrier, and hence both should be included in a model of rushing yards. You’ll then determine whether such a normalization adds to stability in rushing data. This chapter also explores the question “Do running backs matter?”
-
Chapter 5, “Generalized Linear Models: Completion Percentage over Expected”, illustrates how to use logistic regression to model quarterback completion percentage.
-
Chapter 6, “Using Data Science for Sports Betting: Poisson Regression and Passing Touchdowns”, shows how using Poisson regression can help us model game outcomes, and how those models apply to the betting markets.
-
Chapter 7, “Web Scraping: Obtaining and Analyzing Draft Picks”, uses web-scraping techniques to obtain NFL Draft data since the start of the millennium. You’ll then analyze whether any teams are better or worse than expected when it comes to picking players, after adjusting for the expectation of the pick.
-
Chapter 8, “Principal Component Analysis and Clustering: Player Attributes”, uses principal component analysis (PCA) and clustering to analyze NFL Scouting Combine data to determine player types via unsupervised learning.
-
Chapter 9, “Advanced Tools and Next Steps”, describes advanced tools for those of you wanting to take your analytics game to the next level.
In general, these chapters build upon one another because tools shown in one chapter may be used later. The book also includes three appendixes:
-
Appendix A, “Python and R Basics”, introduces Python and R to those of you who are new to the programs and need guidance obtaining them.
-
Appendix B, “Summary Statistics and Data Wrangling: Passing the Ball”, introduces summary statistics and data wrangling by using an example to demonstrate passing yards.
-
Appendix C, “Data-Wrangling Fundamentals”, provides an overview of more data-wrangling skills.
We have also included a Glossary at the end of the book to define terms.
We use case studies as the focus of this book. Table P-1 lists the case studies by chapter and the skills each case study covers.
| Case study | Technique | Location |
|---|---|---|
Motivating example: Home field advantage | Example framing a problem | |
Pass depth for quarterbacks | Obtaining NFL data in R and Python | |
Passing yards across seasons | Introduction to stability analysis with EDA | |
Predictor of rushing yards | Building a simple model to estimate rushing yards over expected (RYOE) | |
Multiple predictors of rushing yards | Building a multiple regression to estimate RYOE | |
Pass completion percentage | Using a logistic regression to estimate pass completion percentage | |
Betting on propositions (or props) | Using a Poisson regression to understand betting | |
Quantifying the Jets/Colts 2018 trade | Evaluating a draft trade | |
Evaluating all teams drafting | Comparing drafting outcomes across all NFL teams | |
Player NFL Scouting Combine attributes | Using multivariate methods to classify player attributes |
Who This Book Is For
Our book has two target audiences. First, we wrote the book for people who want to learn about football analytics by doing football analytics. We share examples and exercises that help you work through the problems you’d face. Throughout these examples and exercises, we show you how we think about football data and then how to analyze the data. You might be a fan who wants to know more about your team, a fantasy football player, somebody who cares about which teams win each week, or an aspiring football data analyst. Second, we wrote this book for people who want an introduction to data science but do not want to learn from classic datasets such as flower measurements from the 1930s or Titanic survivorship tables from 1912. Even if you will be applying data science to widgets at work, at least you can learn using an enjoyable topic like American football.
We assume you have a high school background in math but are maybe a bit rusty (that is to say, you’ve completed a precalculus course). You might be a high school student or somebody who has not had a math course in 30 years. We’ll explain concepts as we go. We also focus on helping you see how football can supply fun math story problems. Our book will help you understand some of the basic skills used daily by football analysts. For fans, this will likely be enough data science skills. For the aspiring football analyst, we hope that our book serves as a springboard for your dreams and lifelong learning.
To help you learn, this book uses public data. This allows you to re-create all our analyses as well as update the datasets for future seasons. For example, we use only data through the 2022 season because this was the last completed season before we finished writing the book. However, the tools we teach you will let you update our examples to include future years. We also show all the data-wrangling methods so that you can see how we format data. Although somewhat tedious at times, learning how to work with data will ultimately give you more freedom: you will not be dependent on others for clean data.
Who This Book Is Not For
We wrote this book for beginners and have included appendixes for people with minimal-to-no prior programming experience. People who have extensive experience with statistics and programming in R or Python would likely not benefit from this book (other than by seeing the kind of introductory problems that exist in football analytics). Instead, they should move on to more advanced books, such as R for Data Science, 2nd edition by Hadley Wickham et al. (O’Reilly, 2023) to learn more about R, or Python for Data Analysis, 3rd edition by Wes McKinney (O’Reilly, 2022) to learn more about Python. Or maybe you want to move into more advanced books on topics we touch upon in this book, such as multivariate statistics, regression analysis, or the Posit Shiny application.
We focus on simple examples rather than complex analysis. Likewise, we focus on simpler, easier-to-understand code rather than the most computationally efficient code. We seek to help you get started quickly and connect with real-world data. To use a quote often attributed to Antoine de Saint-Exupéry:
If you wish to build a ship, do not divide the men into teams and send them to the forest to cut wood. Instead, teach them to long for the vast and endless sea.
Thus, we seek to quickly connect you to football data, hoping this connection will inspire and encourage you to continue learning tools in greater depth.
How We Think About Data and How to Use This Book
We encourage you to work through this book by not only reading the code but also running the code, completing the exercises, and then asking your own football questions with data. Besides working through our examples, feel free to add in your own questions and create your own ideas. Consider creating a blog or GitHub page to showcase your new skills or share what you learn. Work through the book with a friend or two. Help each other when you get stuck and talk about what you find with data. The last step is especially important. We regularly think about and fine-tune how we share our datasets as we work as professional data scientists.
In our day jobs, we help people make decisions using data. In this book, we seek to share our tools and thought processes with you. Our formal academic training covered mathematics and statistics, but we did not truly develop our data science skills until we were required to analyze messy, ecological, and environmental data from the natural world. We had to clean, merge, and wrangle untidy data, all while figuring out what to do with gaps in the information available to us. And then we had to try to explain the meaning hidden within those messy datasets.
During the middle of the last decade, Eric starting applying his skills to football, first as a writer and then as an analyst, for a company called Pro Football Focus (PFF). Eventually, he left academia to join PFF full time, helping run its first data science group. During his time with PFF, he worked with all 32 NFL teams and over 130 college teams, before moving to his new role at SumerSports. Meanwhile, Richard continues to work with ecological data and helps people make decisions with this data—for example, how many fish need to be harvested from where in order to control an undesired species?
Although we both have advanced degrees, the ability to think clearly and explore data is more important than formal education. According to a quote attributed to Albert Einstein, “Imagination is more important than knowledge.” We think this holds true for football analytics as well. Asking the right question and finding a good enough answer is more important than what you currently know. Daily, we see how quantitative tools help us to expand our imagination by increasing our ability to look at and think about different questions and datasets. Thus, we are required to imagine important questions to guide our use of analytics.
A Football Example
Let’s say we want to know if the Green Bay Packers have a home-field advantage. Perhaps we disagree with a friend over whether the Frozen Tundra truly is the advantage that everyone says it is, or if fans are wasting their hard-earned money on an outsized chance of getting frostbite. Conceptually, we take the following steps:
-
We find data to help us answer our question.
-
We wrangle the data into a format to help us answer our question.
-
We explore the data by plotting and calculating summary statistics.
-
We fit a model to help us quantify and confirm our observations.
-
Lastly, and most importantly, we share our results (optionally, but possibly most importantly, we settle the wagers to the “questions” we answered with data).
For the Packers home-field advantage example, here are our concrete steps:
-
We use the
nflreadrpackage to obtain data, which is freely available to use. -
We wrangle the data to give us a score differential for each game.
-
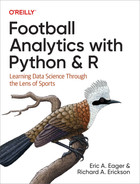
We create a plot such as that in Figure P-1 to help visualize the data.
-
We use a model to estimate the average difference point differential for home and away games.
-
We share our results with our friends who were debating this topic with us.
Given the data, the Packers typically have a point differential of two points higher at home compared to being on the road. This is in line with where home-field advantage is assumed to be across the league, although this number has evolved substantially over time.
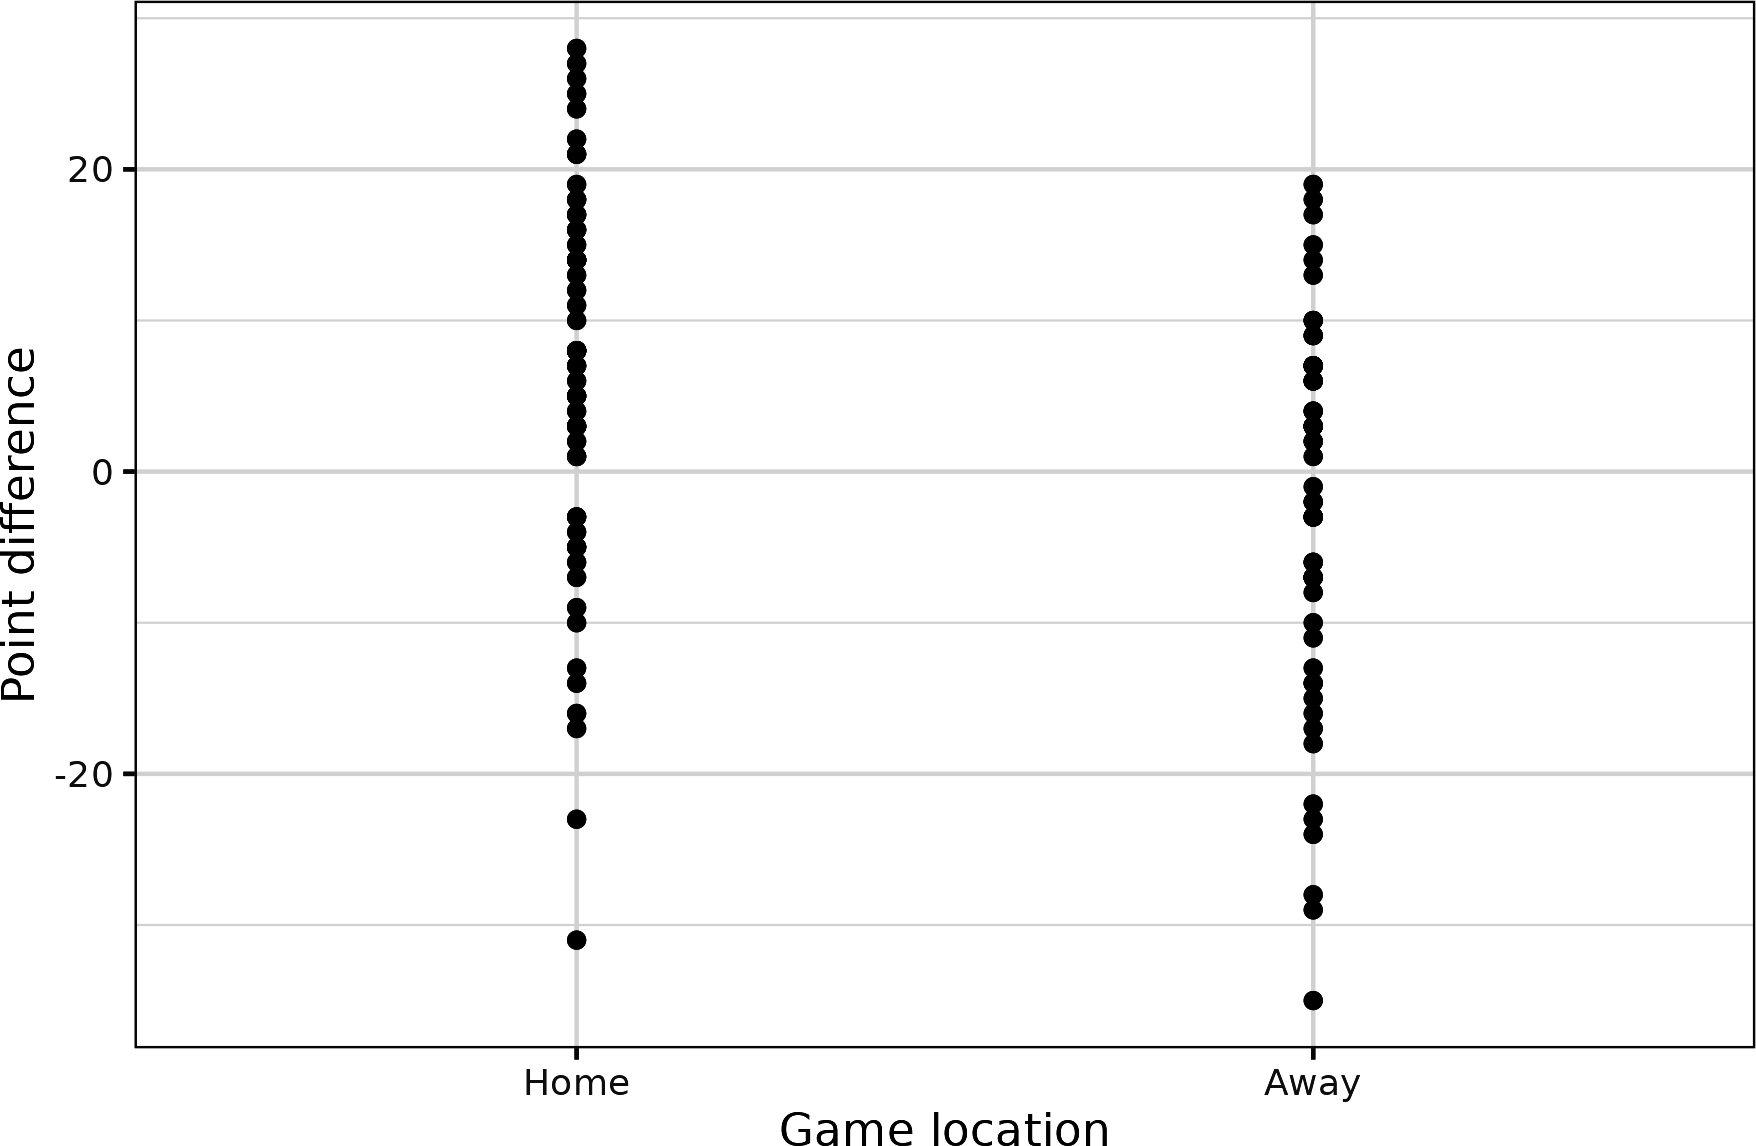
Figure P-1. Green Bay score differential in home and away games from 2016 to 2022
Hopefully, this observation raises more questions for you. For example, how much variability exists around this estimate? What happens if you throw out 2020, when fans were not allowed to attend games at the Packers home stadium? Does home-field advantage affect the first half or second half of games more? How do you adjust for quality of play and schedule differential? How does travel distance affect home-field advantage? Familiarity? Both (since familiarity and proximity are related)? How does weather differential affect home-field advantage? How does home-field advantage affect winning games compared to losing games?
Let’s quickly look at homefield advantage during games won by the Packers compared to games lost. Look at Figure P-2. Summaries for the data in this figure show that the Packers lose by one point more on the road compared to home games, but they win at home by almost six points more than they do on the road.
Figure P-2. Green Bay score differential in home and away games from 2016 to 2022 for winning and losing games
That being said, the Green Bay Packers are a good team and will likely have a positive point differential no matter what. The question of home-field advantage is not a trivial one and has perplexed analysts and bettors alike for decades. Hopefully, this example spurs more questions for you. If so, you’re reading the right book.
We cover step 1, obtaining football data, in Chapter 1. We cover step 2, exploring data, in Chapter 2. We cover step 3, data wrangling, in case studies throughout the book as well as in Appendixes B and C. We cover step 4 with basic statistics in Chapter 2 and Appendix B and then cover models in Chapters 3 through 8. We cover step 5 throughout various chapters as we describe what we have found. Lastly, we round out the book with Chapter 9, which describes some of the advanced tools we use daily.
What You Will Learn from Our Book
We have included materials in this book to help you start your journey into football analytics. For enthusiastic fans, our book may be enough to get you up and running. For people aspiring to be quantitative football analysts, our book will hopefully serve as a springboard. For people seeking to become a data scientist or improve their data science skills, our book provides worked examples of how data can be used to answer questions. We specifically teach the following:
-
How to visualize data
-
How to summarize data
-
How to model data
-
How to present the results of data analysis
-
How to use the previous techniques to tell a story
Conventions Used in This Book
The following typographical conventions are used in this book:
- Italic
-
Signifies new terms, URLs, email addresses, filenames, and file extensions.
Constant width-
Used for program listings, as well as within paragraphs to refer to program elements such as variable or function names, databases, data types, environment variables, statements, and keywords.
Constant width bold-
Shows commands or other text that should be typed literally by the user.
- Constant width italic
-
Shows text that should be replaced with user-supplied values or by values determined by context.
Tip
This element signifies a tip or suggestion.
Note
This element signifies a general note.
Warning
This element indicates a warning or caution.
Using Code Examples
Supplemental material (code examples, exercises, etc.) is available for download at https://github.com/raerickson/football_book_code.
If you have a technical question or a problem using the code examples, please send an email to [email protected].
This book is here to help you get your job done. In general, if example code is offered with this book, you may use it in your programs and documentation. You do not need to contact us for permission unless you’re reproducing a significant portion of the code. For example, writing a program that uses several chunks of code from this book does not require permission. Selling or distributing examples from O’Reilly books does require permission. Answering a question by citing this book and quoting example code does not require permission. Incorporating a significant amount of example code from this book into your product’s documentation does require permission.
We appreciate, but generally do not require, attribution. An attribution usually includes the title, author, publisher, and ISBN. For example: “Football Analytics with Python and R by Eric A. Eager and Richard A. Erickson (O’Reilly). Copyright 2023 Eric A. Eager and Richard A. Erickson, 978-1-492-09962-8.”
If you feel your use of code examples falls outside fair use or the permission given above, feel free to contact us at [email protected].
O’Reilly Online Learning
Note
For more than 40 years, O’Reilly Media has provided technology and business training, knowledge, and insight to help companies succeed.
Our unique network of experts and innovators share their knowledge and expertise through books, articles, and our online learning platform. O’Reilly’s online learning platform gives you on-demand access to live training courses, in-depth learning paths, interactive coding environments, and a vast collection of text and video from O’Reilly and 200+ other publishers. For more information, visit https://oreilly.com.
How to Contact Us
Please address comments and questions concerning this book to the publisher:
- O’Reilly Media, Inc.
- 1005 Gravenstein Highway North
- Sebastopol, CA 95472
- 800-889-8969 (in the United States or Canada)
- 707-829-7019 (international or local)
- 707-829-0104 (fax)
- [email protected]
- https://www.oreilly.com/about/contact.html
We have a web page for this book, where we list errata, examples, and any additional information. You can access this page at https://oreil.ly/football-analytics.
For news and information about our books and courses, visit https://oreilly.com.
Find us on LinkedIn: https://linkedin.com/company/oreilly-media
Follow us on Twitter: https://twitter.com/oreillymedia
Watch us on YouTube: https://youtube.com/oreillymedia
Acknowledgments
We thank our editors at O’Reilly, including Michelle Smith, Corbin Collins, Clare Laylock, and Aleeya Rahman for their support. We also thank Sharon Wilkey for copyediting our book, Larry Baker at Amnet Systems LLC for proofreading, and Cheryl Lenser at nSight, Inc. for creating our index. We thank Nick Adams and Danny Elfanbaum for technical assistance with the O’Reilly Atlas system. We thank Boyan Angelov, Richie Cotton, Matthew Coller, Molly Creagar, Ryan Day, Haley English, Chester Ismay, Kaelen Medeiros, George Mound, John Oliver, and Tobias Zwingmann for technical feedback. We also thank Richie Cotton for tips on writing a successful book proposal.
Eric would like to thank his wife, Stephanie, for her patience and constant support of his dreams, regardless of how crazy. He would also like to thank Neil Hornsby, whose vision in building PFF gave him a platform that has been the foundation for everything he’s done until now, and Thomas Dimitroff, for answering his email back in the fall of 2020. He’d also like to thank Paul and Jack Jones for their vision in starting SumerSports in 2022. Finally, Eric would like to thank his parents, who, despite not being huge football fans themselves, kindled the flames of his passion throughout his childhood.

Figure P-3. Margo (left) and Sadie (right) walking. Who is walking whom? (Photo by Richard Erickson)
Richard thanks his daughter, Margo, for sleeping well so he could write this after she went down for the night. He also thanks Sadie for foregoing walks while he was writing, as well as patiently (and impatiently) reminding him to take stretch breaks (Figure P-3). Richard also thanks his parents for raising him with curiosity and his brother for prodding him to learn to program and for help with this book’s proposal. Lastly, Richard thanks Tom Horvath and others from Hale, Skemp, Hanson, Skemp, & Sleik for support while writing this book.