Chapter 4. Optimize database objects and SQL infrastructure
In the previous chapter, we considered how to optimize database performance by managing concurrency. Database optimization also requires you not only to understand how SQL Server runs queries efficiently and uses its resources effectively, but also how to recognize problems that prevent it from doing so. Given this, you must know how to use the tools that help you find those problems and the steps that you can take to tune the SQL Server infrastructure for better performance.
Often the first step you take to improve your SQL Server query performance is to add indexes to tables, as we described in Chapter 1, “Design and implement database objects.” In Skill 4.1, we review the tasks you should perform periodically to ensure that the indexes you have are in fact helpful, and also to identify and resolve index issues. We then delve deeper into query performance optimization by exploring how to capture and analyze query plans in Skill 4.2. Then we shift our attention to the SQL Server infrastructure in Skill 4.3 to consider its impact on performance and understand how to use built-in tools to manage and troubleshoot the database engine’s use of resources. We close the chapter with Skill 4.4 in which we review the tools at your disposal for ongoing monitoring of your database infrastructure so that you are able to recognize when performance begins to deviate from normal and can take proactive action to keep SQL Server running at its best.
Skills in this chapter:
![]() Optimize statistics and indexes
Optimize statistics and indexes
![]() Analyze and troubleshoot query plans
Analyze and troubleshoot query plans
![]() Manage performance for database instances
Manage performance for database instances
![]() Monitor and trace SQL Server baseline performance metrics
Monitor and trace SQL Server baseline performance metrics
Skill 4.1: Optimize statistics and indexes
One way to significantly improve the performance of queries is to add one or more indexes to a table. When you create an index, SQL Server creates statistics, a database object in which statistical information about the distribution of values in a column or index is stored. An index improves query performance only if it is up-to-date and selected by SQL Server to resolve queries. Therefore, you should periodically review and optimize indexes as part of your regular routine.
This section covers how to:
![]() Determine the accuracy of statistics and associated impact to query plans and performance
Determine the accuracy of statistics and associated impact to query plans and performance
![]() Design statistics maintenance tasks
Design statistics maintenance tasks
![]() Use dynamic management objects to review current index usage and identify missing indexes
Use dynamic management objects to review current index usage and identify missing indexes
![]() Consolidate overlapping indexes
Consolidate overlapping indexes
Determine the accuracy of statistics and the associated impact to query plans and performance
SQL Server uses statistics to determine a column’s cardinality, which is the number of rows containing a specific value in a column. For example, when a value is unique in a column, such as a primary key, the cardinality is 1. When a column is highly unique like this, it is commonly characterized as having high selectivity or high cardinality. Conversely, when the number of unique values in a column are fewer or non-existent, the column has low selectivity and low cardinality. This information influences the query optimizer’s selection of an appropriate index as well as an efficient query plan. If the wrong index or query plan is selected, or if an index is missing, a query might not execute as optimally as possible. Therefore, the accuracy of the statistics is critical to query performance.
There are several ways that you can manage statistics. First, you can review the current statistics to determine whether the distribution of the data and the cardinality of data accessed by an index is likely to be helpful. In addition, you can control whether SQL Server updates statistics automatically. Last, you can check which objects have statistics managed by SQL Server and when they were last updated.
Review data distribution and cardinality
To see statistics for a table, use the DBCC SHOW_STATISTICS command to return the following information:
![]() Metadata about the statistics including date and time of the last update of the statistics, number of rows in the table, number of rows sampled, number of steps in the histogram, index density, average key length, whether the index contains string summary statistics, filtered predicate for statistics if applicable, and number of rows before applying the filter.
Metadata about the statistics including date and time of the last update of the statistics, number of rows in the table, number of rows sampled, number of steps in the histogram, index density, average key length, whether the index contains string summary statistics, filtered predicate for statistics if applicable, and number of rows before applying the filter.
![]() Index densities for the combination of columns in the index.
Index densities for the combination of columns in the index.
![]() A histogram of up to 200 sample values in the first key column in the index.
A histogram of up to 200 sample values in the first key column in the index.
Let’s create a simple index for the Purchasing.Suppliers table in the WideWorldImporters database and view its statistics, as shown in Listing 4-1, to explore the output of the DBCC SHOW_STATISTICS command.
LISTING 4-1 Create an index and show its statistics
USE WideWorldImporters;
GO
CREATE NONCLUSTERED INDEX IX_Purchasing_Suppliers_ExamBook762Ch4
ON Purchasing.Suppliers
(
SupplierCategoryID,
SupplierID
)
INCLUDE (SupplierName);
GO
DBCC SHOW_STATISTICS ('Purchasing.Suppliers',
IX_Purchasing_Suppliers_ExamBook762Ch4 );
/* Output
Name Updated Rows Rows Sampled Steps Density
Average key length String Index Filter Expression Unfiltered Rows
------------------------------ ---------------------- ---- -------------
IX_Purchasing_Suppliers_ExamBook762Ch4 Nov 7 2016 6:40AM 13 13 5 1
8 NO NULL 13
(1 row(s) affected)
All density Average Length Columns
----------------- ------------ ------------------------------------------
0.125 4 SupplierCategoryID
0.07692308 8 SupplierCategoryID, SupplierID
(2 row(s) affected)
RANGE_HI_KEY RANGE_ROWS EQ_ROWS DISTINCT_RANGE_ROWS AVG_RANGE_ROWS
--------------------- -------------------- ---------------- ---------------
2 0 6 0 1
4 1 1 1 1
6 1 1 1 1
8 1 1 1 1
9 0 1 0 1
(5 row(s) affected)
DBCC execution completed. If DBCC printed error messages, contact your system
administrator.
*/
The first result set is the statistics header that shows the name of the object for which statistics exist. In this case, the object is the IX_Purchasing_Suppliers_ExamBook762Ch4 index. You can see when the statistics were last updated, the number of rows in the index, the number of rows sampled for the statistics calculations, and the number of rows in the table without a filter. You also see a value for density in the statistics header. However, this density calculation is no longer used by the query optimizer in SQL Server 2016. Last, the average key length is 8 bytes, there are no string summary statistics, and no filter applied.
The second result set shows the densities of each combination of columns in the index. Density is calculated by dividing one by the count of distinct values in the column (or columns when you have a compound key). In Listing 4-1, the first row with SupplierCategoryID has higher density than the second row with SupplierCategoryID, SupplierID which means it has lower selectivity and is less helpful as an index. Conversely, the lower density of the second row indicates higher selectivity.
The last result set is the statistics histogram, which contains up to 200 sample values for the first column of the index. Each sample value is called a step and is listed in the RANGE_HI_KEY column. In Listing 4-1, there are only 5 sample values: 2, 4, 6, 8, and 9. For each step, SQL Server stores the following four values:
![]() RANGE_ROWS The number of rows inside the range between the current step and the previous step, but does not include the step values themselves.
RANGE_ROWS The number of rows inside the range between the current step and the previous step, but does not include the step values themselves.
![]() EQ_ROWS The number of rows having the same value as the sample value.
EQ_ROWS The number of rows having the same value as the sample value.
![]() DISTINCT_RANGE_ROWS The number of distinct values between the current step and the previous step, but does not include the step values themselves.
DISTINCT_RANGE_ROWS The number of distinct values between the current step and the previous step, but does not include the step values themselves.
![]() AVG_RANGE_ROWS The average number of rows for each distinct value with the step range.
AVG_RANGE_ROWS The average number of rows for each distinct value with the step range.
Note DBCC SHOW_STATISTICS
For more details about the DBCC SHOW_STATISTICS output, see https://msdn.microsoft.com/en-us/library/ms174384.aspx.
When creating an estimated query plan (described in more detail in Skill 4.2), SQL Server looks at the histogram to estimate the number of rows that match a WHERE clause in a query as long as the condition in the clause is a single constant expression, such as WHERE SupplierCategoryID = 3. When the expression uses two columns, as in WHERE SupplierCategoryID = 3 AND SupplierID = 10, SQL Server uses the index densities to estimate rows.
Let’s look at an example of how inaccurate statistics can affect a query plan. First, create a test database with automatic statistics updates disabled, load the table, add an index, and then review the statistics, as shown in Listing 4-2.
LISTING 4-2 Create test environment with automatic statistics disabled
CREATE DATABASE ExamBook762Ch4_Statistics;
GO
ALTER DATABASE ExamBook762Ch4_Statistics
SET AUTO_CREATE_STATISTICS OFF;
ALTER DATABASE ExamBook762Ch4_Statistics
SET AUTO_UPDATE_STATISTICS OFF;
ALTER DATABASE ExamBook762Ch4_Statistics
SET AUTO_UPDATE_STATISTICS_ASYNC OFF;
GO
USE ExamBook762Ch4_Statistics;
GO
CREATE SCHEMA Examples;
GO
CREATE TABLE Examples.OrderLines (
OrderLineID int NOT NULL,
OrderID int NOT NULL,
StockItemID int NOT NULL,
Description nvarchar(100) NOT NULL,
PackageTypeID int NOT NULL,
Quantity int NOT NULL,
UnitPrice decimal(18, 2) NULL,
TaxRate decimal(18, 3) NOT NULL,
PickedQuantity int NOT NULL,
PickingCompletedWhen datetime2(7) NULL,
LastEditedBy int NOT NULL,
LastEditedWhen datetime2(7) NOT NULL);
GO
INSERT INTO Examples.OrderLines
SELECT *
FROM WideWorldImporters.Sales.OrderLines;
GO
CREATE INDEX ix_OrderLines_StockItemID
ON Examples.OrderLines (StockItemID);
GO
DBCC SHOW_STATISTICS ('Examples.OrderLines',
ix_OrderLines_StockItemID );
GO
/* Partial Output
RANGE_HI_KEY RANGE_ROWS EQ_ROWS DISTINCT_RANGE_ROWS AVG_RANGE_ROWS
------------------ --------------- ----------- ------------------------ ---
1 0 1048 0 1
2 0 1078 0 1
4 1022 1066 1 1022
*/
When the index is added to the table, its statistics are also created. However, a significant number of inserts or updates to the table can render these statistics obsolete. Execute the statements in Listing 4-3 to update rows and check the statistics afterwards to confirm there has been no change.
LISTING 4-3 Update table rows and check statistics
UPDATE Examples.OrderLines
SET StockItemID = 1
WHERE OrderLineID < 45000;
DBCC SHOW_STATISTICS ('Examples.OrderLines',
ix_OrderLines_StockItemID );
GO
/* Partial Output
RANGE_HI_KEY RANGE_ROWS EQ_ROWS DISTINCT_RANGE_ROWS AVG_RANGE_ROWS
-------------- ------------- -------- --------------- ----------------
1 0 1048 0 1
2 0 1078 0 1
4 1022 1066 1 1022
*/
Next, click the Include Actual Execution Plan button in the toolbar, and then execute the following query:
SELECT StockItemID
FROM Examples.OrderLines
WHERE StockItemID = 1;
When you hover the cursor over the Index Seek (NonClustered) in the query plan, notice the difference between Actual Number Of Rows and Estimated Number Of Rows in the tooltip, shown in Figure 4-1. Because the statistics are out-of-date, the estimated row count is 1048, which is the value currently in the histogram for rows having StockItemID = 1. Because this value is relatively low, the query optimizer generated a plan using an index seek, which could be less optimal than performing a scan when data volumes are high.

Review automatic statistics updates
Statistics are generated when you add an index to a table that contains data or when you run the UPDATE STATISTICS command. In most cases, as illustrated by the previous example, you should allow SQL Server to create and update statistics automatically by setting one of the following database options, each of which is enabled by default:
![]() AUTO_UPDATE_STATISTICS SQL Server updates statistics automatically as needed. It determines an update is necessary by using a counter on modifications to column values. This counter is incremented when a row is inserted or deleted or when an indexed column is updated. The counter is reset to 0 when the statistics are generated. When it does this, it acquires compile locks and query plans might require recompilation. You can disable this option by using the sp_autostats system stored procedure.
AUTO_UPDATE_STATISTICS SQL Server updates statistics automatically as needed. It determines an update is necessary by using a counter on modifications to column values. This counter is incremented when a row is inserted or deleted or when an indexed column is updated. The counter is reset to 0 when the statistics are generated. When it does this, it acquires compile locks and query plans might require recompilation. You can disable this option by using the sp_autostats system stored procedure.
![]() AUTO_UPDATE_STATISTICS_ASYNC When it is enabled, SQL Server updates statistics asynchronously. That is, SQL Server uses a background thread so as not to block query execution. In this case, the query optimizer might choose a less than optimal query execution plan until the statistics are updated. Use the ALTER DATABASE T-SQL command to disable this option.
AUTO_UPDATE_STATISTICS_ASYNC When it is enabled, SQL Server updates statistics asynchronously. That is, SQL Server uses a background thread so as not to block query execution. In this case, the query optimizer might choose a less than optimal query execution plan until the statistics are updated. Use the ALTER DATABASE T-SQL command to disable this option.
![]() AUTO_CREATE_STATISTICS During query execution, SQL Server creates statistics on individual columns in query predicates to help the query optimizer improve query plans. Use the ALTER DATABASE T-SQL command to disable this option.
AUTO_CREATE_STATISTICS During query execution, SQL Server creates statistics on individual columns in query predicates to help the query optimizer improve query plans. Use the ALTER DATABASE T-SQL command to disable this option.
Even when statistics are set to update automatically, SQL Server does not update statistics unless one of the following thresholds is met:
![]() One or more rows is added to an empty table.
One or more rows is added to an empty table.
![]() More than 500 rows are added to a table having fewer than 500 rows.
More than 500 rows are added to a table having fewer than 500 rows.
![]() More than 500 rows are added to a table having more than 500 rows and the number of rows added is more than a dynamic percentage of total rows. With a small table under 25,000 rows, this percentage is around 20 percent. As the number of rows in the table increases, the percentage rate that triggers a statistics update is lower. For example, SQL Server updates statistics for a table with 1 billion rows when more than 1 million changes occur, or 0.1 percent. Prior to SQL Server 2016, this threshold was fixed at 20 percent of the original total number of rows in the table which means that 200 million rows were required to trigger an update of statistics.
More than 500 rows are added to a table having more than 500 rows and the number of rows added is more than a dynamic percentage of total rows. With a small table under 25,000 rows, this percentage is around 20 percent. As the number of rows in the table increases, the percentage rate that triggers a statistics update is lower. For example, SQL Server updates statistics for a table with 1 billion rows when more than 1 million changes occur, or 0.1 percent. Prior to SQL Server 2016, this threshold was fixed at 20 percent of the original total number of rows in the table which means that 200 million rows were required to trigger an update of statistics.
You can check to see if SQL Server automatically created statistics in a database by checking the value of the auto_created column in the sys.stats catalog view, as shown in Listing 4-4.
LISTING 4-4 Check auto-created statistics in a database
Use WideWorldImporters;
GO
SELECT
OBJECT_NAME(object_id) AS ObjectName,
name,
auto_created
FROM sys.stats
WHERE auto_created = 1 AND
object_id IN
(SELECT object_id FROM sys.objects WHERE type = 'U');
/* Partial Output
ObjectName name auto_created
------------------------------------------- --------------------
Colors_Archive _WA_Sys_00000001_04E4BC85 1
OrderLines _WA_Sys_00000006_05A3D694 1
OrderLines _WA_Sys_0000000C_05A3D694 1
plan_persist_runtime_stats _WA_Sys_00000006_0CBAE877 1
StockGroups_Archive _WA_Sys_00000001_10566F31 1
StateProvinces _WA_Sys_00000002_114A936A 1
StateProvinces _WA_Sys_00000009_114A936A 1
CustomerTransactions _WA_Sys_0000000B_15DA3E5D 1
*/
To check the last time the statistics were updated for each statistics object in a table, you can use the STATS_DATE system function as shown in Listing 4-5. As an alternative, you can use the sys.dm_db_stats_properties DMV to get row counts and modifications occurring since the last statistics update in addition to the last update date.
LISTING 4-5 Check last update of statistics for an object
SELECT
name AS ObjectName,
STATS_DATE(object_id, stats_id) AS UpdateDate
FROM sys.stats
WHERE object_id = OBJECT_ID('Sales.Customers');
/* Output
ObjectName UpdateDate
------------------------------- ---------------------------------------
PK_Sales_Customers 2016-06-02 10:07:35.170
UQ_Sales_Customers_CustomerName 2016-06-02 10:07:35.240
FK_Sales_Customers_CustomerCategoryID 2016-06-02 10:08:13.080
FK_Sales_Customers_BuyingGroupID 2016-06-02 10:07:38.010
FK_Sales_Customers_PrimaryContactPersonID 2016-06-02 10:07:43.027
FK_Sales_Customers_AlternateContactPersonID 2016-06-02 10:07:48.040
FK_Sales_Customers_DeliveryMethodID 2016-06-02 10:07:53.043
FK_Sales_Customers_DeliveryCityID 2016-06-02 10:07:58.060
FK_Sales_Customers_PostalCityID 2016-06-02 10:08:03.060
IX_Sales_Customers_Perf_20160301_06 2016-06-02 10:08:08.067
_WA_Sys_00000003_2FCF1A8A 2016-06-02 10:10:11.130
_WA_Sys_0000000B_2FCF1A8A 2016-06-02 10:10:11.623
_WA_Sys_0000001E_2FCF1A8A 2016-06-02 10:54:31.173
*/
Design statistics maintenance tasks
SQL Server creates and updates statistics automatically for all indexes and for columns used in a WHERE or JOIN ON clause. At one extreme, the automatic statistics update process might run when the database is busy and adversely affects performance or, at the other extreme, it might not run frequently enough for a table that is subject to high-volume data changes. For these situations, you can disable the automatic statistics update options for the database and then implement a maintenance plan to update statistics on demand or on a schedule.
Note Enabling SQL Server Agent extended stored procedures
Before you can create a maintenance plan, you must enable SQL Server Agent extended stored procedures. You can do this by starting the SQL Server Agent service in SQL Server Management Studio or by executing the following code:
EXEC sp_configure 'show advanced options', 1;
GO
RECONFIGURE;
GO
EXEC sp_configure 'Agent XPs', 1;
GO
RECONFIGURE;
GO
To create a maintenance plan, open SQL Server Management Studio. and then, in Object Explorer, expand the Management node, right click the Maintenance Plans folder, and then select either New Maintenance Plan or Maintenance Plan Wizard. If you select New Maintenance Plan, type a name for the maintenance plan. Then drag the Update Statistics Task from the Toolbox to the plan designer surface, as shown in Figure 4-2.

Double click the task to open the Update Statistics Task dialog box, shown in Figure 4-3.

In the Databases drop-down list, you can select one of the following options:
![]() All Databases All SQL Server databases, except tempdb.
All Databases All SQL Server databases, except tempdb.
![]() System Databases All SQL Server system databases, except tempdb.
System Databases All SQL Server system databases, except tempdb.
![]() All User Databases (Excluding Master, Model, Msdb, Tempdb) All user databases and none of the SQL Server system databases.
All User Databases (Excluding Master, Model, Msdb, Tempdb) All user databases and none of the SQL Server system databases.
![]() These Databases A list of user and SQL Server system databases (except tempdb) from which you must select at least one database. If you select this option, you must also specify whether to update statistics for tables, views, or both tables and views. If you select Tables or Views, you must also select one or more tables or views from the respective list.
These Databases A list of user and SQL Server system databases (except tempdb) from which you must select at least one database. If you select this option, you must also specify whether to update statistics for tables, views, or both tables and views. If you select Tables or Views, you must also select one or more tables or views from the respective list.
Then you specify one of the following options for the update:
![]() All Existing Statistics Statistics for both columns and indexes.
All Existing Statistics Statistics for both columns and indexes.
![]() Column Statistics Only Statistics for columns only.
Column Statistics Only Statistics for columns only.
![]() Index Statistics Only Statistics for indexes only.
Index Statistics Only Statistics for indexes only.
Last, you select one of the following options for scan type:
![]() Full Scan Update statistics by reading all rows in a table or view.
Full Scan Update statistics by reading all rows in a table or view.
![]() Sample By Update statistics based on a specified percentage or specified number of rows. This is a better option when updating statistics for a large table or view.
Sample By Update statistics based on a specified percentage or specified number of rows. This is a better option when updating statistics for a large table or view.
You can click the View T-SQL button at the bottom of the Update Statistics Task dialog box to generate the T-SQL script for the new maintenance task. Then you can use this script as a template to create additional maintenance plans for updating statistics. Listing 4-6 shows a portion of the script generated for the WideWorldImporters database:
LISTING 4-6 Script to update statistics for a specific table
USE WideWorldImporters;
GO
UPDATE STATISTICS [Application].[Cities]
WITH FULLSCAN
GO
Note UPDATE STATISTICS options
You can add any of the following options when using the UPDATE STATISTICS statement.
![]() No FULLSCAN or SAMPLE option If you omit the FULLSCAN or SAMPLE option, SQL Server calculates statistics by computing an appropriate sample size and performing a sample scan.
No FULLSCAN or SAMPLE option If you omit the FULLSCAN or SAMPLE option, SQL Server calculates statistics by computing an appropriate sample size and performing a sample scan.
![]() FULLSCAN SQL Server performs a full scan of the table data or the index to generate more accurate statistics, although this option takes more time and more IO.
FULLSCAN SQL Server performs a full scan of the table data or the index to generate more accurate statistics, although this option takes more time and more IO.
![]() SAMPLE With this option, you specify the number or percentage of rows that SQL Server samples when generating the statistics.
SAMPLE With this option, you specify the number or percentage of rows that SQL Server samples when generating the statistics.
![]() RESAMPLE SQL Server generates the statistics using the same sampling ratio that was defined during the previous statistics generation.
RESAMPLE SQL Server generates the statistics using the same sampling ratio that was defined during the previous statistics generation.
The maintenance task should be scheduled at a time that interferes least with regular database operations. On the Maintenance Plan designer, click the Subplan Schedule button to open the New Job Schedule dialog box. Here you can specify whether the maintenance plan is a recurring schedule, whether it runs only when SQL Server starts or when the CPU is idle, or one time only. If you choose the Recurring option, you specify a frequency, and a start and optional end date. If you instead choose the One Time option, you specify the date and time to execute the maintenance plan. When you save the schedule, a SQL Server Agent job is created and the job executes as a SQL Server Integration Services (SSIS) package.
You can also execute a maintenance plan without waiting for the scheduled SQL Server Agent job. To do this, expand the Management node, expand the Maintenance Plan node, right click the maintenance plan, and then select Execute. When you use this method, the SSIS package is launched and you can observe the execution status in the Execute Maintenance Plan dialog box.
Use dynamic management objects to review current index usage and identify missing indexes
SQL Server uses indexes to speed up data access. In Chapter 1, we covered many of the considerations affecting the design of tables. Over time, you might find that some indexes are not as helpful as expected due to changes in the distribution of the data or in the query patterns. Furthermore, the existence of an index that SQL Server never uses adds overhead to write operations. Therefore, it’s important to periodically review indexes not only to determine whether existing indexes are still useful, but also whether any are ignored or missing.
In this section, we review several dynamic management objects (DMOs) that are useful for this review process. We focus on how to perform specific review tasks that are important for index management without delving into all the possible information that you can derive from using these DMOs.
Need More Review? Resources for managing indexes with DMOs
You can find more detail about each DMO by accessing the respective topic in Books Online. For deeper coverage of index management by using DMOs, download the free ebook “Performance Tuning with Dynamic Management Views” by Tim Ford and Louis Davidson available at https://www.simple-talk.com/books/sql-books/performance-tuning-with-sql-server-dynamic-management-views---ebook-download.
Review current index usage
The following DMOs provide information about whether and how indexes are used:
![]() sys.dm_db_index_usage_stats Use this DMV to review the use of indexes to resolve queries.
sys.dm_db_index_usage_stats Use this DMV to review the use of indexes to resolve queries.
![]() sys.dm_db_index_physical_stats Use this dynamic management function (DMF) to check the overall status of indexes in a database.
sys.dm_db_index_physical_stats Use this dynamic management function (DMF) to check the overall status of indexes in a database.
sys.dm_db_index_usage_stats
To get a quick overview of which indexes are being used, you can use the sys.dm_db_index_usage_stats DMV as shown in Listing 4-7. To appear in this DMV’s output, an index must be read or written to at least once by a user or system operation. In this example, the count of user seeks, scans, and lookups are aggregated as user_reads and sorted in descending order to make it clear which indexes are used more frequently than others. Counts in this DMV are reset when the server restarts or when an index is dropped and recreated.
LISTING 4-7 Review current index usage
SELECT
OBJECT_NAME(ixu.object_id, DB_ID('WideWorldImporters')) AS [object_name] ,
ix.[name] AS index_name ,
ixu.user_seeks + ixu.user_scans + ixu.user_lookups AS user_reads,
ixu.user_updates AS user_writes
FROM sys.dm_db_index_usage_stats ixu
INNER JOIN WideWorldImporters.sys.indexes ix ON
ixu.[object_id] = ix.[object_id] AND
ixu.index_id = ix.index_id
WHERE ixu.database_id = DB_ID('WideWorldImporters')
ORDER BY user_reads DESC;
/*Partial Output
object_name index_name user_reads user_writes
------------------------------------------- --------------- ---------------
StockGroups PK_Warehouse_StockGroups 19 0
Suppliers PK_Purchasing_Suppliers 13 0
ColdRoomTemperatures_Archive ix_ColdRoomTemperatures_Archive 0 1959
StockItems FK_Warehouse_StockItems_SupplierID 0 0
*/
Just as important as knowing which indexes are being accessed is knowing which indexes are never used. To find these indexes, you must start by retrieving all tables and indexes in a database and then filter out those appearing in sys.dm_db_index_usage_stats as shown in Listing 4-8.
LISTING 4-8 Find unused indexes
USE WideWorldImporters;
GO
SELECT
OBJECT_NAME(ix.object_id) AS ObjectName ,
ix.name
FROM sys.indexes AS ix
INNER JOIN sys.objects AS o ON
ix.object_id = o.object_id
WHERE ix.index_id NOT IN (
SELECT ixu.index_id
FROM sys.dm_db_index_usage_stats AS ixu
WHERE
ixu.object_id = ix.object_id AND
ixu.index_id = ix.index_id AND
database_id = DB_ID()
) AND
o.[type] = 'U'
ORDER BY OBJECT_NAME(ix.object_id) ASC ;
/* Partial Output
ObjectName name
------------------------------------------------------------------------------
BuyingGroups UQ_Sales_BuyingGroups_BuyingGroupName
BuyingGroups_Archive ix_BuyingGroups_Archive
Cities_Archive ix_Cities_Archive
ColdRoomTemperatures NULL
ColdRoomTemperatures PK_Warehouse_ColdRoomTemperatures
ColdRoomTemperatures IX_Warehouse_ColdRoomTemperatures_ColdRoomSensorNumber
*/
Whereas the previous example helps you find indexes for which there is no read or write activity, Listing 4-9 helps you find indexes that SQL Server maintains but never uses to retrieve data for a query. These indexes are consuming resources without helping query performance. You should consider dropping these indexes if further investigation reveals that there is no need to continue to maintain them.
LISTING 4-9 Find indexes that are updated but never used
USE WideWorldImporters;
GO
SELECT
o.name AS ObjectName ,
ix.name AS IndexName ,
ixu.user_seeks + ixu.user_scans + ixu.user_lookups AS user_reads ,
ixu.user_updates AS user_writes ,
SUM(p.rows) AS total_rows
FROM sys.dm_db_index_usage_stats ixu
INNER JOIN sys.indexes ix ON
ixu.object_id = ix.object_id AND
ixu.index_id = ix.index_id
INNER JOIN sys.partitions p ON
ixu.object_id = p.object_id AND
ixu.index_id = p.index_id
INNER JOIN sys.objects o ON
ixu.object_id = o.object_id
WHERE
ixu.database_id = DB_ID() AND
OBJECTPROPERTY(ixu.object_id, 'IsUserTable') = 1 AND
ixu.index_id > 0
GROUP BY
o.name ,
ix.name ,
ixu.user_seeks + ixu.user_scans + ixu.user_lookups ,
ixu.user_updates
HAVING ixu.user_seeks + ixu.user_scans + ixu.user_lookups = 0
ORDER BY
ixu.user_updates DESC,
o.name ,
ix.name ;
/* Output
ObjectName IndexName user_reads user_writes total_rows
-------------------------- ---------------- ---------------- -----------------
ColdRoomTemperatures_Archive ix_ColdRoomTemperatures_Archive 0 2016 3654736
StockItems FK_Warehouse_StockItems_SupplierID 0 0 227
*/
sys.dm_db_index_physical_stats
In addition to reviewing usage of indexes, you should also review index health by using the sys.dm_db_index_physical_stats DMF. As inserts, updates, and deletes occur, an index becomes increasingly fragmented and IO increases as data is no longer efficiently stored on disk. Listing 4-10 shows how to review fragmentation. In general, you should focus on indexes for which fragmentation is greater than 15percent and the page count is greater than 500. When fragmentation is between 15 percent and 30 percent, you should reorganize the index, and when its greater, you should rebuild it.
LISTING 4-10 Review index fragmentation
DECLARE @db_id SMALLINT, @object_id INT;
SET @db_id = DB_ID(N'WideWorldImporters');
SET @object_id = OBJECT_ID(N'WideWorldImporters.Sales.Orders');
SELECT
ixs.index_id AS idx_id,
ix.name AS ObjectName,
index_type_desc,
page_count,
avg_page_space_used_in_percent AS AvgPageSpacePct,
fragment_count AS frag_ct,
avg_fragmentation_in_percent AS AvgFragPct
FROM sys.dm_db_index_physical_stats
(@db_id, @object_id, NULL, NULL , 'Detailed') ixs
INNER JOIN sys.indexes ix ON
ixs.index_id = ix.index_id AND
ixs.object_id = ix.object_id
ORDER BY avg_fragmentation_in_percent DESC;
/* Output
idx_id ObjectName index_type_desc pg_ct AvgPageSpacePct frag_ct AvgFragPct
-------- ---------------------------------- ---------- ---------------------------
4 FK_Sales_Orders_PickedByPersonID NONCLUSTERED INDEX 237 53.6864838151717 237
99.57805907173
2 FK_Sales_Orders_CustomerID NONCLUSTERED INDEX 189 67.3274277242402 189
97.8835978835979
5 FK_Sales_Orders_ContactPersonID NONCLUSTERED INDEX 189 67.3274277242402 189
97.8835978835979
3 FK_Sales_Orders_SalespersonPersonID NONCLUSTERED INDEX 136 93.5749444032617 136
97.0588235294118
1 PK_Sales_Orders CLUSTERED INDEX 688 99.0945268099827 88
0.290697674418605
1 PK_Sales_Orders CLUSTERED INDEX 2 55.2260934025204 2 0
1 PK_Sales_Orders CLUSTERED INDEX 1 0.296515937731653 1 0
2 FK_Sales_Orders_CustomerID NONCLUSTERED INDEX 1 39.6713615023474 1 0
3 FK_Sales_Orders_SalespersonPersonID NONCLUSTERED INDEX 1 28.5396590066716 1 0
4 FK_Sales_Orders_PickedByPersonID NONCLUSTERED INDEX 1 58.5001235483074 1 0
5 FK_Sales_Orders_ContactPersonID NONCLUSTERED INDEX 1 39.6713615023474 1 0
*/
Identify missing indexes
When the query optimizer compiles a T-SQL statement, it also tracks up to 500 indexes that could have been used if they had existed. The following DMVs help you review these missing indexes:
![]() sys.dm_db_missing_index_details Use this DMV to identify the columns used for equality and inequality predicates.
sys.dm_db_missing_index_details Use this DMV to identify the columns used for equality and inequality predicates.
![]() sys.dm_db_missing_index_groups Use this DMV as an intermediary between sys.dm_db_index_details and sys.dm_db_missing_group_stats.
sys.dm_db_missing_index_groups Use this DMV as an intermediary between sys.dm_db_index_details and sys.dm_db_missing_group_stats.
![]() sys.dm_db_missing_index_group_stats Use this DMV to retrieve metrics on a group of missing indexes.
sys.dm_db_missing_index_group_stats Use this DMV to retrieve metrics on a group of missing indexes.
Note SQL Server restart clears information from DMOs
The information in these DMOs is cleared when SQL Server restarts and reflects only information accumulated since the last restart.
You use the three DMVs as a group, as shown in Listing 4-11. The output, which will vary on your computer, will list each database, schema, and table that is missing an index in descending order of the overall improvement expected by adding an index. The improvement is derived by multiplying the sum of the seeks and scans that the index helps by the average cost of the user queries that could be reduced by the index and by the average percent decrease in cost resulting from implementing the index. The equality_columns column lists one or more columns in the table that are good candidates for the new index. The inequality_columns column lists columns that are useful for queries that include the <> operator that you might consider adding to the index. Last, the included_columns column lists the columns that are suggested for addition to the index in the INCLUDE clause.
LISTING 4-11 Review missing indexes
SELECT
(user_seeks + user_scans) * avg_total_user_cost * (avg_user_impact * 0.01) AS
IndexImprovement,
id.statement,
id.equality_columns,
id.inequality_columns,
id.included_columns
FROM sys.dm_db_missing_index_group_stats AS igs
INNER JOIN sys.dm_db_missing_index_groups AS ig
ON igs.group_handle = ig.index_group_handle
INNER JOIN sys.dm_db_missing_index_details AS id
ON ig.index_handle = id.index_handle
ORDER BY IndexImprovement DESC;
/* Output
IndexImprovmeent statement equality_columns inequality_columns included_columns
-------------------------- ------------------------------ -------------------------
79.89008274829 [AdventureWorksDW].[dbo].[FactInternetSales] [ProductKey] NULL
[CustomerKey]
*/
Consolidate overlapping indexes
Consider a situation in which two indexes include similar indexes such as those shown in Listing 4-12. In this example, the two indexes are the same except one index contains an additional column. When SQL Server processes a query that needs the columns in the smaller index, it uses the smaller index. Conversely, when processing a query that uses all columns in the larger index, then SQL Server uses that index.
LISTING 4-12 Create overlapping indexes
USE [WideWorldImporters];
GO
CREATE NONCLUSTERED INDEX [IX_Sales_Invoices_ExamBook762Ch4_A]
ON [Sales].[Invoices]
(
[CustomerID],
[InvoiceDate]
)
INCLUDE ([TotalDryItems]);
GO
CREATE NONCLUSTERED INDEX [IX_Sales_Invoices_ExamBook762Ch4_B]
ON [Sales].[Invoices]
(
[CustomerID],
[InvoiceDate],
[CustomerPurchaseOrderNumber]
)
INCLUDE ([TotalDryItems]);
GO
With regard to query performance, all is well. However, SQL Server has an additional index to manage and requires more disk space for the database when similar indexes exist. This situation can occur when you create new indexes based on the DMVs for missing indexes or follow the recommendations from the Database Engine Tuning Advisor because they do not always account for existing indexes. Therefore, when using the DMVs or Database Engine Tuning Advisor to identify missing indexes, you might consider simply adding a new column to an existing index by adding it as another key or as an included column.
Meanwhile, when you encounter overlapping indexes, you should drop one of them so that database maintenance tasks run faster and less storage is required. Use the script in Listing 4-13 to find overlapping indexes.
![]() Exam Tip
Exam Tip
The exam has several different styles of questions to test your understanding of missing indexes and overlapping indexes. In particular, you should know how to identify overlapping indexes and what actions are necessary to consolidate and optimize them. It’s also important to understand which operators can be removed with a clustered or covering index.
LISTING 4-13 Find overlapping indexes
USE [WideWorldImporters];
WITH IndexColumns AS (
SELECT
'[' + s.Name + '].[' + T.Name + ']' AS TableName,
ix.name AS IndexName,
c.name AS ColumnName,
ix.index_id,
ixc.index_column_id,
COUNT(*) OVER(PARTITION BY t.OBJECT_ID, ix.index_id) AS ColumnCount
FROM sys.schemas AS s
INNER JOIN sys.tables AS t ON
t.schema_id = s.schema_id
INNER JOIN sys.indexes AS ix ON
ix.OBJECT_ID = t.OBJECT_ID
INNER JOIN sys.index_columns AS ixc ON
ixc.OBJECT_ID = ix.OBJECT_ID AND
ixc.index_id = ix.index_id
INNER JOIN sys.columns AS c ON
c.OBJECT_ID = ixc.OBJECT_ID AND
c.column_id = ixc.column_id
WHERE
ixc.is_included_column = 0 AND
LEFT(ix.name, 2) NOT IN ('PK', 'UQ', 'FK')
)
SELECT DISTINCT
ix1.TableName,
ix1.IndexName AS Index1,
ix2.IndexName AS Index2
FROM IndexColumns AS ix1
INNER JOIN IndexColumns AS ix2 ON
ix1.TableName = ix2.TableName AND
ix1.IndexName <> ix2.IndexName AND
ix1.index_column_id = ix2.index_column_id AND
ix1.ColumnName = ix2.ColumnName AND
ix1.index_column_id < 3 AND
ix1.index_id < ix2.index_id AND
ix1.ColumnCount <= ix2.ColumnCount
ORDER BY ix1.TableName, ix2.IndexName;
/* Output
TableName Index1 Index2
-------------------------------------------------------------------
[Sales].[Invoices] IX_Sales_Invoices_ExamBook762Ch4_A
IX_Sales_Invoices_ExamBook762Ch4_B
[Sales].[OrderLines]IX_Sales_OrderLines_AllocatedStockItems
IX_Sales_OrderLines_Perf_20160301_02
*/
Skill 4.2: Analyze and troubleshoot query plans
One of the most important skills that you can have as a database administrator is the ability to analyze and troubleshoot query plans. In this section, we explain how to capture query plans, how certain query plan operators can indicate a potential performance problem, and how to interpret estimated versus actual query plans. We also introduce Query Store as a SQL Server 2016 feature that you can use to review SQL Server’s selection of query plans for a query over time. For Azure SQL Database implementations, we show you how Azure SQL Database Performance Insight provides visibility into query performance in the cloud.
This section covers how to:
![]() Capture query plans using extended events and traces
Capture query plans using extended events and traces
![]() Identify poorly performing query plan operators
Identify poorly performing query plan operators
![]() Create efficient query plans using Query Store
Create efficient query plans using Query Store
![]() Compare estimated and actual query plans and related metadata
Compare estimated and actual query plans and related metadata
![]() Configure Azure SQL Database Performance Insight
Configure Azure SQL Database Performance Insight
Capture query plans using extended events and traces
Before a query executes, several processes occur to manage how SQL Server performs the instructions in the T-SQL statement. The first process is query parsing, a step in which the database engine checks to make sure the submitted query uses valid T-SQL syntax. If query parsing is successful and if the T-SQL statement is a DML statement, the next process to run is the algebrizer, which verifies the existence of the referenced objects, such as tables and columns. If this process succeeds, the next process invoked is the query optimizer. The query optimizer checks to see if a query plan already exists for the query. If not, it generates one or more query plans based on the statistics available for the data and then selects the query plan that is good enough to perform the task at hand while minimizing the use CPU and IO when possible.
Although you can use the graphical query plan to analyze a single query, such as you might during index design as described in Chapter 1, you need an alternate approach when you need to troubleshoot many queries running on a server. In that case, you can automate the process of capturing execution plans by using extended events or SQL Trace.
Important Permissions required to view a query plan
You must have the appropriate permissions within a database to view a query plan. If your login is assigned to the sysadmin, dbcreator, or db_owner role, you have the necessary permissions. Otherwise, you need to be granted the SHOWPLAN permission by running the following statement:
GRANT SHOWPLAN TO [username];
Extended Events
Using Extended Events is a lightweight approach to capturing query plans. There are two Extended Events that you can use to review query plans:
![]() query_pre_execution_showplan This Extended Event captures the estimated query plan for a query. An estimated query plan is prepared without executing the query.
query_pre_execution_showplan This Extended Event captures the estimated query plan for a query. An estimated query plan is prepared without executing the query.
![]() query_post_execution_showplan This Extended Event captures the actual query plan for a query. An actual query plan is the estimated query plan that includes runtime information. For this reason, it is not available until after the query executes.
query_post_execution_showplan This Extended Event captures the actual query plan for a query. An actual query plan is the estimated query plan that includes runtime information. For this reason, it is not available until after the query executes.
Listing 4-14 shows how to create and start an Extended Event session for actual query plans. In this example, the session definition filters the query activity on the server for a specific database and query type, ADHOC. In your own environment, you can remove filters entirely or apply more filters as needed. We describe how to work with Extended Events in greater detail in Skill 4.4.
Note Create target folder for query plan before running sample script
The target folder for the query plan, C:ExamBook762Ch4, must exist before running the script shown in Listing 4-14.
Also, be aware that running an Extended Event session to capture actual query plans is an expensive operation and should be used sparingly on a production server and only with highly selective filtering in place.
LISTING 4-14 Create and start an Extended Event session to capture an actual query plan
IF EXISTS(SELECT *
FROM sys.server_event_sessions
WHERE name='ActualQueryPlans')
DROP EVENT SESSION ActualQueryPlans
ON SERVER;
GO
CREATE EVENT SESSION ActualQueryPlans
ON SERVER
ADD EVENT sqlserver.query_post_execution_showplan(
ACTION (sqlserver.database_name,
sqlserver.client_hostname,
sqlserver.client_app_name,
sqlserver.plan_handle,
sqlserver.sql_text,
sqlserver.tsql_stack,
package0.callstack,
sqlserver.query_hash,
sqlserver.session_id,
sqlserver.request_id)
WHERE
sqlserver.database_name='WideWorldImporters' AND
object_type = 'ADHOC'
)
ADD TARGET package0.event_file(SET filename=N'C:ExamBook762Ch4ActualQueryPlans.xel',
max_file_size=(5),max_rollover_files=(4)),
ADD TARGET package0.ring_buffer
WITH (MAX_DISPATCH_LATENCY=5SECONDS, TRACK_CAUSALITY=ON);
GO
ALTER EVENT SESSION ActualQueryPlans
ON SERVER
STATE=START;
GO
You can review the query plans captured by this Extended Event using the graphical interface in SQL Server Management Studio. In Object Explorer, expand the Management node, expand the Sessions node, right click ActualQueryPlans, and select Watch Live Data. Now that you are watching the sessions, execute a query, like this:
USE WideWorldImporters;
GO
SELECT *
FROM Warehouse.StockGroups;
In the session window, click the row in which the query event appears, and then click the Query Plan tab in the lower portion of screen, as shown in Figure 4-4.

When you no longer need to capture query plans, be sure to disable or drop the Extended Event session, using the applicable statement in Listing 4-15.
LISTING 4-15 Disable or drop extended event sessions
--Disable extended event session
ALTER EVENT SESSION ActualQueryPlans
ON SERVER
STATE=STOP;
GO
--Drop extended event session
IF EXISTS(SELECT *
FROM sys.server_event_sessions
WHERE name='ActualQueryPlans')
DROP EVENT SESSION ActualQueryPlans
ON SERVER;
GO
SQL Trace
Although SQL Trace is designated as a deprecated feature and will be removed from a future release of SQL Server, it remains an available option in SQL Server 2016. You can define server-side traces by using system stored procedures and then run these traces on demand or on a scheduled basis. As an alternative, you can use SQL Server Profiler as a client-side option. The overhead of running server-side traces is much less than the overhead of using SQL Server Profiler, but the overhead is still significant. Therefore, take care when using SQL Trace in a production environment regardless of the approach you take and disable tracing as soon as possible.
Server-side tracing
To define a trace, use the following system stored procedures:
![]() sp_trace_create This procedure creates a new trace and defines a file into which SQL Server stores trace data. It returns a trace ID that you reference in the other procedures to manage the trace.
sp_trace_create This procedure creates a new trace and defines a file into which SQL Server stores trace data. It returns a trace ID that you reference in the other procedures to manage the trace.
![]() sp_trace_setevent This procedure must be called once for each data column of the events to capture in the trace. That means you must call this procedure many times for any single trace. When you call this procedure, you pass in the following arguments, the trace identifier captured as output when you create the trace, the event identifier, the column identifier, and the status of ON (1) or OFF (0).
sp_trace_setevent This procedure must be called once for each data column of the events to capture in the trace. That means you must call this procedure many times for any single trace. When you call this procedure, you pass in the following arguments, the trace identifier captured as output when you create the trace, the event identifier, the column identifier, and the status of ON (1) or OFF (0).
![]() sp_trace_setfilter This procedure must be called once for each filter on an event data column.
sp_trace_setfilter This procedure must be called once for each filter on an event data column.
![]() sp_trace_setstatus This procedure starts, stops, or removes a trace. It must be stopped and removed before you can open the related trace file.
sp_trace_setstatus This procedure starts, stops, or removes a trace. It must be stopped and removed before you can open the related trace file.
Listing 4-16 illustrates how to use these four system stored procedures to create a trace for a query plan. The trace data is stored in the ExamBook762Ch4 folder that must exist prior to executing the sp_trace_create system stored procedure. Next, the sp_trace_setevent system stored procedure is called multiple times to capture the query plan, the login name associated with the query, the start and end time of the query, and the text of the query, respectively.
LISTING 4-16 Create a trace, add events and filter to a trace, and start a trace
USE master;
GO
DECLARE @TraceID int;
EXEC sp_trace_create
@TraceID output,
0,
N'C:ExamBook762Ch4ActualQueryPlanTrc';
EXEC sp_trace_setevent @TraceID,
146, -- Showplan XML Statistics Profile
27, -- BinaryData column
1; -- Column is ON for this event
EXEC sp_trace_setevent @TraceID,
146,
1, -- TextData column
1;
EXEC sp_trace_setevent @TraceID,
146,
14, -- StartTime column
1;
EXEC sp_trace_setevent @TraceID,
146,
15, -- EndTime column
1;
-- Set filter for database
EXEC sp_trace_setfilter @TraceID,
@ColumnID = 35, --Database Name
@LogicalOperator = 0, -- Logical AND
@ComparisonOperator = 6, -- Comparison LIKE
@Value = N'WideWorldImporters' ;
-- Set filter for application name
EXEC sp_trace_setfilter @TraceID,
@ColumnID = 10, --ApplicationName
@LogicalOperator = 0, -- Logical AND
@ComparisonOperator = 6, -- Comparison LIKE
@Value = N'Microsoft SQL Server Management Studio - Query' ;
-- Start Trace (status 1 = start)
EXEC sp_trace_setstatus @TraceID, 1;
GO
Note Resources for sp_trace_setevent and sp_trace_setfilter
Lists of event and column identifiers for defining the event columns are available at “sp_trace_setevent (Transact-SQL)”, https://msdn.microsoft.com/en-us/library/ms186265.aspx. Lists of the logical and comparison operators for the trace filter are available at “sp_trace_setfilter (Transact-SQL)” at https://msdn.microsoft.com/en-us/library/ms174404.aspx.
Now execute a query to generate an event for the trace like this:
USE WideWorldImporters;
GO
SELECT *
FROM Warehouse.StockGroups;
To view the trace information, find the trace identifier by using the sys.fn_trace_getinfo system function and then use sp_trace_setstatus twice, as shown in Listing 4-17, replacing <traceid> with the trace identifier that you find by executing the first statement. The first time you set the status of the trace to 0 to stop it and the second time you set the status to 2 to close and delete the trace information from SQL Server.
LISTING 4-17 Stop and delete a trace
---- Find the trace ID
USE master;
GO
SELECT *
FROM sys.fn_trace_getinfo(0)
WHERE value = 'C:ExamBook762Ch4ActualQueryPlanTrc.trc';
-- Set the trace status to stop
EXEC sp_trace_setstatus
@traceid = <traceid>,
@status= 0;
GO
-- Close and Delete the trace
EXEC sp_trace_setstatus
@traceid = <traceid>,
@status = 2;
GO
The trace file remains on the file system and is available for you to view in SQL Server Profiler. Be sure to open SQL Server Profiler by using the Run As Administrator option and then open the trace file. Click the row containing the query’s Showplan event to view the graphical query plan, as shown in Figure 4-5.

Setting up traces manually by using the system stored procedures can be tedious due to the number of numeric parameters required. Rather than refer to Books Online to find the necessary values, you can take advantage of SQL Server catalog views to find the values you need, as shown in Listing 4-18.
LISTING 4-18 Get event and column identifiers for use in a trace definition
--Get event identifiers
SELECT
e.trace_event_id AS EventID,
e.name AS EventName,
c.name AS CategoryName
FROM sys.trace_events e
JOIN sys.trace_categories c
ON e.category_id = c.category_id
ORDER BY e.trace_event_id;
/* Partial output
EventID EventName CategoryName
------------ ------------------------------- ---------------------
10 RPC:Completed Stored Procedures
11 RPC:Starting Stored Procedures
12 SQL:BatchCompleted TSQL
13 SQL:BatchStarting TSQL
*/
--Get column identifiers for events
SELECT
trace_column_id,
name AS ColumnName
FROM sys.trace_columns
ORDER BY trace_column_id;
/* Partial output
trace_column_id ColumnName
----------------------- -----------------------------
1 TextData
2 BinaryData
3 DatabaseID
4 TransactionID
5 LineNumber
*/
LISTING 4-19 Create an indexed view to improve aggregate query performance
CREATE VIEW Sales.vSalesByYear
WITH SCHEMABINDING
AS
SELECT
YEAR(InvoiceDate) AS InvoiceYear,
COUNT_BIG(*) AS InvoiceCount
FROM Sales.Invoices
GROUP BY YEAR(InvoiceDate);
GO
CREATE UNIQUE CLUSTERED INDEX idx_vSalesByYear
ON Sales.vSalesByYear
(InvoiceYear);
GO
Client-side tracing
You can use SQL Server Profiler instead of manually creating the many stored procedures to define a trace when you need to capture a query plan. On the File menu, click New Trace, and then connect to the server on which you want to run the trace. In the Trace Properties dialog box, click the Events Selection tab and then select the Show All Events checkbox. Expand the Performance node, and select one or more of the following checkboxes:
![]() Showplan XML This event is raised when SQL Server selects an estimated query plan.
Showplan XML This event is raised when SQL Server selects an estimated query plan.
![]() Showplan XML For Query Compile This event is raised when SQL Server compiles a query and produces an estimated query plan which it adds to the query plan cache. Generally, this event is raised only once for a query unless the query requires recompilation.
Showplan XML For Query Compile This event is raised when SQL Server compiles a query and produces an estimated query plan which it adds to the query plan cache. Generally, this event is raised only once for a query unless the query requires recompilation.
![]() Showplan XML Statistics Profile This event is raised after SQL Server executes a query and has generated an actual query plan.
Showplan XML Statistics Profile This event is raised after SQL Server executes a query and has generated an actual query plan.
To minimize the performance impact of running SQL Server Profiler, you should apply as many filters as possible to capture only the query plans of interest. As an example, you might want to focus on queries in a specific database. To do this, select the Show All Columns checkbox, and then click Column Filters. In the Edit Filter dialog box, click DatabaseName, expand Like, type WideWorldImporters as shown in Figure 4-6, and then click OK. Next, click Run to start the trace.

After enabling a trace, you can run a query against the WideWorldImporters database, such as the one shown in Listing 4-15. After executing the query, click the Stop Selected Trace in the SQL Server Profiler toolbar. You can click on any of the events that begin with Showplan to view the graphical estimated or actual query plan, depending on the specific event you select. To save the query plan to a separate file for later review, right click the event, and then select Extract Event Data to save the file with a SQLPlan file extension. You can then open this file in SQL Server Management Studio.
Identify poorly performing query plan operators
Not only can a query plan tell you the specific steps performed by SQL Server during query execution, it can also help you discover which step in the sequence is performing poorly. Each step in the query plan is a separate operation performed by the database engine and is represented as an icon known as an operator. As you analyze a graphical query plan, you should check for the following conditions that can affect query performance:
![]() Query plan optimization You can find this property by right clicking the first operator in the plan (for example, SELECT) and selecting Properties. In the Properties window, look for the Reason For Early Termination Of Statement Optimization property. If it is Good Enough Plan Found, then proceed with further analysis of the query plan. If the value is Timeout, you should spend time tuning your query because the property indicates that the current query plan is not optimal.
Query plan optimization You can find this property by right clicking the first operator in the plan (for example, SELECT) and selecting Properties. In the Properties window, look for the Reason For Early Termination Of Statement Optimization property. If it is Good Enough Plan Found, then proceed with further analysis of the query plan. If the value is Timeout, you should spend time tuning your query because the property indicates that the current query plan is not optimal.
![]() Operators In particular, operators requiring a lot of memory (such as a Sort) or blocking operators can contribute to performance problems in a query. We describe potential issues with query plan operators in more detail later in this section.
Operators In particular, operators requiring a lot of memory (such as a Sort) or blocking operators can contribute to performance problems in a query. We describe potential issues with query plan operators in more detail later in this section.
![]() Arrow width The width of arrows between operators is an indicator relative to the number of rows affected by the operation. If you see one operation outputs a wide arrow, while the arrow preceding a SELECT operator is narrow, the query must process many rows before returning a small number of rows in the result set. In this case, you might investigate whether you can add a filter to the query to reduce the number of rows for the earlier operation and thereby improve overall query performance.
Arrow width The width of arrows between operators is an indicator relative to the number of rows affected by the operation. If you see one operation outputs a wide arrow, while the arrow preceding a SELECT operator is narrow, the query must process many rows before returning a small number of rows in the result set. In this case, you might investigate whether you can add a filter to the query to reduce the number of rows for the earlier operation and thereby improve overall query performance.
![]() Operator cost Each operator’s contribution to the overall cost of the query is represented as a percentage value. As you analyze the query plan, look for the operators with the highest costs.
Operator cost Each operator’s contribution to the overall cost of the query is represented as a percentage value. As you analyze the query plan, look for the operators with the highest costs.
![]() Warnings When the optimizer detects a problem, it includes a warning in an operator’s properties and displays a warning icon on the operator in the graphical query plan. This is a significant clue that the query performance is likely to suffer. If you see a warning, you should take steps to tune your query or optimize your environment to eliminate the warning.
Warnings When the optimizer detects a problem, it includes a warning in an operator’s properties and displays a warning icon on the operator in the graphical query plan. This is a significant clue that the query performance is likely to suffer. If you see a warning, you should take steps to tune your query or optimize your environment to eliminate the warning.
Let’s consider some examples of query plan operators that can adversely affect performance. Before executing the ad hoc queries in this section, click the Include Actual Execution Plan button once to enable the graphical query plan for each query.
Note Understanding query plans for queries using the WideWorldImporters database
The size of the WideWorldImporters database is too small to illustrate performance problems with the use of certain operators. Nonetheless, we use queries against this database to familiarize you with the appearance of specific poorly performing operators in a query plan, explain the conditions in which SQL Server might use them, and suggest steps you can take to improve query performance.
![]() Exam Tip
Exam Tip
Understanding query plan operators is important both in the real world and on the exam. Be prepared for questions that present two possible query plans and ask you to choose the more optimal of the two query plans.
Table Scan operator
As we explained in Chapter 1, SQL Server must read a heap row by row to find the rows for a query. This operation can perform slowly when run against a large table. Try this query:
SELECT *
FROM Warehouse.VehicleTemperatures;
In the Execution Plan window, as shown in Figure 4-7, you can see that SQL Server used a Table Scan operator that represents 100% of the query cost. Note also the size of the arrow between the SELECT and Table Scan operators to indicate a relatively large result set. In this case, the table is memory-optimized, so the performance cost of reading 659,998 rows for this query is minimal. On the other hand, if this table were not memory-optimized and you were investigating poor query performance, the presence of the Table Scan operator should lead you to consider adding a clustered index to the table or look for ways to filter the query to return fewer rows.

Clustered Index Scan operator
Another potential problem for query performance is the use of the Clustered Index Scan operator. It is similar in concept to the Table Scan operator in that SQL Server must scan all the data. This might occur when the query must return so many rows that using the index to find specific rows is no longer advantageous, index selectivity is too low, or statistics are obsolete. To see this operator in action, execute the following query:
SELECT *
FROM Warehouse.StockGroups;
As you can see in Figure 4-8, SQL Server uses the Clustered Index Scan operator to process the query. You can also see which index is used, PK_Warehouse_StockGroups. This clustered index is relatively small (as you can see by the size of the arrows between operators), so performance is not an issue here. However, the presence of a Clustered Index Scan operator can indicate the source of poor query performance and merits further investigation to determine whether you can modify the query by adding a WHERE clause to return only the needed rows, as long as a proper index exists for the column used in the filter. Importantly, the WHERE clause must have a predicate that includes a column on one side of the operator and an expression on the other side with both the column and expression having the same data type. If you use the LIKE operator in the WHERE clause, you cannot use a wildcard as the first character in the search string.

That said, an index scan is not necessarily a bad operation. It is more efficient than a table scan by comparison. Nonetheless, if you need to find a way to improve query performance, your next step is to add a filter. To see what happens when you do this, execute the following query:
SELECT *
FROM Warehouse.StockGroups
WHERE StockGroupID = 1;
Now SQL Server uses a Clustered Index Seek operator, as shown in Figure 4-9. This change to the query plan is good because a seek operator can be one of the faster data retrieval methods used by SQL Server. In particular, a Clustered Index Seek is a preferred operator because all data in the table is also included in the index and SQL Server can return results directly from the index without performing additional steps.
![A screen shot shows a query plan containing a SELECT operator with Cost 0% and a Clustered Index Seek operator with Cost 100% applied to the PK_Warehouse_StockGroups clustered index. The following query text displays above the operators: SELECT * FROM [Warehouse].[StockGroups] WHERE [StockGroupID]=@1.](http://images-20200215.ebookreading.net/19/2/2/9781509304929/9781509304929__exam-ref-70-762__9781509304929__graphics__04xx09_cropped.jpg)
Notice also that SQL Server converted the predicate to @1 instead of using the actual value of 1 that was requested in the query. That way, SQL Server can reuse the query plan when the same query executes with a different value in the WHERE clause. This reuse is known as simple parameterization.
Index Seek (NonClustered) and Key Lookup (Clustered) operators
Like the Clustered Index Seek operator, the Index Seek (NonClustered) operator is a much better operator to see in a query plan than a Table Scan or a Clustered Index Scan operator because it can selectively find rows in the index rather than read all the rows, although this behavior is dependent on the query. On the other hand, if the non-clustered index is not a covering index, the query plan also includes a Key Lookup (Clustered) operator, which adds a slight overhead to query performance. To see a query plan with these characteristics, as shown in Figure 4-10, execute this query:
SELECT
StockGroupID,
StockGroupName,
ValidFrom,
ValidTo
FROM Warehouse.StockGroups
WHERE StockGroupName = 'Novelty Items';

In this case, the index used by the Index Seek (NonClustered) operator contains only the StockGroupName column, but the query references other columns in the SELECT clause, so it must use the Key Lookup (Clustered) operator to get the additional columns for each row. Incidentally, if the query references columns in JOIN conditions or the WHERE clause, SQL Server includes the Key Lookup (Clustered) operator in the query plan even if those columns are not also in the SELECT clause. Therefore, whenever you see the Key Lookup (Clustered) operator in combination with an Index Seek (NonClustered) operator, consider creating a covering index by adding the necessary columns to the index key or as included columns.
Note RID Lookup operator versus Key Lookup (Clustered) operator
When a query accesses a table without a clustered index, SQL Server uses the RID Lookup operator instead of the Key Lookup (Clustered) operator. The net effect of each operator type has a similar effect on query performance which can be mitigated by the addition of a covering index or a clustered index.
Sort operator
The Sort operator can also increase the cost of a query. Consider the query plan shown in Figure 4-11 that results from executing the following query which includes an ORDER BY clause containing a column that is not used in an index:
SELECT *
FROM Warehouse.StockItems
ORDER BY StockItemName;

Contrast the query plan in Figure 4-11 with the one in Figure 4-12 that is created by executing this query:
SELECT *
FROM Warehouse.StockItems
ORDER BY StockItemID;

Because a clustered index is already sorted, SQL Server no longer requires a Sort operator when the ORDER BY clause includes a key column from the clustered index. With this in mind, look for Sort operators with a significant query cost and consider adding the sort columns to a clustered index on the table. Another potential solution is to reduce the number of rows to sort by adding a WHERE clause to the query.
Another consideration when working with a Sort operator is the volume of data that SQL Server must sort. The query optimizer uses the estimated number of rows and the average row size to calculate the minimum amount of memory required to perform the operation and the amount of memory needed to perform the operation entirely in memory. If the actual number of rows to be sorted is larger than the estimate due to obsolete statistics, the operation spills to tempdb. You can identify this type of memory problem in the actual query plan when you see a warning symbol on the Sort, as shown in Figure 4-13, or Hash Match operators.

When you hover the cursor over the Sort operator, the tooltip includes a warning that the operator used tempdb to spill data, as shown in Figure 4-14.

The query performance will suffer when the sort must use tempdb instead of memory. Use the tooltip for the SELECT operator to check the Memory Grant property which shows how much memory that SQL Server is allocating to the query. In SQL Server 2016, you can now add a query hint to request a minimum memory grant size as a percentage of the default limit to override the minimum memory per query property that is set on the server like this:
OPTION(min_grant_percent = 100)
Hash Match (Aggregate) operator
Aggregations in a query can have a negative effect on performance and should be reviewed carefully. Figure 4-15 shows the query plan created for the following aggregate query:
SELECT
YEAR(InvoiceDate) AS InvoiceYear,
COUNT(InvoiceID) AS InvoiceCount
FROM Sales.Invoices
GROUP BY YEAR(InvoiceDate);

In this case, the Hash Match (Aggregate) operator to group the rows from the Index Scan (NonClustered) operator contributes a significant percentage to the query cost. To perform this aggregation, SQL Server creates a temporary hash table in memory to count the rows by invoice year. Notice the larger width of the arrow sending data into the Hash Match (Aggregate) operator as compared to the width of the arrow sending the results to the next operator as an indicator that a larger row set has been reduced to a smaller row set by the operation.
Options to consider for minimizing the impact on performance when performing aggregations is to minimize the number of rows to aggregate where possible or to use an indexed view to pre-aggregate rows. Execute the statements in Listing 4-19 to set up an indexed view to improve the previous query’s performance.
DCREATE VIEW Sales.vSalesByYear
WITH SCHEMABINDING
AS
SELECT
YEAR(InvoiceDate) AS InvoiceYear,
COUNT_BIG(*) AS InvoiceCount
FROM Sales.Invoices
GROUP BY YEAR(InvoiceDate);
GO
CREATE UNIQUE CLUSTERED INDEX idx_vSalesByYear
ON Sales.vSalesByYear
(InvoiceYear);
GO
Now you can execute the earlier query again, even though it does not reference the indexed view directly, to see how the query optimizer takes advantage of the indexed view in the query plan shown in Figure 4-16.
SELECT
YEAR(InvoiceDate) AS InvoiceYear,
COUNT(InvoiceID) AS InvoiceCount
FROM Sales.Invoices
GROUP BY YEAR(InvoiceDate);

As a result of the addition of the indexed view, SQL Server no longer requires the Hash Match (Aggregator) operator and instead uses a Clustered Index Scan (ViewClustered) operator to retrieve data. Because the data is pre-aggregated, the index scan is much faster in this case than it would be against an index containing all rows in the table.
Hash Match (Inner Join) operator
Thus far, the queries we have examined have been relatively simple and read data from only one table. Now let’s consider a query that combines data from multiple tables to produce the query plan shown in Figure 4-17:
SELECT
si.StockItemName,
c.ColorName,
s.SupplierName
FROM Warehouse.StockItems si
INNER JOIN Warehouse.Colors c ON
c.ColorID = si.ColoriD
INNER JOIN Purchasing.Suppliers s ON
s.SupplierID = si.SupplierID;
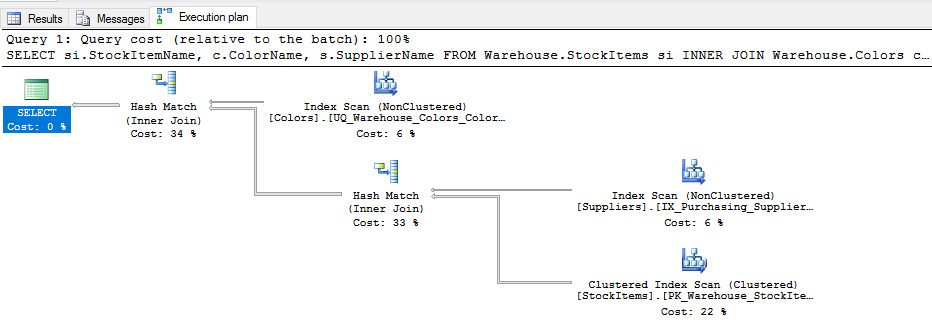
In this example, we see the addition of the Hash Match (Inner Join) operator in two places in the query plan. We also see that these two operations have the two highest costs in the plan and therefore should be the first operations we assess for possible optimization. SQL Server uses this operator when it puts data into temporary hash tables so that it can match rows in two different data sets and produce a single result set. Specifically, SQL Server converts, or hashes, rows from the smaller data set into a value that is more efficient for comparisons and then stores these values in a hash table in tempdb. Then it compares each row in the larger data set with the hash table to find matching rows to join. As long as the smaller data set is in fact small, this comparison operation is fast, but performance can suffer when both data sets are large. Furthermore, if a query requires many of these operations, tempdb might experience memory pressure. Last, it’s important to note that the Hash Match (Inner Join) operator is a blocking operator as it requires SQL Server to gather data from each data set before it can perform the join.
In Figure 4-17, the Hash Match (Inner Join) operator combines the results of the Index Scan (NonClustered) and the Clustered Index Scan operators that gets SupplierID and SupplierName by scanning a non-clustered index on the Suppliers table and StockItemName, SupplierID, and ColorID by scanning the clustered index on the StockItems table. This result set becomes input for the second usage of the operation and is combined with ColorName set from an index scan on the Colors table.
Your options for improving the query performance based on this query plan include adding or revising indexes, filtering the data by using a WHERE clause, or fixing a WHERE clause that prevents the query optimizer from using an existing index. Let’s try adding indexes to the Suppliers and StockItems tables, as shown in Listing 4-20. The index on the Suppliers table includes the SupplierID column used for the JOIN operation and the SupplierName column to return in the final query results. Similarly, the index on the StockItems table includes the ColorID and SupplierID columns used for JOIN operations and the StockItemName column to return in the final query results.
LISTING 4-20 Add indexes to eliminate Hash Match (Inner Join) operators
CREATE NONCLUSTERED INDEX IX_Purchasing_Suppliers_ExamBook762Ch4_SupplierID
ON Purchasing.Suppliers
(
SupplierID ASC,
SupplierName
);
GO
CREATE NONCLUSTERED INDEX IX_Warehouse_StockItems_ExamBook762Ch4_ColorID
ON Warehouse.StockItems
(
ColorID ASC,
SupplierID ASC,
StockItemName ASC
);
After adding the indexes, execute the following query to see the new query plan, as shown in Figure 4-18:
SELECT
si.StockItemName,
c.ColorName,
s.SupplierName
FROM Warehouse.StockItems si
INNER JOIN Warehouse.Colors c ON
c.ColorID = si.ColoriD
INNER JOIN Purchasing.Suppliers s ON
s.SupplierID = si.SupplierID;

In the new query plan, SQL Server replaces the Hash Match (Inner Join) operators with Nested Loops operators and replaces two of the index scan operations with Index Seek (NonClustered) operators which should significantly improve performance even when large tables are queried. The Nested Loops operator is an efficient operation that compares two data sets row by row. For each row output by the top operator in the query plan (known as the inner data set), which is the index scan on the small Colors table, SQL Server scans the rows output by the bottom operator (known as the outer data set), which is the index seek on the StockItems table. Then the output of this operation becomes the inner data set for the second Nested Loops operator in the query plan. For each row in this new inner data set, SQL Server scans the output from the index seek on the Suppliers table. Notice that the cost of the Nested Loops operators in the new query plan is significantly lower than the cost of the Hash Match (Inner Join) operators shown in Figure 4-17. Create efficient query plans using Query Store
The query plan selected by the query optimizer is not guaranteed to be the most efficient plan. When working with a version earlier than SQL Server 2016, you can capture query plans from the procedure cache periodically, but run the risk of losing access to query plans when the server comes under memory pressure and begins evicting older query plans from the cache. With Query Store in SQL Server 2016 and Azure SQL Database, you can capture and analyze information about all query plans generated over time for a query. You can then force SQL Server to use the query plan that you determine to be most efficient based on the criteria that best meets your business requirements.
Query Store properties
By default, Query Store is not enabled. You can enable it at the database level in SQL Server Management Studio by using Object Explorer to navigate to the database for which you want to enable Query Store. Right-click the database name to open the Database Properties dialog box and click the Query Store tab. In the Operation Mode (Requested) drop-down list, select Read Write.
Note Changing the Query Store behavior
You can later change the Operation Mode (Requested) property to Read Only when you want to retain existing query plans and execution statistics information available in the query store, but no longer want to add new information. SQL Server automatically switches to this mode when the query store reaches its maximum allocated space. To disable Query Store, change this property to Off.
As shown in Figure 4-19, there are several other properties that you can configure to manage the query store:
![]() Data Flush Interval (Minutes) The frequency in minutes at which SQL Server writes data collected by the query store to disk.
Data Flush Interval (Minutes) The frequency in minutes at which SQL Server writes data collected by the query store to disk.
![]() Statistics Collection Interval The granularity of time for which SQL Server aggregates runtime execution statistics for the query store. You can choose one of the following intervals: 1 minute, 5 minutes, 10 minutes, 15 minutes, 30 minutes, 1 hour, or 1 day. If you capture data at a high frequency, bear in mind that the query store requires more space to store more finely grained data.
Statistics Collection Interval The granularity of time for which SQL Server aggregates runtime execution statistics for the query store. You can choose one of the following intervals: 1 minute, 5 minutes, 10 minutes, 15 minutes, 30 minutes, 1 hour, or 1 day. If you capture data at a high frequency, bear in mind that the query store requires more space to store more finely grained data.
![]() Max Size (MB) The maximum amount of space allocated to the query store. The default value is 100 MB per database. If your database is active, this value might not be large enough to store query plans and related information.
Max Size (MB) The maximum amount of space allocated to the query store. The default value is 100 MB per database. If your database is active, this value might not be large enough to store query plans and related information.
![]() Query Store Capture Mode The specification of the types of queries for which SQL Server captures data for the query store. You can choose one of the following options:
Query Store Capture Mode The specification of the types of queries for which SQL Server captures data for the query store. You can choose one of the following options:
![]() None The query store stops collecting data for new queries, but continues capturing data for existing queries.
None The query store stops collecting data for new queries, but continues capturing data for existing queries.
![]() All The query store captures data for all queries.
All The query store captures data for all queries.
![]() Auto The query store captures data for relevant queries. It ignores infrequent queries and queries with insignificant compile and execution duration.
Auto The query store captures data for relevant queries. It ignores infrequent queries and queries with insignificant compile and execution duration.
![]() Size Based Cleanup Mode The specification of whether the cleanup process activates when the query store data approaches its maximum size (Auto) or never runs (OFF).
Size Based Cleanup Mode The specification of whether the cleanup process activates when the query store data approaches its maximum size (Auto) or never runs (OFF).
![]() Stale Query Threshold (Days) The number of days that SQL Server keeps data in the query store.
Stale Query Threshold (Days) The number of days that SQL Server keeps data in the query store.

Note Query store enabled by default for WideWorldImporters database
The query store for WideWorldImporters database is already enabled when you restore it. The current disk usage that displays for you will differ from that shown in Figure 4-19 as these metrics depend on the volume of query activity that has occurred on your computer to date.
You can also use the statement shown in Listing 4-21 to enable the query store, replacing <databasename> with the name of the database that you want to configure.
LISTING 4-21 Enable the query store for a database and set its properties
ALTER DATABASE <databasename>
SET QUERY_STORE = ON
(
OPERATION_MODE = READ_WRITE ,
CLEANUP_POLICY = ( STALE_QUERY_THRESHOLD_DAYS = 30 ),
DATA_FLUSH_INTERVAL_SECONDS = 3000,
MAX_STORAGE_SIZE_MB = 500,
INTERVAL_LENGTH_MINUTES = 50
);
You can clear the data from the query store by clicking Purge Query Data on the Query Store tab of the Database Properties dialog box or by executing either of the statements shown in Listing 4-22.
LISTING 4-22 Purge data from the query store
--Option 1: Use the ALTER DATABASE statement
ALTER DATABASE <databasename>
SET QUERY_STORE CLEAR ALL;
GO
--Option 2: Use a system stored procedure
EXEC sys.sp_query_store_flush_db;
GO
Query Store components
The query store captures information about query plans and runtime execution statistics until the maximum space allocation is reached. You can review this data in the following DMVs:
![]() sys.query_store_plan Query plan information, such as Showplan XML, the number of compilations, the date and time of the initial and last compilations, the last execution date and time, and the average and most recent duration of compilation, among other details. The query plan available in this DMV is the estimated plan only.
sys.query_store_plan Query plan information, such as Showplan XML, the number of compilations, the date and time of the initial and last compilations, the last execution date and time, and the average and most recent duration of compilation, among other details. The query plan available in this DMV is the estimated plan only.
![]() sys.query_store_query Aggregated runtime execution statistics for a query, including CPU binding, memory, optimization, and compilation statistics. This information is stored at the statement level and not at the batch level which is different from the behavior of sys.dm_exec_query_stats.
sys.query_store_query Aggregated runtime execution statistics for a query, including CPU binding, memory, optimization, and compilation statistics. This information is stored at the statement level and not at the batch level which is different from the behavior of sys.dm_exec_query_stats.
![]() sys.query_store_query_text The text of the executed query.
sys.query_store_query_text The text of the executed query.
![]() sys.query_store_runtime_stats Runtime execution statistics for a query, such as first and last execution date and time, the number of executions, statistics (average, last, minimum, maximum, and standard deviation) for query duration, CPU time, logical IO reads and writes, physical IO reads and writes, CLR time, DOP, maximum used memory, and row counts.
sys.query_store_runtime_stats Runtime execution statistics for a query, such as first and last execution date and time, the number of executions, statistics (average, last, minimum, maximum, and standard deviation) for query duration, CPU time, logical IO reads and writes, physical IO reads and writes, CLR time, DOP, maximum used memory, and row counts.
![]() sys.query_store_runtime_stats_interval The start and end times defining the intervals during which SQL Server collects runtime execution statistics for the query store.
sys.query_store_runtime_stats_interval The start and end times defining the intervals during which SQL Server collects runtime execution statistics for the query store.
As an example, you can query the DMVs to find the top query with the highest average logical reads and its corresponding query plan, as shown in Listing 4-23.
LISTING 4-23 Top 5 queries with highest average logical reads
USE WideWorldImporters;
GO
SELECT TOP 1
qt.query_sql_text,
CAST(query_plan AS XML) AS QueryPlan,
rs.avg_logical_io_reads
FROM sys.query_store_plan qp
INNER JOIN sys.query_store_query q
ON qp.query_id = q.query_id
INNER JOIN sys.query_store_query_text qt
ON q.query_text_id = qt.query_text_id
INNER JOIN sys.query_store_runtime_stats rs
ON qp.plan_id = rs.plan_id
ORDER BY rs.avg_logical_io_reads DESC;
You can use the following system stored procedures to manage the query store:
![]() sp_query_store_flush_db Flush the portion of the query store currently in memory to disk. This stored procedure takes no arguments.
sp_query_store_flush_db Flush the portion of the query store currently in memory to disk. This stored procedure takes no arguments.
![]() sp_query_store_force_plan Force SQL Server to use a specified query plan for a specified query. You provide identifiers for the query and plan as arguments for this stored procedure.
sp_query_store_force_plan Force SQL Server to use a specified query plan for a specified query. You provide identifiers for the query and plan as arguments for this stored procedure.
![]() sp_query_store_remove_plan Remove a specified query plan from the query store.
sp_query_store_remove_plan Remove a specified query plan from the query store.
![]() sp_query_store_remove_query Remove a specified query from the query store, in addition to the query plans and runtime execution statistics related to it.
sp_query_store_remove_query Remove a specified query from the query store, in addition to the query plans and runtime execution statistics related to it.
![]() sp_query_store_reset_exec_stats Reset the runtime execution statistics for a specified plan.
sp_query_store_reset_exec_stats Reset the runtime execution statistics for a specified plan.
![]() sp_query_store_unforce_plan Keep a specified query plan in the query store, but no longer force SQL Server to use it for a specified query.
sp_query_store_unforce_plan Keep a specified query plan in the query store, but no longer force SQL Server to use it for a specified query.
Need More Review? More query store monitoring examples available online
See the “Key Usage Scenarios” section of the “Monitoring Performance By Using the Query Store” article at https://msdn.microsoft.com/en-US/library/dn817826.aspx. Here you will find several examples of using these DMVs and system stored procedures, such as showing the last n queries executed on a database, the number of executions per query, queries having the longest average execution time in the last hour, among others.
Query Store views
An easy way to review the information available in the query store is to use Query Store views in SQL Server Management Studio. After enabling query store for a database, a Query Store node appears below the database node and contains four views, as shown in Figure 4-20.

Before we the review contents of these views, let’s execute the statements in Listing 4-24 to create a test environment in which a new database and table is added. The table is populated with a random 9,999 rows of random values with an ID of 1 and one row with an ID of 2 to create a skewed distribution. A primary key clustered index and a non-clustered index on the ID column are added. Next, a parameterized stored procedure to select rows from the table is added to the database. Query Store Is enabled on the database to capture query plan changes over time using an interval length of 1 minute to capture statistics at the most granular level available for better visibility of the query examples in this section. Last, the stored procedure is called with the ID associated with a large number of rows in the table. This stored procedure is called multiple times to accumulate more statistics than other background queries in the database so that you can see it more easily in the view later.
LISTING 4-24 Create test environment for Query Store
CREATE DATABASE ExamBook762Ch4_QueryStore;
GO
USE ExamBook762Ch4_QueryStore;
GO
CREATE SCHEMA Examples;
GO
CREATE TABLE Examples.SimpleTable(
Ident INT IDENTITY,
ID INT,
Value INT);
WITH IDs
AS (SELECT
TOP (9999)
ROW_NUMBER() OVER (ORDER BY (SELECT 1)) AS n
FROM master.sys.All_Columns ac1
CROSS JOIN master.sys.All_Columns ac2
)
INSERT INTO Examples.SimpleTable(ID, Value)
SELECT
1,
n
FROM IDs;
GO
INSERT Examples.SimpleTable (ID, Value)
VALUES (2, 100);
ALTER TABLE Examples.SimpleTable
ADD CONSTRAINT [PK_SimpleTable_Ident]
PRIMARY KEY CLUSTERED (Ident);
CREATE NONCLUSTERED INDEX ix_SimpleTable_ID
ON Examples.SimpleTable(ID);
GO
CREATE PROCEDURE Examples.GetValues
@PARAMETER1 INT
AS
SELECT
ID,
Value
FROM Examples.SimpleTable
WHERE
ID = @PARAMETER1;
GO
ALTER DATABASE ExamBook762Ch4_QueryStore
SET QUERY_STORE = ON (
INTERVAL_LENGTH_MINUTES = 1
);
EXEC Examples.GetValues 1;
GO 20
At this point, the Top Resource Consuming Queries view, shown in Figure 4-21, is the only one that contains information. The default configuration includes a column chart in the top left that displays total duration by query id, a point chart in the top right that displays duration for query plans associated with the selected query (known as a plan summary), and a query plan for the plan identifier currently selected in the point chart.

Note Working with multiple queries in the Top Resource Consuming Queries view
Depending on the activity occurring in the database, the query that you want to analyze might not be the first column in the chart as it is in Figure 4-21. You can click on each column to view the query plan associated with a query and its query text, or click the View Top Resource Consuming Queries In A Grid Format With Additional Details button in the chart’s toolbar to locate your query by its query text. If you select a query in this grid and toggle back to the chart, the view retains your selection and shows the plan summary and a query plan.
Taking a closer look at the column chart, notice that each column represents a query. When multiple queries exist in the query store, the columns are sorted in descending order by the selected metric, which is currently Duration. When you hover the cursor over a column in the chart, a tooltip displays the query id, the metric and its selected statistic, and the query text. If the query includes a WHERE clause, the query text is parameterized. You can find similar information by using the sys.query_store_query, sys.query_store_query_text, and sys.query_store_runtime_stats DMVs. By using the Query Store view in SQL Server Management Studio, you can quickly visualize and access key metrics about your queries without writing any code.
The plan summary chart displays one point per query plan for the query selected in the column chart. When you hover the cursor over a point on this chart, as shown in Figure 4-22, a tooltip displays some of the information related to the selected metric that is available in the sys.query_store_runtime_stats DMV. Last, notice the graphical query plan shows that SQL Server used a Clustered Index Scan operator to retrieve rows for the SELECT statement in the stored procedure. An index scan is used instead of a seek because the number of rows for the parameter value of 1 is high relative to the size of the table.

You can change the configuration of the charts by changing the y-axis of the column chart and by selecting new metric and statistic values in the respective drop-down lists above the column chart. For example, select Logical Reads in the Metric drop-down list, and Avg in the Statistic drop down list, and point to your query’s column in the chart to view the corresponding metric value, execution count, and number of query plans for the selected query.
Now let’s modify the query slightly by changing the parameter to the other possible ID value in the table, and execute it by using the code shown in Listing 4-25.
LISTING 4-25 Execute stored procedure with new parameter value
EXEC Examples.GetValues 2;
GO
Return to the Top Resource Consuming Queries dashboard and click the Refresh button above the column chart to update it. When you click the query’s column in the column chart, the plan summary chart now has two points that are associated with the same query plan, as shown in Figure 4-23. That means the index scan for the query executed to get rows with ID 1 was also used to get the one row with ID 2. This is condition is a result of parameter sniffing in which the query optimizer uses the estimated rows from the first execution of the stored procedure to select a query plan and then uses it for all subsequent executions without considering the estimated rows for the new parameter values. In the current example, an index seek is a more efficient operator for retrieving the one row for ID 2, but it is not considered due to the parameter sniffing behavior.

Let’s clear the procedure cache and see what happens when SQL Server must generate a new query plan rather than use the one created previously. To do this, execute the statements shown in Listing 4-26. Click the Refresh button in the Query Store view to see the effect of the last query execution. When you click the Plan ID with the higher identifier in the legend, you can see its new query plan, as shown in Figure 4-24. Notice the disparity between the points in the point chart which indicates the new query plan has a lower average logical read value than the first query plan and is therefore more efficient. As you can see in the graphical query plan at the bottom of the view, SQL Server used an index seek operation to retrieve a single row from the table.
LISTING 4-26 Execute stored procedure after clearing procedure cache
DBCC FREEPROCCACHE();
GO
EXEC Examples.GetValues 2;
GO
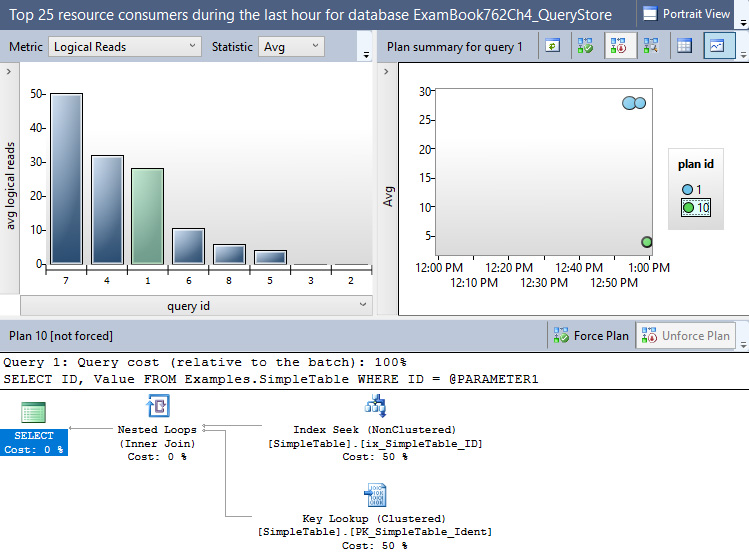
Another way to compare the differences between the query plans is to view their respective metrics. To do this, click the View Plan Summary In A Grid Format button in the toolbar to switch the plan summary from a chart to a grid, as shown in Figure 4-25.

When you click a row in the grid, you can see the associated graphical query plan, but you can only view one graphical query plan at a time this way. If you want to compare query plans, click the View Plan Summary In A Chart Format button in the toolbar to switch back to the point chart, click one plan identifier in the legend and then, while holding the Shift key, click the other plan identifier. Next, click the Compare The Plans For The Selected Query In A Separate Window button in the toolbar. In the Showplan Comparison window that opens, shown in Figure 4-26, you can more easily compare the differences between the two plans. The top query plan (which was the last to execute) uses an index seek to retrieve one row, whereas the bottom query plan uses an index scan to retrieve many rows and performs less efficiently for small rowsets.

Let’s say that the normal query pattern for this particular stored procedure is to retrieve a limited number of rows. In that case, the use of the query plan that uses the index seek is preferable. An advantage of using Query Store is the ability to force this plan to be used for all executions of the same query. Returning to the Top Resource Consuming Queries view, click the plan identifier for the last query plan (with the lower average logical reads) and then click the Force Plan button to require SQL Server to use this query plan for all future queries. You must confirm that you want to force the selected plan before SQL Server accepts the change.
Run the query shown in Listing 4-27 to retrieve most of the rows from the table, and then refresh the Top Resource Consuming Queries view to check the results, as shown in Figure 4-27. Although there is a forced plan for the query that should be reused, the Plan Summary chart now shows a third plan identifier, Plan ID 15, for which the average logical reads is significantly higher than it was for Plan ID 10, the forced plan. (You can identify the forced plan id by the check mark on the point in the chart.)
LISTING 4-27 Execute stored procedure with new parameter value and forced query plan
EXEC Examples.GetValues 1;
GO

If you check the graphical query plan for Plan ID 10 and Plan ID 15, you find that both query plans use an index seek operation to retrieve rows. SQL Server generated a new query plan for the stored procedure due to the difference in estimated rows, but the same operations are used. Although this is not the most efficient operation when retrieving a relatively high number of rows, as we discussed previously, it might be a reasonable trade-off when the majority of executions retrieves a small number of rows. If you execute the stored procedure again using a parameter value of 2 and refresh the view, another point associated with Plan ID 10 appears on the Plan Summary chart with a lower value for average logical reads.
Of course, this approach is not a suitable solution for all performance problems. Furthermore, forcing a query plan does not guarantee that SQL Server always uses that query plan. As an example, if a forced query plan is dependent on an index that is subsequently dropped, the plan forcing will fail. For this reason, you should periodically review the status of forced plans and reasons for failure by running the query shown in Listing 4-28. You can also use the query_store_plan_forcing_failed Extended Event to monitor failed plan forcing.
LISTING 4-28 Check status of forced plans
SELECT
p.plan_id,
p.query_id,
q.object_id,
force_failure_count,
last_force_failure_reason_desc
FROM sys.query_store_plan AS p
INNER JOIN sys.query_store_query AS q
ON p.query_id = q.query_id
WHERE is_forced_plan = 1;
The following three Query Store views behave much like the view we explored in detail in this section, but focus on different types of queries:
![]() Regressed Queries Displays a column chart of metrics by query, a plan summary, and query plan for regressed queries executed in the previous hour. A regressed query is one for which a new query plan generated for a particular query is less optimal than a query plan that was previously used for the same query. Regression can happen due to changes in statistics, structural changes to the data, addition or removal or indexes, and so on. Use this view to find regressed queries and determine whether to force an earlier query plan.
Regressed Queries Displays a column chart of metrics by query, a plan summary, and query plan for regressed queries executed in the previous hour. A regressed query is one for which a new query plan generated for a particular query is less optimal than a query plan that was previously used for the same query. Regression can happen due to changes in statistics, structural changes to the data, addition or removal or indexes, and so on. Use this view to find regressed queries and determine whether to force an earlier query plan.
![]() Overall Resource Consumption Displays overall resource consumption during the last month in separate charts: duration, execution count, CPU time, and logical reads. You can toggle between the chart view and grid view. This view does not provide access to the query plan details.
Overall Resource Consumption Displays overall resource consumption during the last month in separate charts: duration, execution count, CPU time, and logical reads. You can toggle between the chart view and grid view. This view does not provide access to the query plan details.
![]() Tracked Queries Displays tracked queries. You add a query to this dashboard view by selecting it in the metric chart and then clicking the Track The Selected Query In A New Tracked Queries Window. That way, you can focus on the metrics for a single query rather than try to find it among the changing set of Query IDs on the Top Resource Consuming Queries view.
Tracked Queries Displays tracked queries. You add a query to this dashboard view by selecting it in the metric chart and then clicking the Track The Selected Query In A New Tracked Queries Window. That way, you can focus on the metrics for a single query rather than try to find it among the changing set of Query IDs on the Top Resource Consuming Queries view.
Compare estimated and actual query plans and related metadata
After the query optimizer generates a query plan or uses a query plan existing in the plan cache, the storage engine is responsible for executing the query according to that plan. However, the plan that it starts with is an estimated query plan. That is, it is the plan determined by the query optimizer to be the most efficient query plan based on the calculations performed by the query optimizer. At runtime, SQL Server reports an actual query plan to add runtime information to the estimated query plan. When you compare an estimated and actual query plan for the same query, you can see differences when either of the following situations occur:
![]() Inaccurate statistics As data is inserted into or deleted from a table, both the indexes and the distribution of data in each column change. The automatic statistics update uses a data sample rather than the entire table to reduce the overhead of the process, Therefore, statistics can become less accurate over time.
Inaccurate statistics As data is inserted into or deleted from a table, both the indexes and the distribution of data in each column change. The automatic statistics update uses a data sample rather than the entire table to reduce the overhead of the process, Therefore, statistics can become less accurate over time.
![]() Structural changes Changing the schema of a table or changing its structure also affects indexes and data distribution and causes a recompilation as does changing or dropping an index used by the query or updating statistics.
Structural changes Changing the schema of a table or changing its structure also affects indexes and data distribution and causes a recompilation as does changing or dropping an index used by the query or updating statistics.
A common reason to work with estimated query plans is to evaluate performance of a query in development, particularly when the query execution time is long or when restoring the database to its state prior to query execution is challenging. You can add or change indexes or modify the query structure and then analyze changes to the estimated query plan after making these changes.
To set up an environment to compare estimated and actual query plans that differ, execute the code in Listing 4-29.
LISTING 4-29 Create test environment for comparing estimated and actual query plans
CREATE DATABASE ExamBook762Ch4_QueryPlans;
GO
USE ExamBook762Ch4_QueryPlans;
GO
CREATE SCHEMA Examples;
GO
CREATE TABLE Examples.OrderLines (
OrderLineID int NOT NULL,
OrderID int NOT NULL,
StockItemID int NOT NULL,
Description nvarchar(100) NOT NULL,
PackageTypeID int NOT NULL,
Quantity int NOT NULL,
UnitPrice decimal(18, 2) NULL,
TaxRate decimal(18, 3) NOT NULL,
PickedQuantity int NOT NULL,
PickingCompletedWhen datetime2(7) NULL,
LastEditedBy int NOT NULL,
LastEditedWhen datetime2(7) NOT NULL);
GO
INSERT INTO Examples.OrderLines
SELECT *
FROM WideWorldImporters.Sales.OrderLines;
GO
CREATE INDEX ix_OrderLines_StockItemID
ON Examples.OrderLines (StockItemID);
GO
Next, execute the code in Listing 4-30 to generate an estimated query plan. The inclusion of the SET SHOWPLAN_XML ON statement instructs SQL Server to generate the estimated plan without executing the query. As an alternative, you can use the following statements:
![]() SET SHOWPLAN_TEXT ON Returns a single column containing a hierarchical tree that describes the operations and includes the physical operator and optionally the logical operator.
SET SHOWPLAN_TEXT ON Returns a single column containing a hierarchical tree that describes the operations and includes the physical operator and optionally the logical operator.
![]() SET SHOWPLAN_ALL ON Returns the same information as SET SHOWPLAN_TEXT except the information is spread across a set of columns in which you can more easily see property values for each operator.
SET SHOWPLAN_ALL ON Returns the same information as SET SHOWPLAN_TEXT except the information is spread across a set of columns in which you can more easily see property values for each operator.
LISTING 4-30 Generate estimated query plan
SET SHOWPLAN_XML ON;
GO
BEGIN TRANSACTION;
UPDATE Examples.OrderLines
SET StockItemID = 300
WHERE StockItemID < 100;
SELECT
OrderID,
Description,
UnitPrice
FROM Examples.OrderLines
WHERE StockItemID = 300;
ROLLBACK TRANSACTION;
GO
SET SHOWPLAN_XML OFF;
GO
Click the result row to view the graphical query plan in its own window, as shown in Figure 4-28. Query 3 shows the use of an index seek operation in the SELECT statement.
Note SQL Server 2016 Service Pack 1 (SP1) behavior
If you are using SQL Server 2016 SP1 and have not applied any subsequent cumulative updates or service packs, the query plan is displayed as XML text instead of the graphical query plan.

Let’s take a closer look at the SELECT statement operations. Because this is an estimated plan, the UPDATE operation has not yet occurred. Therefore, there are no rows with StockItemID equal to 300 in the statistics. By hovering the cursor over the Index Seek (NonClustered) operator, you can display the tooltip that shows the Estimated Number of Rows is 1, as shown in Figure 4-29. It does not yet factor in the effect of the UPDATE operation. Consequently, the query optimizer selects an index seek an operation because it is efficient for a single row. However, if you check the Estimated Row Size for the UPDATE operator for Query 2 in the estimated query plan, the value is 104391, which is a significant discrepancy from the estimate for the index seek operation in Query 3.

To generate an actual query plan, execute the statements in Listing 4-31, which uses the SET STATISTICS XML ON statement to have SQL Server generate a graphical actual query plan. As an alternative, you can use the SET STATISTICS PROFILE ON statement to get the query plan information in a hierarchical tree with profile information available across columns in the result set. Figure 4-30 shows that SQL Server recognized the change of greater than 20% in the table’s statistics and performed an automatic update which in turn forced a recompilation of the SELECT statement’s query plan. This time the query optimizer chose a Table Scan operator because the number of rows to retrieve is nearly half the number of rows in the table.
Note SQL Server 2016 SP1 behavior
If you are using SQL Server 2016 SP1 and have not applied any subsequent cumulative updates or service packs, the query plan is displayed as XML text instead of the graphical query plan.
LISTING 4-31 Generate actual query plan
SET STATISTICS XML ON;
GO
BEGIN TRANSACTION;
UPDATE Examples.OrderLines
SET StockItemID = 300
WHERE StockItemID < 100;
SELECT
OrderID,
Description,
UnitPrice
FROM Examples.OrderLines
WHERE StockItemID = 300;
ROLLBACK TRANSACTION;
GO
SET STATISTICS XML OFF;
GO

Checking the tooltip for the Table Scan operation, shown in Figure 4-31, notice the Estimated Number of Rows is 104066 to reflect the updated statistics and the Actual Number of Rows is 104391.

FIGURE 4-31 Estimated Number of Rows and Actual Number of Rows in actual query plan for Table Scan operator.
Need More Review? Additional resource for query plans
For a deep dive into query plans, also known as execution plans, download Grant Fritchey’s SQL Server Execution Plans, Second Edition, a free e-book available at https://www.simple-talk.com/books/sql-books/sql-server-execution-plans-second-edition-by-grant-fritchey/.
Configure Azure SQL Database Performance Insight
Query Performance Insight is the name of a feature available in Azure SQL Database that allows you to review the effect of queries on database resources, identify long-running queries, or create custom settings to review query workloads. This feature available only with Azure SQL Database V12 and requires you to enable Query Store on your database before you can analyze queries. Because Query Store is enabled by default for a V12 database, you do not need to perform this extra step unless you previously disabled it.
Note Creating a SQL Database in the Azure portal
To work with the monitoring tools in SQL Database, you must have an Azure account and description. You must then create a SQL Database and associate it with a new or existing server. Last, you must configure the firewall settings to enable your IP address to access the database.
If you do not currently have an account, you can set up a free trial at https://azure.microsoft.com/en-us/free/. Then connect to the Azure portal at https://portal.azure.com. Next, to create a new sample database, click SQL Databases in the navigation pane on the left side of the screen, and then click Add to open the SQL Database blade. Here you provide a name for your database, select a subscription, select Create New in the Resource Group section, and provide a name for the resource group. In the Select Source dropdown list, select Sample, and then in the Select Sample dropdown list, select AdventureWorksLT [V12]. Click Server, click Create A New Server, provide a server name, a server admin login, password and password confirmation, and location. Be sure to keep the default selection of Yes for Create V12 Server (Lastest Update) as Query Performance Insight works only with SQL Database V12. Click Select to create the server. In the SQL Database blade, click Pricing Tier, select the Basic tier, and then click the Select button. For the sample database, you can use the lowest service tier level to minimize charges associated with this service. When you no longer need to work with the database, be sure to delete it in the Azure portal to avoid incurring ongoing charges. In the SQL Database blade, click Create to finalize the creation of the sample database. When the database is ready, it appears in the list of SQL Databases. You might need to click Refresh several times to see it appear.
When the SQL Database is available, click the dataset to open its blade, and then click the server name to open the server’s blade. Click Show Firewall Settings, click Add Client IP, and then click Save to enable your connection to the SQL Database. You can manually add client IPs to open the firewall to allow other users to access the database also.
Although you use the Azure portal to view the information available from Query Performance Insight, you must use SQL Server Management Studio to first enable Query Store on a SQL Database. To do this, click Connect in Object Explorer, type the full name of the server (such as mysampleserver2016.database.windows.net), select SQL Server Authentication in the Authentication drop-down list, type the admin login and password that you created for the database, and then click Connect.
Of course, before you can analyze queries, you must first execute several queries. Execute the query shown in Listing 4-32 which runs 20 times to create a workload on SQL Database. You must wait at least a couple of hours before you can view the corresponding workload analysis in Azure SQL Database Performance Insight.
LISTING 4-32 Execute SQL Database query multiple times after enabling Query Store
SELECT
c.LastName,
c.FirstName,
c.CompanyName,
year(OrderDate) AS OrderYear,
sum(OrderQty) AS OrderQty,
p.Name AS ProductName,
sum(LineTotal) AS SalesTotal
FROM SalesLT.SalesOrderHeader soh
JOIN SalesLT.SalesOrderDetail sod ON
soh.SalesOrderID = sod.SalesOrderID
JOIN SalesLT.Customer c ON
soh.CustomerID = c.CustomerID
JOIN SalesLT.Product p ON
sod.ProductID = p.ProductID
GROUP BY
c.LastName,
c.FirstName,
c.CompanyName,
year(OrderDate),
p.Name
ORDER BY
c.CompanyName,
c.LastName,
c.FirstName,
p.Name;
GO 20
When Query Store is unable to collect new data, you might see the following messages:
![]() “Query Store is not properly configured on this database. Click here to learn more.”
“Query Store is not properly configured on this database. Click here to learn more.”
![]() “Query Store is not properly configured on this database. Click here to change settings.”
“Query Store is not properly configured on this database. Click here to change settings.”
There are two ways to clear these messages. First, you can increase the Query Store size or clear Query Store. Second, you can change the Retention and Capture policy and enable Query Store by executing the ALTER DATABASE commands described in the “Create efficient query plans using Query Store” section earlier in this chapter.
When enough time has passed after queries have executed, open the Azure portal, select SQL databases in the navigation pane, click the database to analyze, and then select Query Performance Insight in the Support + Troubleshooting category. The Query Performance Insight blade includes the following three tabs:
![]() Resource consuming queries
Resource consuming queries
![]() Long running queries
Long running queries
![]() Custom
Custom
Resource consuming queries
The Resource Consuming Queries tab lists the queries consuming the most resources for the last 24 hours. The top of this section shows a line chart that by default shows the percentage of CPU over time consumed by various queries, as shown in Figure 4-32, although the values for the individual queries are too low to see clearly on the chart. You can click Data IO or Log IO in the top left section to review the relative resource consumption for these resources instead of CPU.

FIGURE 4-32 Resource Consuming Queries chart showing CPU and DTU components consumption for top resource consuming queries
This chart has many interactive features. For example, you can click on the red line on the chart to show the overall Database Throughput Unit (DTU) values, as shown in Figure 4-33. A DTU is a single metric to represent CPU, memory, and IO thresholds. You can also change the basis for determining the top five queries from CPU as shown to Data IO or Log IO by clicking the respective filter labels in the top left of the chart. Another option is to zoom in on a period of time by using the sliders (as indicated by the triangles along the horizontal axis of the chart) to increase or decrease the period of time to view in the chart.

When you scroll down this page, you can view the average CPU, Data IO, Log IO, duration, and execution count for the top 5 queries for a table, as shown in Figure 4-34.

When you click a query in this list, you can view its related details in a set of charts, as shown in Figure 4-35.
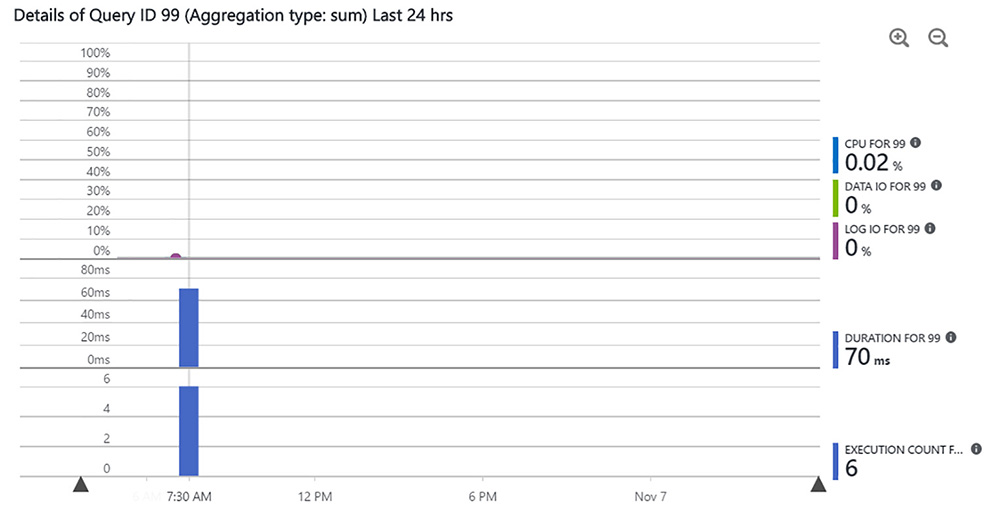
Below the charts, a table of time intervals displays the metrics, duration, and execution count for the selected query, as shown in Figure 4-36.

FIGURE 4-36 Query Performance Insight table showing metrics for a selected query at different time intervals
Long running queries
The Long Running Queries tab, shown in Figure 4-37, shows the top queries based on duration that have executed on the SQL Database during the past 24 hours. The top of the page shows a chart of each query’s duration by execution time and the bottom of the page shows a table of the key performance metrics for each query. You can use this information to find queries that might require tuning.

Custom
You can also optionally configure a custom view by selecting the Custom tab and then selecting values in each of the following drop-down lists:
![]() Metric type Select one of the following metrics by which to determine top queries: CPU, Data IO, Log IO, Duration, or Execution Count.
Metric type Select one of the following metrics by which to determine top queries: CPU, Data IO, Log IO, Duration, or Execution Count.
![]() Time interval Select one of the following time intervals to set as boundaries for selecting top queries: last 6 hours, 24 hours, past week, past month, and a custom range.
Time interval Select one of the following time intervals to set as boundaries for selecting top queries: last 6 hours, 24 hours, past week, past month, and a custom range.
![]() Number of queries Select one of the following numbers to use when selecting top queries: 5, 10, or 20.
Number of queries Select one of the following numbers to use when selecting top queries: 5, 10, or 20.
![]() Aggregate function Select one of the following aggregate functions to use when aggregating metric values: Sum, Max, or Avg.
Aggregate function Select one of the following aggregate functions to use when aggregating metric values: Sum, Max, or Avg.