
Chapter 13. Troubleshooting system performance issues
This chapter covers
- Understanding and measuring your system behavior
- Controlling application and client demands on system resources
- Multilevel strategies for addressing resource shortages
- Strategies for effective ongoing monitoring protocols
Do “cascading chaos” and “impending doom” describe your IT operations right now? Are your servers slow and unresponsive? Do your customers complain about poor application performance? Or have you stopped bragging about the unbelievable experience you get from your new-ish workstation?
Even if it’s not as bad as all that, life won’t always progress smoothly. The fact that, by definition, we’re always trying to squeeze the greatest possible value from our IT investments means that sometimes we’ll push a bit too far: stressed systems will sometimes break, and complicated software stack elements will sometimes stop working together.
The secret to a long and happy life is to anticipate trouble, quickly identify the symptoms and causes, and apply the right fixes at the right time. And this should help in your work as an IT admin as well.
What do I mean by system? It’s the hardware and software environment you’re using to deliver your service, whether it’s an application, database, web server, or the reliable use of a simple standalone workstation. In this chapter, you’ll focus on the health and well being of the four core elements of your system: the central processing unit (CPU), memory (RAM, both physical and virtual), storage devices, and network load management. You’ll learn about spotting trouble, pinpointing the cause, and then either fixing the underlying problem or, if necessary, throwing more hardware at it.
Of course, you would always prefer to avoid problems altogether. One way to do that is to subject your healthy system to stress testing to see how it stands up. A bit later in the chapter I’ll also include a quick look at yes, a great tool for subjecting your infrastructure to cruel and unusual torture.
In any case, I’m going to assume that one of the servers or workstations for which you’re responsible has been misbehaving: crashing or slowing down at the worst possible moments. You glare at it with your meanest, nastiest expression for a minute or two, but the machine doesn’t seem impressed, nor does it respond. Let’s work through this one step at a time.
13.1. CPU load problems
The CPU is your computer’s brain. The electronic circuits that make up a CPU, no matter how many cores there might be and how wide the bus they’re using, are only expected to do one thing: wait for instructions passed in by software programs, perform calculations, and spit back answers.
By and large, either your CPU will work or it won’t. Most CPU-related performance issues (like sluggish response times or unexpected shutdowns) can be traced to pushing them beyond their physical capacity. One of the first things you’ll need to do when wondering whether a particular performance issue may be connected to the CPU is find out if you’re being too rough on the poor dear.
13.1.1. Measuring CPU load
Two indicators of CPU state include CPU load and CPU utilization:
- CPU load is a measure of the amount of work (meaning the number of currently active and queued processes) being performed by the CPU as a percentage of total capacity. Load averages that represent system activity over time, because they present a much more accurate picture of the state of your system, are a better way to represent this metric.
- CPU utilization (or usage) is a measure of the time a CPU is not idle (described as a proportion of the total CPU capacity).
A load score of 1 on a single-core machine would represent full capacity. If your system has multiple CPU cores, say four, then full capacity would be represented by the number 4. User experience will probably start to suffer (at least from time to time) once the CPU utilization score rises above 75%, which would be 0.75 for a single core, and 3.0 on a quad-core system.
Getting your CPU load average is easy. Running uptime returns the current time, the elapsed time since the more recent system boot, the number of users currently logged in, and, most importantly for us right now, load averages for the last minute, 5 minutes, and 15 minutes:
$ uptime
10:08:02 up 82 days, 17:13,  1 user,  load average: 0.12, 0.18, 0.27
A load average of 1.27 on a system with one CPU would mean that, on average, the CPU is working to capacity and another 27% of processes are waiting for the their turn with the CPU. By contrast, a load average of 0.27 on a system with one CPU would mean that, on average, the CPU was unused for 73% of the time. On a four-core system, you might see load averages in the range of 2.1, which would be just over 50% of capacity (or unused for around 52% of the time).
To properly understand those numbers, you’ll have to know how many cores your system is running. In case that information isn’t printed on a chassis sticker and you’re not interested in opening up the case and looking for yourself, you can query the pseudo file cpuinfo:
$ cat /proc/cpuinfo | grep processor
processor    : 0
processor    : 1
processor    : 2
processor    : 3
Looks like there are four cores in that system. Because you’re there anyway, take a look through the rest of that file to get a feel for the way Linux describes your CPU. In particular, try to make sense of the flags section, which lists the features supported by your hardware.
13.1.2. Managing CPU load
Consistently under capacity (based on the results you get from uptime)? You could just enjoy the extra head space. Or you might consider consolidating resources by using the underused computer to deliver additional services (rather than purchasing additional servers) to maximize your return on investment.
Consistently over capacity? You’ll either need to switch to a more robust hardware architecture with more CPU cores or, in a virtual environment, provision for more VMs or containers to pick up the extra work. Once in a while, you could also take a closer look at the processes running on your system to see if there isn’t something that could be shut down or even something that’s been running rogue without your knowledge. Running top provides a rich, self-updating display of process information.
Figure 13.1 is a typical screenfull of data from top. Notice how the first line provides the same insights you would get from running uptime. Because you’re trying to resolve performance problems, the columns of data that should interest you the most are %CPU (percentage of CPU capacity currently used by a given process) and especially the processes showing up at the top of the list.
Figure 13.1. A snapshot of process data displayed by top

In this case, you can see that the MySQL daemon is using 4.3% of the server’s CPU and, from the next column, 13% of its memory. If you follow that row over to the left, you’ll see that the process ID is 1367 and the process is owned by the mysql user. You might conclude that this process was taking more resources than can be justified and will have to be sacrificed (for the greater good, you understand). You can exit top by pressing the q key.
That top display gave you everything you’ll need to kill the process. Because MySQL is a service managed by systemd, your first choice should be to use systemctl to bring the process down gently, without putting any application data at risk:
# systemctl stop mysqld
If it’s not managed by systemd, or if something’s gone wrong and systemctl failed to stop it, then you can use either kill or killall to eliminate your process (some systems require you install killall as part of the psmisc package). You pass the PID to kill this way:
# kill 1367
On the other hand, killall uses the process name rather than its ID:
# killall mysqld
To kill or to killall, that is the question. Actually, the answer is kind of obvious. kill will shut down a single process, based as it is on the PID, whereas killall will kill as many instances of a particular program as happen to be running. If there were two or three separate MySQL instances, perhaps belonging to separate users, all would be stopped.
Note
Before launching killall, make sure there aren’t any similarly named processes running that could become collateral damage.
You’ll also have to use systemctl once again to make sure that the process doesn’t restart the next time you boot:
# systemctl disable mysqld
Setting priorities with nice
Sometimes you won’t be able to kill a process because it’s a necessary part of a mission-critical service. But you can limit the CPU resources it gets using nice. By default, a new process is given a nice value of 0, but you can change that to any number between -20 and 19. The higher the number, the nicer the process will be when it comes to giving up resources in favor of other processes. And, by contrast, the lower the number, the less nice the process will be as it grabs as many resources as it can get, regardless of the pain and suffering that might cause others.
Let’s say that you want to run a script called mybackup.sh that sets a large remote backup operation in motion. The problem is that this is an active server that, from time to time, needs a lot of power to respond to important client requests. If a request comes in while the backup is running at full speed, the performance won’t be acceptable. On the other hand, if the backup is throttled back from start to finish, it might never finish.
Here’s how nice can help you deal with this in a way that leaves everyone relaxed and smiling. Prepend the script (or any other command name) with nice and the numeric value you’ve chosen for it. In this case, the dash (-) followed by 15 tells Linux that the script will run with a very nice attitude. This means that when there’s a conflict over resource access, your script will back off, but otherwise it’ll take whatever’s available:
# nice -15 /var/scripts/mybackup.sh
If running your script is an urgent priority that has to complete as soon as possible, you could add a second dash to give the process a negative value (-15), as in this example:
# nice --15 /var/scripts/mybackup.sh
Either way, if you want to see this in action, create a script and, while it’s executing, have a second terminal running top. You should see your process running, and its appropriate nice value should appear in the NI column.
For many Linux programs, you can also set default nice values. rsync, on Ubuntu at least, allows you to explicitly define how nice it will be through the RSYNC_NICE setting in /etc/default/rsync.
Listing 13.1. A possible nice setting from the /etc/default/rsync configuration file
RSYNC_NICE='10'
You can also use renice to change the way a process behaves even after it’s started. This example will, when necessary, limit the resources available to the process currently assigned PID 2145:
renice 15 -p 2145
Tips for top
In case you ever need them, the third line of the top output you saw a bit earlier gives you time values (as percentages) for a number of other CPU metrics. Table 13.1 offers a quick rundown of the jumble of acronyms you’ll see there.
Table 13.1. Symbols for CPU-related metrics displayed by top
|
Metric |
Meaning |
|---|---|
| us | Time running high-priority (un-niced) processes |
| sy | Time running kernel processes |
| ni | Time running low-priority (nice) processes |
| id | Time spent idling |
| wa | Time waiting for I/O events to complete |
| hi | Time spent managing hardware interrupts |
| si | Time spent managing software interrupts |
| st | Time stolen from this VM by its hypervisor (host) |
Note that the top display can be customized in real time through keyboard input. Type h to learn more.
13.1.3. Making trouble (simulating CPU load)
Need to try some of these tricks out but, wouldn’t you know it, everything is running smoothly? Why not simulate crisis-level CPU overload for yourself?
Much like children, yes will output (digital) noise continuously until told to stop. On second thought, that’s not at all like kids. This command will redirect that noise to the disposable /dev/null file and the ampersand (&) character will push the process into the background, giving control of the command line back to you. To ramp up the pressure, launch the command a few more times:
$ yes > /dev/null &
That should keep them busy. While all that’s running, watch top to see what’s happening. You could also try to run other applications to see how much it will take to slow them down. When you’re done, run killall to knock off all your yes sessions in one go:
$ killall yes
13.2. Memory problems
For all the great advances in information technology over the years, random access memory (RAM) itself is still used the same way it always was. Computers speed up core compute operations by loading OS kernels and other software code into volatile RAM modules. This permits quick system access to frequently requested software instructions.
The biggest challenge with memory is usually its limits. My first computer had 640 KB of RAM (that’s less than 1 MB) and it wasn’t enough. I’d leave my computer on overnight just to render a single 640 × 480 GIF image. The workstation sitting under my desk right now has 8 GB and, once I add three VirtualBox VMs to my regular workload it, too, starts to feel the pain.
13.2.1. Assessing memory status
Generally, a memory-starved system will fail to complete requested tasks or just slow down. Of course, these problems can describe all kinds of things, so you’ll want confirmation before jumping to conclusions. Short of focusing an electron microscope on the memory modules plugged into your motherboard, running free is the most direct way to do that.
free parses the /proc/meminfo file and displays the total physical memory available (described as 7.1 GB in this example) and the way it’s currently being used. shared is memory that’s used by tmpfs to maintain the various pseudo file systems we’ve come to know and love, like /dev/ and /sys/. Buffers and cache are associated with memory used by the kernel for block level I/O operations (don’t worry too much if you don’t understand what that’s all about).
Any memory in use by any system process is designated as used. The available value is an estimate of the memory that’s currently available for launching new applications, even if it’s currently being used by disk caching, without having to dip into swap memory (which you’ll meet in much a moment or two). Here’s an example:
$ free -h
       total   used   free   shared  buff/cache  available
Mem:   7.1G    2.8G   1.3G   372M          3.0G       3.5G
Swap:  7.2G    540K   7.2G
You’ll notice that I added the -h argument to free, which displays the output in human-readable format, using easier-to-read larger numeric units (GB, MB, and KB) rather than bytes.
This example looks like a healthy system with plenty of room for growth. But if the value of free is consistently a lot closer to 0 and transferring load to swap memory doesn’t alleviate the problem, then you may need to add memory. Now, about that swap...
13.2.2. Assessing swap status
Because, byte for byte, RAM modules tend to be more expensive than disk storage, many OS installations designate a file or partition on the storage drive for use as an emergency source of virtual RAM. That way even if, strictly speaking, you don’t have quite enough RAM for all of the processes that’ll be running, an overloaded system won’t fail, although it will run noticeably slower.
You can get a glimpse of the way swap is being used on your system from vmstat. The 30 and 4 arguments added to the command here tell the program to return four readings with 30-second intervals between each reading. In a real-world case, you’d probably want to extend the testing over a longer period, perhaps a couple of hours, to increase the accuracy of your results. The two columns you should watch most closely are si, which measures data transfers from swap into system memory, and so, which reports transfers out of system memory into swap. As promised, here’s the command:
$ vmstat 30 4
procs -----------memory---------- ---swap-- -----io---- -system-- ------cpu--
r  b  swpd   free   buff  cache   si  so   bi   bo   in   cs us sy id wa st
0  0  540 1311400 373100 2779572    0   0   35   41  418  186  4  1 94  1  0
0  0  540 1311168 373104 2779540    0   0    0    9  671  881  0  0 99  0  0
0  0  540 1311216 373116 2779508    0   0    0   33  779 1052  1  1 98  0  0
0  0  540 1310564 373116 2779476    0   0    0    2  592  815  0  0 99  0  0
If you’re getting consistent movement into and out of swap, you should consider adding physical RAM, unless the slower performance isn’t a problem for your workload.
13.3. Storage availability problems
If your application software stack regularly writes new documents, data, or log files to storage drives, then you can’t ignore the fact that there are always limits to the space you’ve got available. Something that can’t go on forever will eventually stop. And those data writes will stop when there’s no free space left on your drive, taking your system functionality with it.
How can you tell how close you are? Easy. You’ve already met df. Because devices don’t use any actual disk space, you can ignore those listed in the Use% column as using 0% of their maximum space. You already know that they’re pseudo file systems. But you should focus on the others, and particularly the root partition (/). In this case, root still has 686 GB (nearly 80%) free, so there’s no need to worry right now. But this is obviously something you’ll want to check regularly:
$ df -h
Filesystem      Size  Used Avail Use% Mounted on
udev            3.5G     0  3.5G   0% /dev
tmpfs           726M  1.5M  724M   1% /run
/dev/sda2       910G  178G  686G  21% /                  1
tmpfs           3.6G   71M  3.5G   2% /dev/shm
tmpfs           5.0M  4.0K  5.0M   1% /run/lock
tmpfs           3.6G     0  3.6G   0% /sys/fs/cgroup     2
/dev/sda1       511M  3.4M  508M   1% /boot/efi
tmpfs           726M   72K  726M   1% /run/user/1000
- 1 The root partition entry
- 2 A pseudo file system; note the 0 bytes used.
That’s the easy way to track your usage. The hard way happens when you find you’re unable to save a file to disk, or you log in to the system and get a message that your session is read-only.
To be sure, not every read-only failure is a result of a full storage drive. It could also mean that the physical device is failing. In that case, you’ll want to immediately get to work saving any important data on to peripheral drives or online storage accounts before the drive goes down completely. How can you tell the difference? df, if your system is healthy enough to run it, should help, but if in doubt, safe beats sorry every time.
13.3.1. Inode limits
Physical space isn’t the only constraint on Linux data storage. You’ll remember our discussion back in chapter 12 where we noted that all Linux file system objects are identified and managed through metadata contained in unique inodes. It turns out that there’s a hard limit to the number of inodes you’re permitted on a system, and it’s possible to run out of inodes even though there’s still plenty of physical space available.
Note
The number of available inodes is permanently set when the file system is created. Considering that inodes themselves take up space, when creating a file system (using a tool like mkfs.ext4, for instance), the goal is to find a balance that allows for the most potential files while wasting the least disk space.
Here’s what it looks like when I run df on the same system as before, but this time with the -i argument to display inode data:
$ df -i
Filesystem       Inodes  IUsed    IFree IUse% Mounted on
udev             914806    546   914260    1% /dev
tmpfs            928143    797   927346    1% /run
/dev/sda2      60547072 701615 59845457    2% /                  1
tmpfs            928143    155   927988    1% /dev/shm
tmpfs            928143      5   928138    1% /run/lock
tmpfs            928143     16   928127    1% /sys/fs/cgroup
/dev/sda1             0      0        0     - /boot/efi
tmpfs            928143     31   928112    1% /run/user/1000
- 1 This is the root partition, the one whose inode status is most important.
With so many free inodes, there’s no immediate cause for alarm on this system, but you would definitely want to take action if you saw yourself getting within 10% or 20% of your ceiling. One of my servers was once hit with maxed-out inodes, and it took a few minutes before I even understood what had happened. Let me tell you all about it.
The first indication of trouble was when I tried to install some new software using apt. The installation failed, displaying an error message that included the words No Space Left on Device. Now that was plain crazy talk, as I knew there were still gigabytes free. It took some web searching to prompt me to check my inode levels: sure enough, I was fresh out on that particular partition.
Logically, the next step is to search for directories containing the largest numbers of files. After all, concentrations of inodes will probably be found hanging out in the places frequented by lots of files. Here’s how to tune find to give you that information:
$ cd /
# find . -xdev -type f | cut -d "/" -f 2 | sort | uniq -c | sort -n
Table 13.2 explains what it all means.
Table 13.2. find command syntax
|
Syntax |
Function |
|---|---|
| . | Start searching within and below the current directory. |
| -xdev | Remain within a single file system. |
| -type f | Search for objects of type file. |
| cut -d "/" | Remove text identified by the delimiter (/ character, in this case). |
| -f 2 | Select the second field found. |
| sort | Sort lines of output, and send to standard out (stout). |
| uniq -c | Count the number of lines sent by sort. |
| sort -n | Display the output in numeric order. |
That’s a great command. The trouble was that it failed because find temporarily saves raw data to disk. But because I was out of inodes, saving anything was currently impossible. Terrific. Now what? Free up a little space by finding a couple of unnecessary files and deleting them. With that done, here’s what find showed me:
# find . -xdev -type f | cut -d "/" -f 2 | sort | uniq -c | sort -n
5 root
48 tmp
127 sbin
128 bin
377 boot
989 etc
2888 home
6578 var
15285 lib
372893 usr            1
- 1 The /usr/ directory obviously wins the award for “most files in a single directory tree.”
Warning
Because it might have to search through thousands of files and directories, find can take some time to run.
By far the largest number of files were somewhere beneath the /usr/ directory. But where? No problem, move down a level and run find once again:
$ cd usr
# find . -xdev -type f | cut -d "/" -f 2 | sort | uniq -c | sort -n
6 include
160 sbin
617 bin
7211 lib
16518 share
348381 src                 1
- 1 The directory containing the most files
This time, /usr/src/ is the obvious culprit. Just what goes on in /usr/src/? It turns out that that’s where the kernel headers are kept, including those left over from previous kernel versions installed on your machine. If you drill down through the directory tree, you’ll see that there are, indeed, a whole lot of files.
13.3.2. The solution
To free up space, you may need to manually remove some of the older directories. Then, assuming you’re using Ubuntu, let dpkg safely remove whatever else isn’t needed through --configure:
# dpkg --configure -a
To safely remove all the old kernel headers themselves, run autoremove, and everything should go back to optimal working order:
# apt-get autoremove
On CentOS, install the yum-utils package and then run package-cleanup. Adding --count=2 will remove all but the most recent two kernels:
# package-cleanup --oldkernels --count=2
Tip
It’s always a good idea to keep at least one older kernel to fall back on in case something breaks with the latest one.
What can be done to address storage limitations? The most obvious thing is to add more storage. But you can also periodically audit your system to see what can be deleted or transferred to alternate and often cheaper storage solutions. Amazon’s Glacier is a great place to keep large data stores that aren’t accessed frequently.
You should also work to reduce the sheer volume of data you produce. As you saw in chapter 11, one way to do that is to make sure your logs are regularly rotated and retired.
13.4. Network load problems
When the words network and problem come together in a single sentence, most people probably think first of failed connections. But that’s what we’re going to talk about in the next chapter. Here, however, is where we discuss how to handle an active and healthy connection that’s overloaded.
When should you suspect the load’s beyond your capacity? On a regular desktop workstation, you’ll probably see downloads that take longer than they should or fail altogether; on a public-facing server, your clients may complain of slow service. Such symptoms could be the result of more than one cause, so you’ll want to do some further investigations and then try out possible solutions. That’s what you’ll learn next.
13.4.1. Measuring bandwidth
Literally dozens of Linux tools exist for providing insight into network usage. The two that I’m going to show you are particularly useful for quickly identifying the resources using most of the bandwidth that, in turn, will allow you to intelligently address the underlying issues.
Like top, iftop (acquired by installing the iftop package through the usual channels) displays a self-updating record of the greediest network activity traveling through the network interface: specify iftop -i eth0.
As you can see from figure 13.2, iftop lists the network connections between my computer (workstation) and remote hosts, along with the bandwidth consumed in bytes or kilobytes. The connections are listed in inbound/outbound pairs. Obviously, high-consuming connections will have to be examined and, if necessary, removed. The bottom rows of the display track cumulative and peak usage (both inbound and outbound), along with average usage rates.
Figure 13.2. A typical iftop display of network connections and their bandwidth usage

You should carefully scan and analyze the remote hosts iftop identifies. Regular monitoring could uncover unexpected drains on your network resources and even previously unidentified malware that iftop catches “calling home.” Calls to Amazon or Google might not be noteworthy, but strange and obscure URLs should inspire a second look.
iftop is great for narrowing down network usage from a remote host perspective (something that will be useful for troubleshooting web browser traffic, for instance). But sometimes you’ll need to manage local processes through their PIDs; iftop won’t help with that. NetHogs (installed through the nethogs repository package), on the other hand, will. Launch NetHogs from the command line by specifying a network interface. Note that this time you don’t include a -i flag:
# nethogs eth0
Figure 13.3 shows a typical NetHogs display on my workstation, including PIDs for both my Linux Slack client (hey, I also need to keep up with my colleagues) and the Chrome browser. If something was misbehaving, I could track it down and control it through its PID.
Figure 13.3. A relatively quiet day on my workstation, as seen through NetHogs

13.4.2. Solutions
Once you’ve narrowed down a system process that’s causing you trouble, you’ll have to figure out how to deal with it. If it’s not essential or if it’s a rogue, malware process, you could shut it down permanently the way you saw earlier using systemctl, kill, or killall. But, more often than not, that won’t be possible: most of the processes running on your servers are probably there for a reason.
You could also consider upgrading your network connection. This might involve calling your ISP to discuss increasing the level of service provided. For local on-site networks, you might also think about improving your networking hardware. If your cabling capacity is currently capped at 100 MB/s (CAT 5), you could upgrade to 1000 MB/s (CAT 6). Remember that it’s not enough to change the cables. All your routers, switches, and the interfaces attached to your devices must also have that capacity for the benefits to be fully felt. Beyond ethernet cabling, moving to fiber optics can deliver even higher performance but for a much higher price.
13.4.3. Shaping network traffic with tc
A more subtle and sophisticated solution to load problems is traffic shaping. Rather than completely shutting down particular services, you can, as an example, place a ceiling on how much bandwidth processes are given. In a way, you want to manage bandwidth the same way that you earlier saw nice managing processes. This could make it possible for limited resources to be evenly, or strategically, shared across your system.
For instance, you could limit the bandwidth allowed to web clients to guarantee that other processes (like DNS updates or backups) won’t be starved of bandwidth. As a quick and dirty illustration, I’ll show you how to impose a basic throttle on an internet-facing network interface using the Traffic Control (tc) tool. tc is normally installed on Linux by default.
First, ping a remote site and note the response times you get. This example averaged around 37 milliseconds:
$ ping duckduckgo.com
PING duckduckgo.com (107.21.1.61) 56(84) bytes of data.
64 bytes from duckduckgo.com (107.21.1.61):
      icmp_seq=1 ttl=43 time=35.6 ms                                       1
64 bytes from duckduckgo.com (107.21.1.61): icmp_seq=2 ttl=43 time=37.3 ms
64 bytes from duckduckgo.com (107.21.1.61): icmp_seq=3 ttl=43 time=37.7 ms
- 1 The time value represents the time needed for a single round-trip operation.
To make sure there aren’t any existing rules associated with your network interface (eth0, in this example), list all the current rules:
$ tc -s qdisc ls dev eth0                                      1
qdisc noqueue 0: root refcnt 2
 Sent 0 bytes 0 pkt (dropped 0, overlimits 0 requeues 0)
 backlog 0b 0p requeues 0
- 1 qdisc stands for queueing discipline, a queue through which network-bound data packets must pass.
Now add a rule that delays all traffic by 100 ms. This will add 100 extra milliseconds to each network transfer, allowing other processes a greater share of resources. It’ll also slow down your network activity, so you have to be comfortable with the results. Don’t worry, I’ll show you how to undo all of this in just a moment:
# tc qdisc add dev eth0 root netem delay 100ms
Once again, list the tc rules and note the new rule that delays traffic by 100 ms:
$ tc -s qdisc ls dev eth0
qdisc netem 8001:
   root refcnt 2 limit 1000 delay 100.0ms                     1
 Sent 514 bytes 3 pkt (dropped 0, overlimits 0 requeues 0)
 backlog 102b 1p requeues 0
- 1 qdisc now has a single rule delaying traffic by 100 ms.
Test your rule. Run ping again, and watch the values of time. They should now be higher by around 100 milliseconds:
$ ping duckduckgo.com
PING duckduckgo.com (107.21.1.61) 56(84) bytes of data.
64 bytes from duckduckgo.com (107.21.1.61): icmp_seq=1 ttl=43 time=153 ms
64 bytes from duckduckgo.com (107.21.1.61): icmp_seq=2 ttl=43 time=141 ms
64 bytes from duckduckgo.com (107.21.1.61): icmp_seq=3 ttl=43 time=137 ms
Worked out as you expected? Great. You’ll probably want to restore your system to its original state, so run this command to delete the rules, and then test everything again to confirm you’re back to normal:
# tc qdisc del dev eth0 root
tc is a complicated piece of software, and a complete guide could probably fill a book of its own. But I think you’ve seen enough to get a taste of the functionality it offers. As with everything else here, the goal is to put the tools in your hands so you can dig deeper and apply them to your specific problems.
13.5. Monitoring tools
As with most administration-related tasks, remembering to get around to running each of the various tools discussed so far in this chapter, well, it just isn’t going to happen all that often. Some tasks can be scripted, managed by cron, and programmed to issue alerts when preset thresholds are met. Those are great. But there’s also no substitute for having eyes on actual ongoing data at least once in a while. Here are a few ideas to help you set up an effective monitoring system.
13.5.1. Aggregating monitoring data
nmon is a multi-target system monitoring and benchmarking tool. It offers you a customizable single view of limited details into the status of all system components. You get it going by installing the nmon package and then running nmon from the command line. The first screen you’ll see will look like the one in figure 13.4 and will display the keystrokes used to toggle various views.
Figure 13.4. The nmon intro screen, including basic usage instructions

The key here is toggle because, for instance, pressing c once displays the CPU information view, whereas pressing it again will make CPU go away. This setup makes it possible to add multiple views to the screen. Pressing c, m, and n will enable the CPU, Memory, and Network views all at once, as you can see in figure 13.5. This is a great way to build a single window view through which you can catch frequently updated overviews of your system. By the way, q will quit the screen.
Figure 13.5. Multiple services being monitored in a single nmon screen

nmon will only cover you for a single server. If you’re responsible for a whole fleet of them, you’ll need something a bit more robust like Nagios or collectd for keeping track of the health and activities of multiple servers, and Munin for tracking trends and providing useful analysis.
13.5.2. Visualizing your data
Great. But this will still only work when you’re actually looking. Head out for an extended coffee break, and you could completely miss a full-scale melt down. Helpfully, nmon lets you record the data it collects over time to a file. This example saves data collected every 30 seconds over a full hour (120 * 30 seconds) to a file in the current working directory:
# nmon -f -s 30 -c 120
If your system hostname is ubuntu, then the default filename will consist of ubuntu, a date and time stamp, and a .nmon extension:
ubuntu_170918_1620.nmon
As long as your system has a web server installed, you can use a tool called nmonchart to convert the data files to the much more user-friendly .html format. You’ll need to get the tool from the nmon SourceForge site (https://sourceforge.net/projects/nmon/files). The simplest way is to right-click the nmonchartx.tar file (the x will be a version number) and copy the URL. From the command line of your server, use wget to download the tar file, and then unpack the archive the usual way:
$ wget http://sourceforge.net/projects/nmon/files/nmonchart31.tar
$ tar xvf nmonchart31.tar
Here’s how you’ll invoke nmonchart to convert the .nmon file and save it to your web root directory:
# ./nmonchart ubuntu_170918_1620.nmon /var/www/html/datafile.html
In case you’re faced with an error complaining about the lack of a ksh interpreter, feel free to install the ksh package. A command-line interpreter, ksh is an alternative to Bash:
-bash: ./nmonchart: /usr/bin/ksh: bad interpreter: No such file or directory
When all that’s done, you can point your browser to your server’s IP address followed by the filename you specified for nmonchart:
10.0.3.57/datafile.html
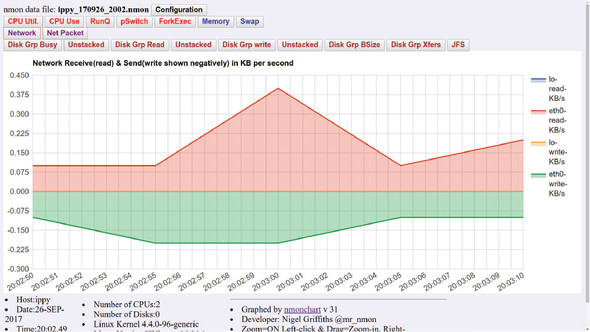
That should give you a page looking something like figure 13.6.
Figure 13.6. An nmap-generated web page with the Network button clicked
You can script all this, including code to generate sequential .html filenames. That makes it convenient to keep up with both new and archived events.
Summary
- The uptime tool can provide insight into average CPU loads over time, and unusual results can prompt you to look for and manage high-use processes.
- The nice command can closely control the way processes compete with each other for limited system resources.
- Actual and swap memory can be monitored using tools like free and vmstat.
- Storage limits are defined by both available physical disk space and available inodes.
- iftop and NetHogs are two among dozens of Linux tools for accessing network load data, and tc can be used to control usage.
- Regular monitoring is possible using command-line tools, but scripting them or pushing monitoring data to browser-based visual representations is far more likely to be effective.
Key terms
- CPU load is the amount of work being performed by the CPU.
- CPU utilization is the proportion of CPU capacity currently being used.
- nice lets you control the priority a process has in the face of conflicts for limited resources.
- RAM memory holds the OS kernel and other important software to provide fast access to key data.
- Swap memory is space on a hard drive designated as virtual RAM, in case you run out of the real thing.
- Inodes are metadata containing location and other information and are associated with all Linux file system objects.
- Network traffic throttling limits the amount of bandwidth allowed to one process in favor of one or more processes of higher priority.
Security best practices
- Periodically scan your running processes, looking for rogue software that wasn’t started by authenticated users or by your base system.
- Running iftop can show you remote network hosts with live connections to your system. If you don’t recognize a connection, it might be unauthorized and dangerous.
Command-line review
- uptime returns the CPU load averages over the past 1, 5, and 15 minutes.
- cat /proc/cpuinfo | grep processor returns the number of system CPU processors.
- top displays real-time statistics for running Linux processes.
- killall yes shuts down all running instances of the yes command.
- nice --15 /var/scripts/mybackup.sh raises the priority of the mybackup.sh script for system resources.
- free -h displays total and available system RAM.
- df -i displays the available and total inodes for each file system.
- find . -xdev -type f | cut -d "/" -f 2 | sort | uniq -c | sort -n counts and displays the numbers of files by parent directory.
- apt-get autoremove removes old and unused kernel headers.
- nethogs eth0 displays processes and transfers data related to network connections using the eth0 interface.
- tc qdisc add dev eth0 root netem delay 100ms slows down all network transfers through the eth0 interface by 100 milliseconds.
- nmon -f -s 30 -c 120 records data from a series of nmon scans to a file.
Test yourself
Which of the following CPU load scores would likely cause system slowdowns on a two-core system?
- 1.7
- 2.1
- .17
- 3.0
The load scores displayed by uptime represent averages over
- 1, 10, and 25 minutes
- 1, 5, and 24 hours
- 1, 5, and 15 minutes
- 10, 60, and 300 seconds
Which of the following files will contain information about the number of processors on your system?
- /proc/uptime
- /sys/cpuconf
- /proc/cpuinfo
- /etc/proc/envinfo
Which of the following commands will shut down a mysqld process with a PID of 4398?
- kill mysqld
- killall mysqld
- killall 4398
- kill mysqld:4398
You want to reduce the priority given to your mybackup.sh script. Which of the following will drop its priority the most?
- nice -10 /var/scripts/mybackup.sh
- nice -0 /var/scripts/mybackup.sh
- nice --15 /var/scripts/mybackup.sh
- nice -15 /var/scripts/mybackup.sh
Which of the following sets of symptoms most suggests a serious, ongoing memory problem?
- Slow application performance and high levels of data transfers into and out of swap
- Slow application performance and low levels of data transfers into and out of swap
- Slow application performance and high CPU load average scores
- Slow application performance and high inode availability
Which of the following will provide PIDs along with network bandwidth data?
- nmon -i eth0
- nethogs eth0
- nethogs -i eth0
- iftop eth0
How should you slow down network traffic through the eth0 interface by 100 milliseconds?
- tc qdisc add dev eth0 root netem delay 1000ms
- tc qdisc add eth0 root netem delay 100ms
- tc qdisc add dev eth0 root netem delay 100ms
- tc qdisc add dev eth0 root netem -h delay 100ms
Answer key
a
c
c
b
d
a
b
c