DEADLY TEMPTATION #2
Trust It All to Our Expertise
We told you in Rule #3 that if someone—a friend of yours, perhaps—tells you that a particular broker or financial advisor has done very well for her clients, and you should consider hiring her, you should tune it out. Wouldn’t it be great, though, to have someone take care of your investments? They would grow nicely, and you wouldn’t have to worry about a thing. It sounds very comforting to have someone just deal with the whole realm of investing for you, especially if you’re convinced it’s all too complicated and you just don’t want to think about it.
But is it worth giving up one-third to three-fourths of your investment gains for this comfort? If you knew that another, lower-cost advisor—offering simpler, less technical-sounding investment advice, or even no advisor at all—would provide you half again to three times more in investment gains, then how comfortable would you feel?
Because that is, indeed, how much it costs—even when the cost appears low as a percentage of your assets. Let’s go through the numbers to show what we mean.
Suppose that you’re 35 and you save $10,000 a year until you’re 65, and suppose your friend’s advisor charges 1% of investment assets annually. All else being equal, your real investment gains when you’re 65 will be only two-thirds what they would have been if you didn’t have to pay the 1%.1 You will have lost a very large amount to pay your advisor.
This becomes much worse in the typical case where investors pay fees not only for an advisor, but for overly costly investment products that the advisor recommends. For example, if the investor pays a total of 2% in additional fees, in excess of the very low fees for a global index fund and TIPS, then the investor will lose 60% of her investment gains as a result of these fees. If the total fees are 2.5%—as they commonly are—then the investor will lose more than 70%. (See the 3 Rules of Investing website for more information.)
It’s not worth it. Not only that, but you may actually get a poor education about investing. Most often it is the advisor herself who is misinformed; she has absorbed the standard advice model that is so widely accepted—illogical and wrong though it may be—and she is just passing it on.
This calls for a massive reeducation campaign—for investors, advisors, financial media representatives, and many others. If it’s effective, it will change the industry. Many financial industry participants will be paid less or will find work elsewhere. Those who remain will be able to service more clients for lower fees each, because they will be able to tell the truth that it’s all very simple and can be done inexpensively.
Perhaps this is a Utopian vision, but an industry as distorted as this one is shouldn’t be able to survive in its current form forever.
QAIB REPORTS: INVESTORS BEHAVING BADLY?
For a number of years, a company named DALBAR has been publishing a report called the “Quantitative Analysis of Investor Behavior” (QAIB). The QAIB purports to show that investors make bad decisions and, as a result, their investments underperform the market by several percentage points. This material is a godsend to financial advisors because it implies that investors need to hire an expensive financial advisor to help them. It’s also been a godsend to DALBAR. It has captured headlines for years, perpetuating the myth that individual investors invest poorly, and therefore they do much worse than the market average.
Financial advisors have been purchasing the DALBAR report in droves. The sample version of the 2013 report2 begins with an introduction titled “The Disease of Investor Underperformance.” In the lower-right corner of every page of the sample version is an entry that says “Compliments from Advisor Name.” In other words, “Your name, Ms. or Mr. Advisor, could go here if you purchase from DALBAR the right to distribute the report to your clients and prospects.” For $1,000, advisors can buy the right to make unlimited copies for their financial advisory clients and prospects. That $1,000 is well worth it because this report will show people how badly they’ll do if they don’t have “expert” help.
There’s just one thing: the DALBAR result is wrong.
First, let’s consider: If some group of investors underper-forms the market, then there must be another group that out-performs the market. That’s simply logical, because between them all investors are the market. So to make things add up, if some investors—say, the individual investors who are the main subject of the DALBAR study—systematically underperform the market, then there must be some other group that systematically outperforms the market. The trouble is, there is no evidence of any such group. One would think that if individual investors underperform the market, then it must be professional investors who outperform the market.
But they don’t. Study after study after study, as we’ve pointed out, shows that professional investors do not, on average and in aggregate, outperform the market. So it simply can’t be true that individual investors as a group systematically underperform the market.
So why does the DALBAR study seem to show that they do? It’s because of their methodology, and the way they calculate investor performance.
A Simple Explanation for DALBAR’s Misleading Results
We’ll first explain the problem in simple terms for those who don’t care to get into the technical details. Then we’ll explain more technically for those who do want to get into it.
DALBAR measures investor returns in one way and measures mutual fund returns in another way. The measure of investor returns is meant to take into account the timing of their cash flows, while the measure of mutual fund returns doesn’t.
From 1982 to 2000, the stock market rose enormously; whereas after 2000, it flagged until recently. But over that whole time period investors—especially baby boomers—were in an accumulation phase. Therefore, they had more money in their accounts in the 2000s when their stock investments performed poorly than they had in the 1980s and 1990s when they performed very well. Hence, they lost more in actual dollars in the 2000s than they had gained in the roaring 1990s and 1980s.
DALBAR interprets this experience as terrible timing. Yes, the timing was unfortunate, but it wasn’t because investors called turns in the market wrong, consistently buying at market highs and selling at market lows as interpreters of the study claim. In fact, the financial planner Michael Kitces has pointed out that even the DALBAR study shows that if an investor had simply “invested a fixed amount in equity funds every year, the investor return would have been 3.17% a year for 20 years, compared to the actual investor return of 3.49% a year.”3 In other words, the average investor beat an investor who merely invested a fixed amount every year.
Kitces then asks, “Why isn’t that the headline?”
Why isn’t it, indeed? Because then the result wouldn’t appear to show how badly individual investors time their investments in mutual funds, and it wouldn’t show how much they need the help of financial advisors—and how much financial advisors need the DALBAR report. The bottom line is DALBAR’s messaging deceives the investor, who pays far too much for advice that does him no good, because the report’s incorrect conclusion convinced him that he needs it.
Furthermore, it can be very difficult to tell from the wording in the DALBAR report what its methodology is. One financial planner wrote, “I contacted DALBAR recently in an effort to confirm my understanding of the finer points of their calculations.”4 They didn’t respond. This is not atypical. Often, providers of financial research that serves as fuel for their clients’ sales pitches don’t want too-close scrutiny of their methodology.
Technical Explanation of the Flaw in the DALBAR Report
There are actually two ways to calculate the rate of return on investment: the “time-weighted” return and the “dollar-weighted” return. Time-weighted returns are returns over a specific time period if you made no contributions or withdrawals from that investment. Dollar-weighted returns account for the amounts you added or withdrew from the investments, as well as the prices of any securities transactions during the time period. Obviously, the values of these two sorts of returns can be very different from each other.
Ever since a 1968 study titled “Measuring the Investment Performance of Pension Funds for the Purpose of Inter-fund Comparison” by the Bank Administration Institute (BAI), the principal method used to measure and compare the investment performance of managed funds like mutual funds has been the time-weighted rate. The time-weighted rate isn’t affected by how much cash goes into or out of the fund. How much cash came into or out of the fund isn’t under the control of its investment managers. So the time-weighted rate of return is supposed to be a “pure” measure of the performance of the fund’s investment managers. If the fund’s investors happened to throw a lot of cash into the fund just before the market took a dip, and consequently they lost a lot on the dip, that was presumably not the fault of the investment manager. The manager has no control over how much money comes into the fund or goes out. Only investors do.
The other measure of rate of return, however—the dollar-weighted rate—does take account of when and how much cash came in and out of the fund. If a big wad of cash came in just before a market dip, the dollar-weighted return would be worse than the time-weighted rate.
Let’s take a simplified example. Suppose a mutual fund goes up 100% one year and drops 50% the next (Figure 4a). An investor invests a dollar, which doubles (increases by 100%) to $2 in the first year, but then drops by half (-50%) in the second back to $1. Hence, the rate of return is 0%.
Now let’s suppose the investor invests a dollar each year (Figure 4b). The first dollar doubles to $2 in the first year. Then $1 is added to it to make $3, but the $3 is cut in half by the -50% return in the second year to end with $1.50.
In Figure 4b, the mutual fund’s rate of return is still 0% because it went up 100% in the first year and then down 50% in the second. But the investor’s return is different. The investor invested $2, one each year, but wound up with only $1.50.
Figure 4A Time-Weighted Rate of Return and Dollar-Weighted Rate of Return
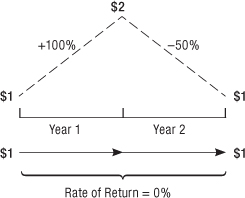
Figure 4B Time-Weighted Rate of Return and Dollar-Weighted Rate of Return
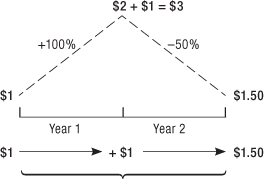
The return the investor realized—the dollar-weighted rate of return—was a compounded annual average of -17.7%. The investor underperformed the mutual fund, whose return was 0%, by 17.7%.5
Did the investor time the market terribly? It may have turned out that way, but not because the investor was trying to time the market. The investor was merely routinely investing a dollar a year.
Why the Dollar-Weighted Rate Has Been Worse for Investors
If the dollar-weighted rate was worse for investors in mutual funds than the time-weighted rates achieved by the funds’ managers, DALBAR concludes it was because of poor investor decisions. But that’s not what caused it. The stock market performed very well during the 1980s and 1990s, when baby boomers and others were beginning to save. But it performed poorly in the 2000s, when their cash inflows were really accumulating.
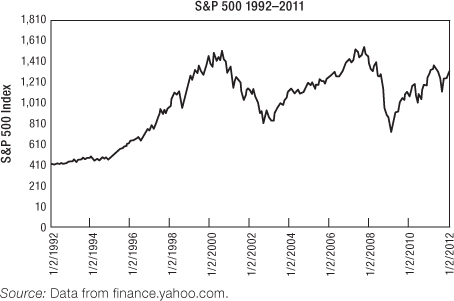
The 2012 DALBAR report6 says, “The average equity investor underperformed the S&P 500 by 4.32% for the past 20 years on an annualized basis.” Now look at Figure 5, which shows the performance of the Standard & Poor’s 500 index, a broad measure of the U.S. stock market, for that 20-year period. It zoomed up for almost the first half, then fluctuated but went down overall in the second half.
That’s why investors’ “timing was poor”: because the timing of their pattern of saving, which they really couldn’t help, resulted in by far the most being invested during the period, the 2000s, when investment performance was worst.
FIGURE 5 Time Period over Which Investors “Underperformed”
SUMMARY OF DEADLY TEMPTATION #2
1. With conservative assumptions and all else being equal over 30 years, a 1% of assets annual fee will cost an investor a third of future real investment gains, a 2% fee will cost 60%, and a 2.5% fee will cost 70%. No global or major country market disaster has ever lost investors any of these percentages over the same time period.
2. The widely cited result that individual investors in mutual funds underperform by several percent a year because they time the market irrationally and poorly is wrong.