DEADLY TEMPTATION #7
Use Modern Scientific Financial Theory
This is often the deadliest of temptations—and one of the most brazen. Science encompasses an array of serious, well-developed fields such as physics, chemistry, and biology. Modern finance bears no resemblance to any of them. To apply the term “science” to the field of modern finance is to taint all sciences. Both science and engineering use mathematics in practical and sound ways. The mathematics used in these fields is both much more sophisticated and more practical than the mathematics used in the investment field.
Let’s explore some of the ways investment products and services sold by Wall Street and the financial industry use—or pretend to use—mathematics and “modern scientific financial theory.”
THE PERFORMANCE OF DISCIPLINED QUANTITATIVE INVESTMENT STRATEGIES
You may sometimes hear about “quantitative investment strategies” and wonder whether an approach that’s disciplined by mathematics and computer programs will add value. It sounds right, of course—you’d rather have a surgeon who went to medical school and learned about human anatomy and knows how to use the latest medical technology than one who doesn’t.
But remember that the general rule in the investment profession is totally counterintuitive: expertise doesn’t help; professionalism doesn’t help; sophistication doesn’t help; and, in fact, technology, in general, doesn’t help. That is, at least they don’t help you to “beat the market,” if that’s your goal.
The use of quantitative investment strategies is no exception to that rule. One problem is that this term isn’t clear. What, exactly, are “quantitative investment strategies”? Well, here’s one definition, offered in a study by the consulting firm Greenwich Associates that was commissioned by the large investment management firm BlackRock:
The term “quantitative strategies” is a general label applied to a broad and dynamic set of approaches that apply rigorous and systematic analysis to investing. Quantitative investors use multiple sources of information to design consistently applied investment processes to manage portfolios with typically greater breadth than fundamental strategies. Many quantitative managers’ approaches are differentiated from so-called “black box” strategies by the fact that investment teams have the ability to intervene to allocate risk dynamically if market conditions call for it, as opposed to implementing purely model-driven processes.1
Huh? A bunch of gobbledygook, no? But this is what you’ll typically get in write-ups that describe “sophisticated” investment approaches. For some reason, it’s assumed that if you don’t understand the explanation, you’ll think it’s sophisticated.
Some people still insist that a computer program will help them maintain some investing discipline and keep them from just following the herd. Wall Street Journal reporter Eleanor Laise squashed that notion in a 2010 article on the disappointing performance of quantitative funds, which were now trying to—guess what?—become less “quant” and more human:
Computer-driven mutual funds, chastened by a string of poor results and a wave of redemptions, are striving to bring more of a human touch to their investment decisions.
These so-called quantitative funds, which rely largely on computer models to select investments, have been on the fritz for several years. A group of 65 such funds tracked by investment-research firm Morningstar Inc. lagged behind 72% of their category rivals, on average, in the three years ended Aug. 27.2
That’s a pretty bad record. How come they did so poorly, considering that (or so you would think) they were each pursuing a disciplined objective strategy instead of just following the herd like silly human beings? According to Laise, “It became painfully apparent in recent years that many quant funds were focusing on the same types of data to pick stocks. So as some of these portfolios began to stumble, they all suffered in unison.”
So what was their response? Become more like humans. “Many of the funds’ managers are seeking to make their models a little more like people,” writes Laise, “by making them more responsive to changing circumstances. That can mean revisiting computer models more often, tweaking their components, or incorporating measures of macroeconomic risk rather than just stock-specific information.” In other words, they’re trying to put back that subjective human element, which the whole mission of quant funds was to take out.
THE PERFORMANCE OF INDEX FUNDS BASED ON SPECIALIZED INDEXES
Another marketing pitch that has gathered steam recently is built around so-called smart beta strategies. The marketing has often been effective, causing many investors to buy into it. Those who market these strategies frequently imply that there’s a mathematical truth that proves that the strategy is superior. But like many such claims in the investment field, it’s merely pseudo-mathematics—there is no such truth. Let’s backtrack to get to the origin of this deception.
The Trend Toward Indexing
For now, only a minority of investors invest in index funds, though the number of individual and institutional investors doing so is growing because of the overwhelming evidence that index funds do consistently better than other funds after fees. While index funds are gaining an increasingly large following, many investors may not hear the explanation of why index funds are better—they just remember hearing that index funds are good. So, some marketers have tried to jump on the bandwagon by using the word “index” to help market new products—even if the products aren’t really like index funds, and have higher fees.
Before we get into this, we need to define some terms, including “value stocks,” “cap-weighted,” and “fundamental indexing.
Value Stocks
A value stock is a stock in a company whose stock price is low compared to its “book value,” which is, roughly speaking, the total of the company’s assets—its desks, its chairs, its buildings, its machinery, and so on—valued individually and added together.
Value stocks have historically performed better than expected. Some possible reasons have been conjectured for this. One is that value stocks have risks that aren’t captured well in MPT’s only measure of risk, variability—which, as we’ve pointed out before, is not a very good measure of risk. Another reason that has been advanced is that people are irrational. As the hypothesis goes, they don’t understand that if the price of a stock is depressed, that means it’s a good buy, not a bad buy.
In any case, because of this observed tendency, a number of money managers have announced themselves “value” managers—that is, they prefer to buy value stocks and think they will outperform a market index that way. The results, as with any investment strategy, have been mixed; but in a way, this approach might be as good as any other investment strategy—except for the fact that managers of this strategy have less diversified portfolios and charge more than actual index funds.
Cap-Weighted Indexes
“Cap-weighted” is short for “capitalization-weighted.” The capitalization of a stock—or of the company that issues it—is the price per share multiplied by the number of shares outstanding. In other words, it is the total market value of the company if its shares could be sold all at once at the current market price. The total market value of all stocks together is the sum of their capitalizations. Hence, the whole market is “capitalization-weighted” or “cap-weighted.” A cap-weighted index fund mirrors the whole market—that is, it’s a microcosm of the market. It will perform exactly the same as the market as a whole does. Most market indexes, like the Standard & Poor’s 500, are cap-weighted. (“Market-weighted” is another term sometimes used to mean “cap-weighted.”)
Other weightings are possible. For example, an equal-weighted index holds one share of each company—or perhaps an equal dollar amount of each company. As a result, in an equal-weighted index, small companies will be weighted about the same as large companies. Therefore, a small company will be a much larger proportion of an equal-weighted index than of a cap-weighted index. Hence, an equal-weighted index has a bias toward small companies, as compared to the market as a whole.
Only a cap-weighted index mirrors the whole market—it’s the only one that everyone could own at once. And a cap-weighted index adjusts automatically to keep on mirroring the market even as stock prices change. These are the reasons why it’s the type of index used for most index funds.
Fundamental Indexing
Someone came up with the term “fundamental indexing” to mean a way of automating the picking of stocks by eliminating the “expert” and using a simple algorithm instead. Fundamental indexing algorithmically “tilts” the portfolio, usually toward value stocks because value stocks have often performed better in the past.
But as those who really understand the stock market know, past performance does not predict future performance. So even though the value stock effect has been somewhat persistent as such effects go, there’s no guarantee it won’t disappear in the future—especially if a lot of people buy into it. The very fact that people have noticed that a particular strategy for stock picking has worked, often means that it will start not to work anymore.
A lot of people do know that the past good performance of value stocks is no guarantee they’ll do well in the future—especially people “sophisticated” enough in investments to know why index funds have a big advantage over other funds. A better argument was needed to convince people that fundamental indexing is really better. That scenario gave birth to mathematical-sounding arguments claiming that any index that is not cap-weighted, even if the weightings are picked at random, will perform better than a cap-weighted index. Some of these arguments actually managed to get published in prestigious academic finance journals—even though the arguments are complete nonsense, as we shall see.
The Problem of Pseudo-Mathematics in the Investment Field
You may wonder how it’s possible that papers published in prestigious journals and studies performed by prestigious institutions could claim to prove something mathematically that can’t be true; but then, you might not understand the investment industry and its academic arm. The mathematics in the finance field is not sophisticated, nor is most of it of any practical use. The mathematics used in other fields—for example, aerodynamics and hydrodynamics, and many other fields of engineering and science—is far, far more sophisticated and complex. Moreover, it is used very effectively for practical applications, like making an airplane fly.
Not so finance. Mathematics in financial journals is—contrary to the common lay belief and contrary to the common belief even within the finance field—usually of extremely poor quality and often wrong. Mathematicians have finally begun to direct their attention to this problem. Recently authors of a paper critical of the pseudo-mathematics in the investment field declared, “We would like to raise the question of whether mathematicians should continue to tolerate the proliferation of investment products that are misleadingly marketed as mathematically founded.”3
The idea that any randomly chosen portfolio must outperform a cap-weighted market index makes no sense. Here is why.
Suppose you randomly pick some stock weights for a portfolio. Call this portfolio A. Now consider an index fund portfolio that is much bigger than portfolio A. We’ll make the index fund big enough that the number of shares of each stock in it is greater than those in portfolio A. If you take portfolio A out of the index fund, let’s call what’s left portfolio B. The two parts of the index fund—portfolio A and portfolio B—can’t both outperform the index fund. If one outperforms it, the other must underperform it, because together they are the index fund. So the claim that any randomly weighted portfolio will outperform a cap-weighted market index is absurd.
The Cass Business School Study
Nevertheless, The Economist magazine reported that a study by a prestigious business school, the Cass Business School of City University London, somehow concluded “that a system that randomly chose constituent weights for stocks, like chimpanzees throwing darts at share-price listings, beat the market.”4 The eyebrow-raising part of this—apart from the fact that the conclusion is impossible—is the phrase “randomly chose constituent weights.” There are lots of ways to randomly choose constituent weights. So we got the study to see how they did it.
The Cass study limited itself to 1,000 stocks. It constructed a cap-weighted index of those stocks and computed its performance over the time period it studied. Then it set about defining a random-choice mechanism for randomly chosen portfolios. Here’s how they did it.
Imagine that the 1,000 stocks were 1,000 numbered balls in an urn. They picked balls out of the urn (i.e., stocks), one at a time, to create a “randomly chosen” portfolio. But each time they picked, they put the ball back, so it could get chosen again. They chose 1,000 shares this way.
But if they chose portfolios like that again and again and added them all together, they’d get a big portfolio with all the weightings the same. So their “randomly weighted” portfolios were constructed so that, in aggregate, they were an equal-weighted index. In other words, their randomly generated portfolios held more dollars in small stocks than the market as a whole.
It so happened that small stocks performed better than large stocks after the 1990s. That period was weighted heavily in the Cass study. (In the 1990s, small stocks performed worse than large stocks.) So the Cass results weren’t—as they seemed to be—a general mathematical statement about the inferiority of cap-weighted indexes. They were only about how small stocks performed in the historical period they studied.
But the marketers of “fundamental indexing” were gleeful. Their false claim that there’s some sort of mathematical reason why any non-market-cap-weighted index at all will outperform a cap-weighted index seemed to be validated—and in a respected and widely read publication.
INVESTING SCIENTIFICALLY USING THE 3- (OR 4-, OR 18-) FACTOR MODEL
The idea of factor models has somehow captured much of the part of the investment world that likes to believe it engages in “scientific” investing. The online dictionary Investopedia.com defines “factor models” this way:
Multi-factor models are used to construct portfolios with certain characteristics, such as risk, or to track indexes. When constructing a multi-factor model, it is difficult to decide how many and which factors to include. One example, the Fama and French model [named after finance academicians Eugene Fama and Ken French], has three factors: size of firms, book-to-market values and excess return on the market. Also, models will be judged on historical numbers, which might not accurately predict future values.5
Fama and French’s papers are exercises in running “regressions.” Regression analysis is by far the most frequently used—and overused—mathematical modeling technique in social science.
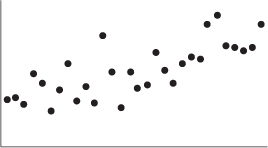
Regression is often explained to students in about the second year of high school—at least it was in our high school. There, it was called “least-squares fit.” You have data points that graph something like this (Figure 8a):
FIGURE 8A Plot of Points on an x-y Graph
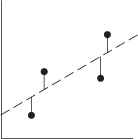
You try drawing a straight line through them and measure its distance from each point, like this (Figure 8b):
FIGURE 8B Regression Analysis (Least-Squares Fit)
With a little math, you can find the line that minimizes the sum of the squares of those distances. This gives you the so-called least-squares fit (Figure 8c):
FIGURE 8C Least-Squares Fit Line (Regression Line)
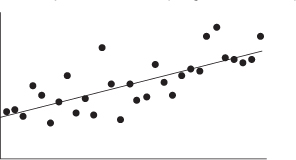
This is also called “running a regression.” The line is called the “regression line.”
Let’s see how running a regression applies to investing. Imagine, for example, that the variable on the horizontal axis is the rate of return on the whole stock market in any given month, and the vertical axis is the rate of return on a particular stock portfolio. Then the regression line is supposed to be the underlying relationship between the rate of return on the portfolio and the rate of return on the market. The slope of the line is called the portfolio’s “beta.” The distances of the points from the line are the random portfolio-specific variations. The place where the line hits the vertical axis is the portfolio’s “alpha,” or risk-adjusted performance.
You could visualize these points in three dimensions instead. Imagine points in three-dimensional space with a plane drawn through them so as to minimize the sum of the squares of the distances of the points from the plane. Then the plane would express a linear dependence of one of the variables on the other two. Those two are called “factors.” The same thing can be done in higher dimensions with more variables, but you can’t visualize it.
The Fama-French Studies
In the simple example in Figures 8a-8c, portfolio returns were regressed against just one variable, the return on the market as a whole. This is the Capital Asset Pricing Model (CAPM), which was William F. Sharpe’s contribution to modern portfolio theory. Sharpe’s model says you get a higher expected return if you take more market-related risk (i.e., if you have a higher beta).
In two studies in 1992 and 1993, Fama and French ran regressions of stock portfolio rates of return against not just one but three variables: returns on the market as a whole, returns on “value” stocks (those with a low ratio of market price to book value), and returns on “small” stocks (those with low capitalizations). Their regressions concluded that historically just two factors—value stock returns and small stock returns—explained most variation in portfolio returns. This observation tended to imply that the more your portfolio varied like a value stock portfolio (or the more it was a value stock portfolio) and the more it varied like a small stock portfolio (or the more it was a small stock portfolio), the better its returns would be.
It should be noted that Fama and French ended both papers with similar caveats, saying in the 1992 paper, “Our results …are not economically satisfying.” They continue, “What is the economic explanation for the roles of size and book-to-market equity in average returns?”6 In other words, they have no explanation for why they should have found these dependencies in the data when they ran their regressions.
Nonetheless, though lacking a good explanation for why these results occurred, most of the finance profession concluded—though without adequate justification, as Fama and French themselves noted—that value stocks and small stocks not only outperformed the market in the past but will do so in the future, too.
Fama and French updated their work in a more recent paper, “Size, Value, and Momentum in International Stock Returns,” published in 2011.7 This paper, disappointingly, still does not attempt to explain the reasons that there should be a dependence of the returns of any stock on its degree of “small-ness” and/or “value-ness.” Instead, it is a continuation of the exercise of running regressions.
The authors did add a factor that does not appear in their earlier papers: the momentum factor. This addition is due to the relatively recent observation—noted in Deadly Temptation #1—that stocks have tended to perform better in the subsequent month or year if their previous month’s or year’s return outperformed the market. Fama and French’s data indicated evidence of the momentum effect (except in Japan)—as it has been found in other studies. Adding momentum as a fourth factor creates a better fit to returns in some regions, they say. The upshot of the 2011 study is a hash of conclusions and nonconclu-sions. Because so many countries and factors are tried, some produce what are apparently significant results, while others do not.
In Fama and French’s papers, the coauthors assume a scientific posture of objectivity—not even trying to interpret or explain their results. One reason, of course, would be that they can’t explain them. Another is that any explanation would be sheer speculation and therefore doesn’t belong in a scientific paper—another way of saying they don’t have a good explanation.
There’s nothing wrong with presenting results without explaining them, and leaving it to others to try to explain them. That’s the idea of seminal research; if your findings provoke discussion and efforts to interpret them, eventually leading to a new and improved theory, that’s great. (Fama, in fact, during the writing of this book, received the Nobel Prize for a different, more important seminal paper he wrote 50 years ago on the “efficient market hypothesis.”)
Regression formulas alone, however, are not a theory. They are merely patterns perceived in data—barren of explanation, and possibly accidents of randomness. Unfortunately, however, the results of these regressions are being treated as if they were a theory in and of themselves. This is not Fama and French’s fault—they said they don’t have an economic explanation for the results. But it’s the way their results are being treated, as if they were a theory and not just the unexplained results of regressions.
Lacking a theory, these results have no lasting or practical implications. Without an explanation for them, there is no reason why results mined from historical investment data can predict the future and thus identify a market-beating strategy.
The Goldman 18-Factor Model
Nonetheless, a good sales pitch is not to be sneezed at, especially if it involves representing how sophisticated and scientific the pitch person’s company is. And, of course, Goldman Sachs has to be as sophisticated and scientific as any. Thus, it came as no surprise to us to hear from an insider at Goldman Sachs that they use an “18-factor model” in their investment strategy.
You need to know something about Goldman’s investment performance—that is, the performance of their clients’ investments. A 2011 article describes how badly clients have done when they invested with Goldman:
A big chunk of GSAM’s [Goldman Sachs Asset Management’s] assets are its separate accounts—pools of money invested for institutions and wealthy individuals. EVestment Alliance LLC, an Atlanta-based research firm, tracks about $300 billion held in the accounts and finds that Goldman trailed its peers in 73.8 percent of the categories EVestment looked at during the five years ended on Sept. 30.
Chicago-based financial publisher Morningstar Inc. tracks Goldman mutual funds and found that the 338 fund share classes it looks at trailed the average return of their respective peers in every broad category, including U.S. diversified equity, non-U.S. stock and taxable bonds, over the 3-, 5- and 10-year periods ended on Dec. 31.8
It should be noted that Morningstar’s finding that Goldman mutual funds trail their “respective peers” means that their performance is way, way behind low-cost index funds, which generally beat about 80% or more of their peers.9
Yet, as this article notes, the “scientific” sales pitch—and the big financial industry brand name of Goldman—still draws investors who either don’t know or don’t care about this poor performance record.
SMALL STOCKS’ PERFORMANCE
In 1981, an academician named Rolf Banz published an article on small-stock returns over the years 1936-1975 in the Journal of Financial Economics. Banz’s paper showed that small stocks not only outperformed large stocks, but outperformed them on a risk-adjusted basis, too—they had a positive “alpha.” But after Banz studied them, the small stock effect—the small stock alpha—largely disappeared. Small stocks still often did better on the whole, but not on a risk-adjusted basis.
Much later, researchers Gary Miller and Scott MacKillop decided to do a quick regression on historical small stock returns.10 They found what other people had found: that they didn’t exhibit much in the way of alpha, if any, during the years after Banz’s study.
This really shouldn’t be surprising. If some particular stock, or group of stocks, gets much more popular—often because of its past performance—people who want to buy it drive the price up. When the price of a stock is driven up, its future rate of return won’t be as good as it was before its price was driven up.
Miller and MacKillop then decided, just for the heck of it, to run their regression on Banz’s original data. They found no alpha. They were nonplussed. Why was there no alpha when Banz got an alpha?
We can answer that because we replicated their study.11 They used a different kind of rate of return in their study. But it’s the rate of return you should use.
Rates of return can be very confusing. For example, mortgage lenders have to state a loan’s annual percentage rate (APR). That rate is calculated by taking the monthly interest rate and multiplying by 12 months.
The one-month period is arbitrary. You could just as well take the weekly rate and multiply by 52, or the hourly rate and multiply by 8,760, or the secondly rate and multiply by 31,536,000. If you keep time splitting, you eventually converge to the “continuously compounded rate” of return (CCR).
Let’s call the ordinary monthly rate the “holding period return” or HPR. By saying that the HPR is “the ordinary monthly rate,” we mean, for example, that if you start the month with $100 and don’t add anything and at the end of the month you have $101, then your HPR is 1%. By contrast, the CCR is 1.005%. The HPR and the CCR are slightly different. But there’s one attribute the CCR has that the HPR doesn’t have. It is “symmetric.” The chance that its value is -20% is about the same as the chance that its value is +20%. That’s not true of the HPR. The HPR is skewed—it’s significantly more likely it will be +20% than -20%.
Banz and virtually every other user of regression analysis in finance used the HPR. The researchers who backtracked his data (and we, when we replicated their work) used the CCR.
Which is better? They’re both rates of return. One is equivalent to the other, in the sense that one can easily be converted to the other. But for regression analysis—particularly to test whether the alpha you found was significant or not—statisticians consider it better to use the number that is symmetric: the CCR.
An arcane niche of mathematical statistics investigates such matters in depth, but we needn’t delve into it here. It is, however, generally assumed by those who apply regressions in fields of science and engineering that if the distributions are substantially skewed—that is, not symmetric—then the results may not be dependable. (Strictly speaking, the distributions should be normal—also called Gaussian—in order to apply significance-test statistics like the t-statistic.)
Well, it turns out that the HPR used in regressions often gives you a positive alpha when the CCR doesn’t, especially when the “dependent variable”—small stock returns, in our case—is particularly volatile. So the more the returns on some subgroup of stocks vary, the more likely it is that using the HPR will show they have alpha.
This discussion shouldn’t give you a lot of confidence in the statistical results obtained by financial researchers. The mathematical methods used in their research don’t satisfy the mathematician’s definition of “rigor.” Financial researchers frequently don’t define clearly what they mean by a particular variable or symbol in their mathematics, and they don’t check out adequately whether the assumptions of the methods they’re using are satisfied or not. They would be offended by what we’re saying, because they think they’re being rigorous—but they’re not.
We could write far more about what’s wrong with the use of mathematics in the investment industry and its claims to “science.” We haven’t even covered the mathematical models that failed dismally in the financial crisis of 2007-2009, or many other failures of mathematical models in finance.
Our bottom-line recommendation remains the same: when you hear claims that sophisticated mathematics or science is being used in the investment field, tune the noise out.
SUMMARY OF DEADLY TEMPTATION #7
1. The mathematics in the finance field is not sophisticated compared with most fields of science or technology; it is often full of holes or flat-out wrong, and most of it isn’t even of any practical use.
2. Investment strategies with mathematical-sounding names like “quantitative strategies,” “smart beta,” and “four-factor model”—like other investment strategies that are not quantitative—don’t produce superior investment performance, except by chance.