Combining the design rules and patterns from Chapter 3, Building the Core – Enterprise Business Flows, Chapter 4, From Traditional Integration to Composition – Enterprise Business Services, and Chapter 5, Maintaining the Core – the Service Repository, and from this one, we can assume the following:
- The Service Repository with all the service metadata elements is properly maintained. We have clear associations between services, endpoints, and Audit messages under the roof of processes. Simply put, every process has a distinct service invocations footprint. Technically, it can be presented as a master
tModelfor a task-orchestrated service if we look at the UDDI analogy.Tip
The preceding assumption is too bold. In dynamic compositions, the sequence of service invocations and even the number of invocations (that is, footprint) can be different for the same abstractly defined process. The key here is to watch out for the services with specific service roles, sometimes ignoring low-level composition members.
- Auditing a sequence is strictly observed, which means that we can always find records in logs according to the declared design rules. Simply put, we can always reconstruct the process path from the logs in the exact way as we see it in the Oracle SCA Enterprise Management Console (instances).
- Every service (Entity or Task) is clearly documented in ESR in terms of execution policy, performance, and consumed resources. Generally, from practical tests and business requirements, we should know that an end-to-end time of 700 ms for this service is acceptable, but 1200 ms is not.
- Our unified composition descriptors (EPs and routing slips) are redundantly implemented by ESR and FSO/NAS. They are critical for any type of composition controllers (dynamic or static), and redundant implementation of this part in not expensive if we decide to keep the XML EP definitions as files in parallel with DB storage (which is SAN/RAC-based).
- In Chapter 4, From Traditional Integration to Composition–Enterprise Business Services, in the A simplified Message Broker implementation section, we learned that the design and deployment of a simple service broker for most of our compositions (and definitely for all compensative compositions as well) is absolutely achievable outside of OFM.
- Our log monitoring tools (Oracle BAM, Nagios, and so on) can control individual service runtime metrics and task service footprints in general. BAM connectors are explained in the next chapter.
- Obviously, we have our original message logged (orange step 1; refer to the figure from the Maintaining Exception Discoverability section), as well as optionally, the message with header and tracing records at the moment our composite application crashes.
Tip
Why is the crash record with message payload optional? Because we simply cannot count on it. If we can, then the first and second lines of defense discussed previously will be more than enough. However, how many times in complex compositions do messages just disappear without trace? At best, you can only have a record indicating that a response was sent from the composition member that never reached the destination. This is exactly the situation we are discussing here, and our primary goal is to keep the business running and buy some time for Ops to find the root cause.
Regarding the last position, proactive monitoring and fault prevention generally means that you collect and analyze technical and business data for an extended period of time and analyze them against different thresholds, which are specific to individual processes at the time of execution. You already have a comprehensive list of WLS/SOA MBean attributes to monitor. After completing your homework (sorry, we do not have enough space here to explain the meaning of every attribute), you will learn that, for instance, Hogging Thread Count indicates we have some threads that take too much time; we can assume that they will never be returned (send an alert when you have more than 10 of these). What should you do? Increase the thread pool, maybe? Yes, it might help, but only a little and for a short period of time. If you start getting this error after deploying a new composite, most probably we will have an indication stating that it is poorly designed and not misconfigured.
Therefore, technical monitoring must be combined with functional monitoring to select a proper action; bare minimum policies should be as follows:
- Every abstract process must be monitored according to the SLA of the total execution time. That's it! From start to stop (from the composition's initiation until its delivery to the ultimate receiver), we must have two minutes (set your number here), not more. Simple isn't it? Yes, if you assure that start/stop indications are clearly provided to Audit (Canonical Expressions in logging) and that the execution time can vary, depending on business hours. Let your developers wonder about record subjects and log consolidation, and data cleansing will not be so simple.
- Monitor the process footprint as a collection of individual invocations according to the composition member's records in Service Repository. Obviously, there should be no misses in the process log, and all entries and exits of individual services must be according to the SLA.
- The last and obvious thing is that we should have no Error or Exception clauses in the process log.
Frankly, if all conditions for technical and functional logging are met, all business compositions with related compensation logic are recorded in SR. The standard Oracle BAM will perform monitoring gracefully, so triggering the recovery action is just a matter of passing the initial message to any composition controller, with a new composition plan as a parameter (this can be a dynamic EP, static BPEL/SCA, standalone PL/SQL, or a Java function—whatever you can fire using IoC or NDS).
Some more side notes. Why should we consider an external simple Service Broker (or message broker) for ART if we can follow the Redundant Implementation SOA pattern for the entire OFM stack?
Well, it is always interesting to see how top management's opinion changes about absolute necessity for the business to have HA with 99.95% availability (4,38 hours downtime per year), when you explain in figures that moving to this presents from 95% (18 days) will double the investments into infrastructure (and quite often more than double). Most importantly, the Redundant Implementation pattern prevents you from HW malfunctions, not from OFM misconfigurations (one of the top OWASP risks from the previous chapter), poorly designed service, or a single illogical business rule.
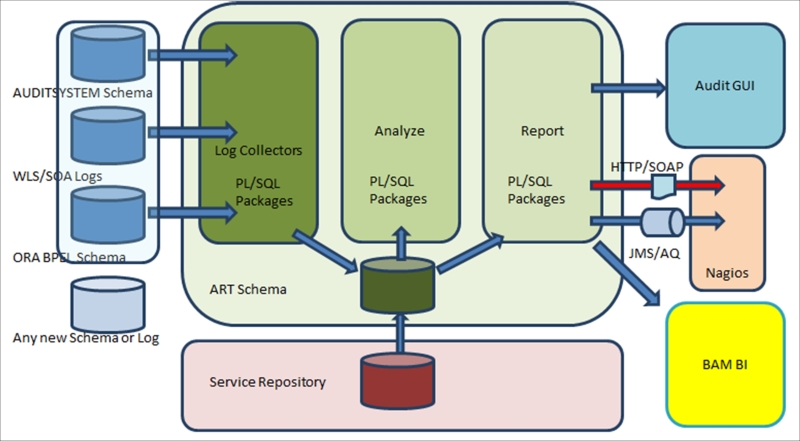
Combining all the preceding factors, the basis for ART can be presented as a simplified block diagram (refer to the next figure) with three generic parts:
- Log Collectors (deep green) are part of the adapter framework with individual adapters for your custom logs, WSL/SOA Infra logs, and BPEL schema in particular. With every new source added, you have to implement a new adapter. Most of these adapters already exist in OFM, so the trick here is to consolidate your own formats that exist in OFM. This is not always straightforward; BPEL logs have two records (entry and exit) for SCA components, where you could have one record with two related columns in your logs.
- The granularity of the records depends on the Trace/Audit level you have in your system. The completeness of your data is the key factor to lend precision to your analysis. A bit of data cleansing is sometimes required before analysis; with this, you update and enhance incomplete records such as assuming a component's exit time as the entry time of the next component in the invocation chain. The complexity of this process can be quite high, depending on the complexity of your compositions. A rule engine (custom, Oracle, or any other) is employed for making decisions based on functional policies and SLA metrics that are stored in ESR.
- The final results are delivered into the last component, usually a Report schema with a clean log that contains conclusions and resolution suggestions. This data is consumed by any dashboards, consoles, and reporting tools, both standard and custom. This is also the source for a dedicated process that will be responsible for performing complex recovery actions and compensations. The simple implementation can be the Adapter (on SCA, the BPEL or Mediator will do) checking for the resolution flag and the name of the process/composition to execute. A Java process reading AQ will increase the resiliency as it will comply with design rules 9 and 15. Needless to say that most of the operations in the technical and functional monitoring described in the preceding bullet list shall be performed on the DB side to make it more simple, fast, and resilient (less components involved); Oracle DB works perfectly well with AQs and is the top choice for BAM and Oracle BI.