
Applications using measured values of the transport properties of concrete – III: predicting the transport of liquids through concrete barriers for waste containment
Abstract:
This chapter describes measurements of the transport of liquids through concrete barriers for waste containment. A computer model (which is described in Chapter 2) was used and the results were used to relate laboratory observations with site trials. Confidence limits for the results were obtained by running the model with successive data sets representing extreme values of the input data. The observed results from the site trials generally fell within the expected limits but there were some notable exceptions. It was concluded that transport modelling of real landfills is not an exact science.
Key words
landfill; leachate migration; cementitious barriers; diffusion permeability; site trials
15.1 Introduction
15.1.1 The concrete waste containment barrier
Concrete barriers were designed as alternatives to conventional systems used as landfill liners such as bentonite enhanced sand and high density polyethylene (HDPE) membranes. The concretes were made from mineral wastes and were expected to be cheaper and more effective than current systems.
Interest in concrete as a barrier for lining landfills has arose for the following reasons:
• Current liner technology based on HDPE membranes and bentonite-enhanced sand is expensive and its production and installation involves a high environmental impact.
• HDPE membranes are easily damaged after installation. A concrete barrier provides a relatively hard concrete surface to permit operation of vehicles and to prevent damage from large items of waste compacted onto it and is also relatively resistant to damage from fires.
• The concretes which are used for these barriers are made from waste materials which would otherwise go into landfills.
A landfill liner (barrier) should be physically strong enough to allow vehicular access during the operational phase, and provide adequate containment of leachate during the post-closure period. In order to satisfy both these operational and long-term requirements, a range of composite barrier materials were evaluated. These included: low cost, chemically conditioning, cementitious media (such as concretes containing metallurgical slags, spent foundry sands and/or demolition waste as an aggregate, blended cements containing waste materials such as fly ash, cement kiln dust and slag) and non-swelling clays.
The properties of an ideal barrier system are:
• low permeability – less than 10−9 ms−1;
• high cation exchange capacity;
• the ability to chemically condition leachate through sacrificial action;
• construction from inexpensive materials;
• tolerance of deformation during service without barrier failure through brittle cracking;
• the ability to promote self-sealing of cracks;
• sufficient strength to support a refuse vehicle during operation – a cube strength of 5 N/mm2 is adequate.
15.1.2 The alkaline barrier
During the 1980s, a very large research programme was carried out in the UK to develop designs for repositories for nuclear waste (see Chapter 14). The design which was developed to the greatest extent was the repository for intermediate and low level waste. This repository was required to have a predictable performance in a deep saturated geological environment over a timescale of up to a million years. The design essentially involved placing the waste in concrete containers and placing these containers in an excavated underground cavern. This cavern was then to be backfilled with a relatively soft cementitious grout (Claisse, 1989).
One of the achievements of the nuclear programme was to analyse and define the performance which was actually required of the concrete when used for this application. This performance requirement is quite different from the requirements for concrete in normal construction and led to the development of some very unusual concrete mixes.
The barrier design used conventional engineering materials, but its method of operation was far from conventional for an engineering structure because it is essentially sacrificial (Claisse and Unsworth, 1996). The main function of the barrier was to condition the chemistry of the repository to high pH by dissolving alkalis in the groundwater. The alkalis are free sodium, potassium and lime and, subsequently, the calcium silicate hydrate which forms the structure of the hardened cement. At the high pH values, the harmful species from the waste which are permeating through the barrier are adsorbed onto the cement matrix and immobilised. Clay-based liners were considered for the nuclear repository, but concrete was chosen as the best option for the UK. The nuclear programme was stalled in the 1990s by the refusal of planning permission for the test facility at Sellafield in Cumbria.
The novel concrete barrier concept for conventional landfills is based on the theory that the pollution of soils and watercourses by the release of leachate may be prevented by adoption of a composite barrier liner. This will not only chemically condition the waste, but is designed to be self-sealing through secondary mineralisation and will retain heavy metal ions through ion exchange, surface sorption, filtration and precipitation.
15.1.3 The three layer barrier concept
In the design considered in this book, three layers are envisaged such that the clay-based hydraulic barrier is sandwiched between two layers of cementitious materials (see Fig. 15.1). These concretes for the liner are made with a range of waste materials which would otherwise have to be disposed of in the landfill.
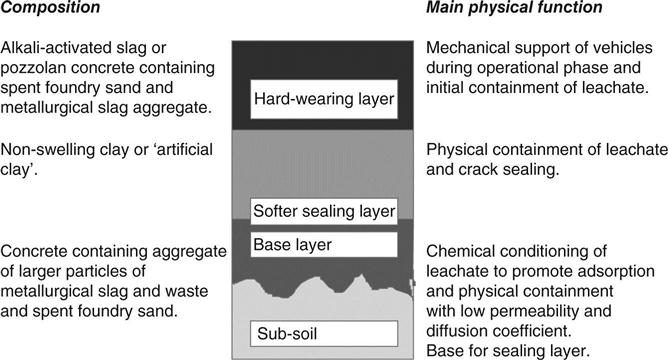
Each of the layers has different properties, so that any defects, such as cracks, are likely to form at different locations in different layers, thus limiting the creation of connected pathways through the barrier. The clay may be a natural material or, for some applications, the concept of an ‘artificial pourable clay’ made from a setting mix based on waste gypsum or ash has been developed.
15.1.4 Transport mechanisms
The degree of containment will depend on the transport properties of the barrier. The properties considered for modelling purposes are the permeability, diffusion coefficient and capacity factor. The capacity factor is used to give an approximation for the chemical containment and the diffusion coefficient measures ion transport, but the most significant property has been found to be the permeability which measures fluid transport (see Chapter 1). The permeability of concrete and mortar was measured in the high pressure cell described in Section 4.2.
For a nuclear waste repository in which a cementitious barrier is used, the main mechanism of loss of radionuclides is caused by flowing groundwater. This flow may be present in the area before the repository is built or it may be caused by the heat generated in the repository. In order to operate for a long time the chemical barrier depends on other barriers to limit the flow of groundwater through it. This is normally achieved by positioning the repository in a geology with a very low permeability. In this situation, the permeability of the repository itself can be shown not to have a significant effect on the flow of water through it. In the non-nuclear landfills which are considered in this chapter, the hydraulic head on the barrier is caused by standing leachate in the bottom of the cell. European guidelines require leachate extraction in order to limit this to a depth of 1 m above the liner but, in order to guarantee effective containment, a possible head of 10 m has been considered in the design.
15.1.5 Vertical barriers
In most current landfill designs, the sides of the cells slope, typically at 30° to the horizontal. This enables conventional machines to work and compact the mineral layers. In order to provide maximum deposition volume on restricted sites, a number of vertically sided cells have been built, but the technology for this has been very expensive. The proposed novel barrier system would be well suited to this application because the two concrete layers could be built as conventional concrete walls and then the pourable clay placed between them as the waste level rose to contain the resulting fluid pressures.
15.1.6 The research programme
The work reported here formed part of a major industry-based project on a novel composite barrier system, which used metallurgical waste materials for the cementitious liners in the landfill barriers. This work included carrying out three large-scale site trials to demonstrate the construction of the system. The trials consisted of cells approximately 8 m wide, which were designed to contain leachate to a depth of 1 m.
Transport modelling was used to predict the performance of the barriers. The processes of advection, diffusion and adsorption were included in the model. Four elements were studied: sodium, potassium, calcium and sulphur. These elements are not generally of concern in the environment, but it was not possible to use toxic elements such as mercury because the work involved large quantities of leachate in field-scale trials.
15.2 The computer model
15.2.1 The basis of the model
A computer model was written to simulate the transport processes (the details are discussed in Chapter 2). This model was used both to obtain transport properties from the laboratory results and to predict the results from the site trials. In each application, the calculations are identical. The only differences are in the exact output given and the length of time that a run simulates. The model is based on physical transport processes (diffusion and advection) with linear adsorption and uses the following assumptions:
1. The transport processes which are considered here are advection and diffusion and they are limited by adsorption. These are discussed in Chapter 1.
2. The following mechanisms are assumed not to be significant: thermal migration, electromigration, osmosis, electro-osmosis, capillary suction.
3. The barrier is assumed to be saturated when the leachate first comes into contact with it.
4. The layers of the barrier are assumed to be homogeneous. In particular, ‘boulders’ are assumed not to form. These would be regions surrounded by impermeable layers of carbonates, chloroaluminates or magnesium compounds which do not contribute to the transport or adsorption.
5. The properties of the barrier are assumed not to change with time or the amount of transport that has taken place through it, other than the gain or loss of ions due to the transport processes.
6. The adsorption processes are assumed to reach equilibrium within each time step.
15.2.2 Treatment of tolerances
The input data for the modelling of the full-scale barriers (e.g. layer thickness) is assumed to be normally distributed. For the purpose of modelling, it is divided into three outcomes, an expected outcome and one high and one low. Studying the normal probability function shows that to give each outcome equal probability the expected outcome must include all results within 0.43 standard deviations of the population mean. The means of the high and low outcomes have been calculated to be 1.1 standard deviations above and below the sample mean. The standard deviation has been estimated as a coefficient of variation V = standard deviation/mean. Thus three outcomes were modelled, and these are shown in Table 15.1.
Table 15.1
Probabilities for parameters with a linear distribution
| Outcome | Mean value | Probability |
| High | Sample mean × (1 + 1.1 V) | 0.33 |
| Expected Low | Sample mean | 0.33 |
| Low | Sample mean × (1 − 1.1 V) | 0.33 |
For the diffusion coefficient and the permeability, the treatment is slightly more complex in that the distribution of results form a highly skewed distribution when measured on a linear scale. On a logarithmic scale they are, however, more normally distributed and the three different outcomes have therefore been obtained by dividing up the distribution of the log of the parameter. The three outcomes for this case are shown in Table 15.2 where V is the coefficient of variation of the sample on a logarithmic scale.
Table 15.2
Probabilities for parameters with a logarithmic distribution
| Outcome | Mean value | Probability |
| High | Sample mean(1 − 1.1 V) | 0.33 |
| Expected | Sample mean | 0.33 |
| Low | Sample mean(1 + 1.1 V) | 0.33 |
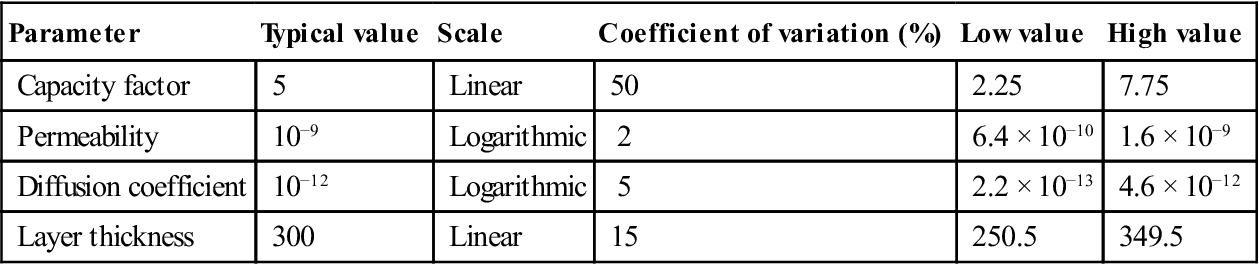
Typical values for the parameters are shown in Table 15.3. From this it may be seen that, although V for permeability appears low at 2 %, it represents a range of +60 % and −36 % on a linear scale. The 5 % for diffusion gives an increase of 460 % on a linear scale. Because the populations were skewed on a linear scale, the mean outcome from this analysis was not the outcome with the highest probability (as would be expected from a normal distribution).
Table 15.3
Typical values and ranges for the measured parameters
| Parameter | Typical value | Scale | Coefficient of variation (%) | Low value | High value |
| Capacity factor | 5 | Linear | 50 | 2.25 | 7.75 |
| Permeability | 10−9 | Logarithmic | 2 | 6.4 × 10⁻¹⁰ | 1.6 × 10⁻⁹ |
| Diffusion coefficient | 10−12 | Logarithmic | 5 | 2.2 × 10⁻¹³ | 4.6 × 10⁻¹² |
| Layer thickness | 300 | Linear | 15 | 250.5 | 349.5 |
Each of these outcomes was modelled for each input parameter for which there was significant uncertainty. Thus, for example, where four different input parameters had significant uncertainty, 81 simulations were carried out and the 10th and 90th percentiles of the resulting population were used to calculate the degree of uncertainty of the model predictions.
The coefficients of variation for the input data obtained in the laboratory work were obtained by studying several series of replicate samples and also analysing the optimisation of the data from the through diffusion tests.
Some variables, such as layer thickness in multilayer barriers, were in sets in which varying each one had a similar effect. Reducing the thickness of one layer by 20 mm will have a similar effect to reducing another layer. In these situations only the variation of one of the variables was modelled.
15.3 Laboratory testing
Tests were carried out on samples taken from the mixes at the time of the pours for the site trials.
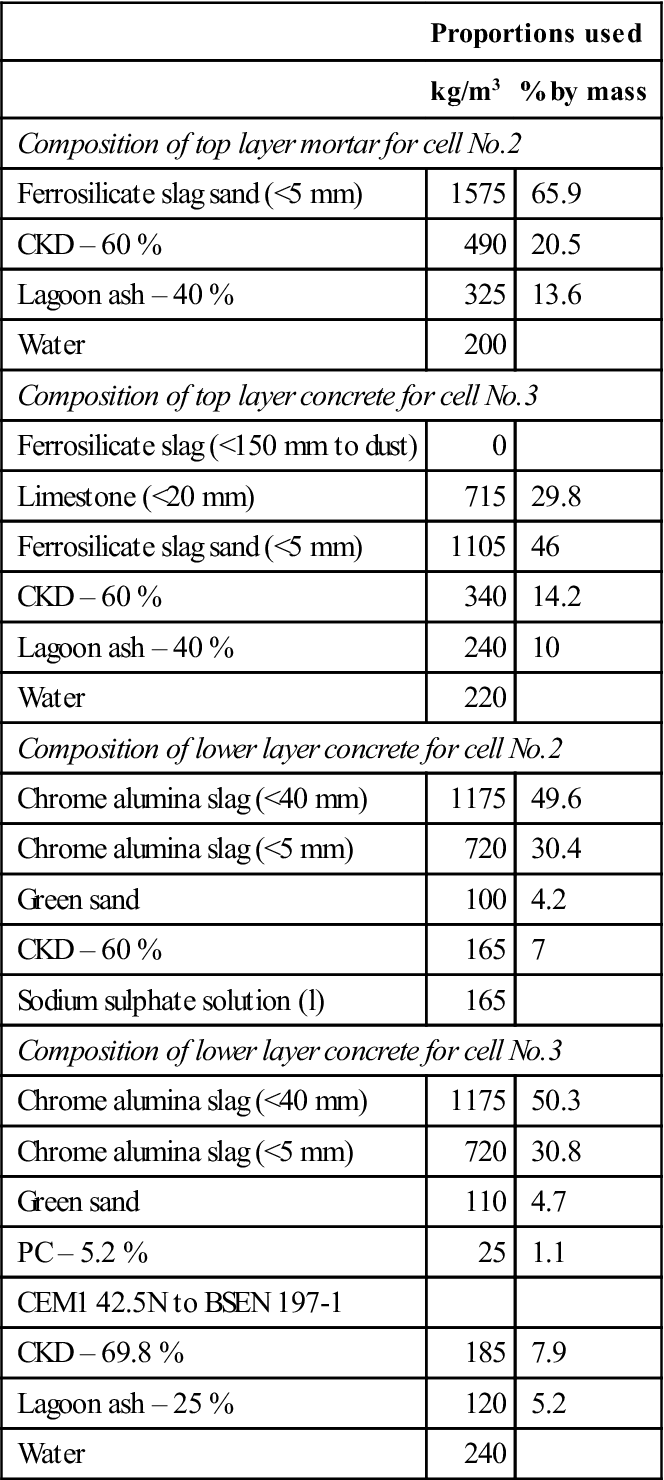
15.3.1 Mix designs
The mix designs are shown in Table 15.4. The designs were chosen to make use of available industrial wastes and give an adequate strength (5 MPa) and permeability (10−9 m/s) (Ganjian et al., 2004).
Table 15.4
Composition of mixes used in the three trial cells
| Proportions used | ||
| kg/m3 | % by mass | |
| Composition of top layer mortar for cell No.2 | ||
| Ferrosilicate slag sand (<5 mm) | 1575 | 65.9 |
| CKD – 60 % | 490 | 20.5 |
| Lagoon ash – 40 % | 325 | 13.6 |
| Water | 200 | |
| Composition of top layer concrete for cell No.3 | ||
| Ferrosilicate slag (<150 mm to dust) | 0 | |
| Limestone (<20 mm) | 715 | 29.8 |
| Ferrosilicate slag sand (<5 mm) | 1105 | 46 |
| CKD – 60 % | 340 | 14.2 |
| Lagoon ash – 40 % | 240 | 10 |
| Water | 220 | |
| Composition of lower layer concrete for cell No.2 | ||
| Chrome alumina slag (<40 mm) | 1175 | 49.6 |
| Chrome alumina slag (<5 mm) | 720 | 30.4 |
| Green sand | 100 | 4.2 |
| CKD – 60 % | 165 | 7 |
| Sodium sulphate solution (l) | 165 | |
| Composition of lower layer concrete for cell No.3 | ||
| Chrome alumina slag (<40 mm) | 1175 | 50.3 |
| Chrome alumina slag (<5 mm) | 720 | 30.8 |
| Green sand | 110 | 4.7 |
| PC – 5.2 % | 25 | 1.1 |
| CEM1 42.5N to BSEN 197-1 | ||
| CKD – 69.8 % | 185 | 7.9 |
| Lagoon ash – 25 % | 120 | 5.2 |
| Water | 240 | |
15.3.2 Diffusion tests
The diffusion cells were used to examine mass transport in reactive systems. An aggressive solution, simulating an acetogenic leachate typical of the early stages of landfill evolution (this is given in Table 9.1), was allowed to react with the sample, whilst concentration changes due both to diffusion and reactive transport were monitored in the cells.
This diffusion test was intended to measure both the diffusion coefficient and capacity factor of species partitioned between a solution and a porous sample. The basis of the test was a divided cell with the sample in the centre. Artificial leachate was placed on one side and deionised water on the other. Chemical analysis was used to track changes with time on each side.
The apparatus was a modified ASTM C1202 test (see Chapter 10). The C1202 test has an applied electric field and in this work the same cells were used without the field but with extra reservoirs on the top. Using an electric field would have accelerated the tests but made interpretation very uncertain.
Two symmetric poly methyl methacrylate (‘Perspex’) chambers with fluid reservoirs of 85 mm diameter and about 47 mm depth were made with extra liquid storage reservoirs of 50 ml on top of the chambers. Figure 15.2 shows the arrangement of cells and the specimens between them. The specimens were 100 mm diameter discs approximately 10 mm thick.
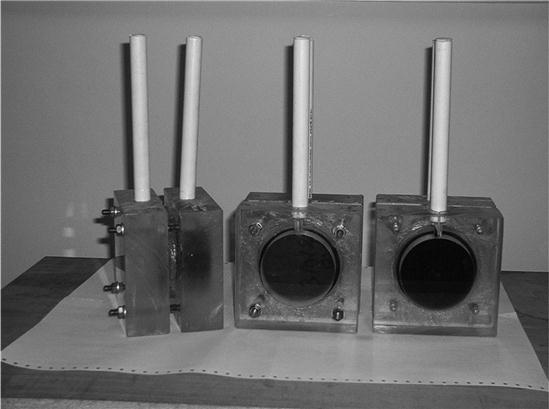
The specimen cells were sealed by using rubber gaskets on each side of the specimen, tightening the bolts and applying silicone rubber round the specimen and inner face of cells. The apparatus was kept in a temperature controlled room at 20 °C. Periodically, 10 ml of liquid was taken out from the reservoirs and the chemical composition was analysed using inductive coupled plasma (ICP) analysis. Synthetic leachate was used on one side of the sample and de-ionised water on the other. The capacity factor and diffusion coefficient values were calculated from the diffusion test results using an optimisation routine with the computer model.
The modelled input–output and experimentally measured (real) input–output concentrations from the diffusion cell are plotted for two typical examples in Figs 15.3 and 15.4. The results show that, for the limited data used, the model optimisation gave a very good agreement between the modelled values and the experimental values. This was achieved by the progressive changing of the capacity factor and diffusion coefficient using the optimisation routine. In Fig. 15.3, increasing either parameter increases the transport into the sample and will thus increase the rate of decline of the input concentration. The output concentration will, however, change more if the diffusion is increased but the adsorption is decreased. In Fig. 15.4, a high initial concentration in the sample (measured by pore fluid expression and input into the model) gives a rising concentration on both sides of the sample. The derived results for diffusion and adsorption are given in Table 15.5.
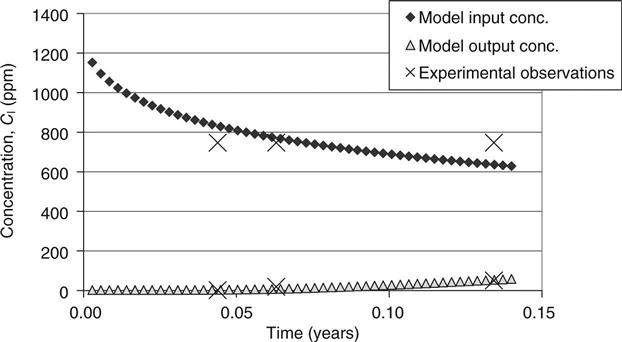
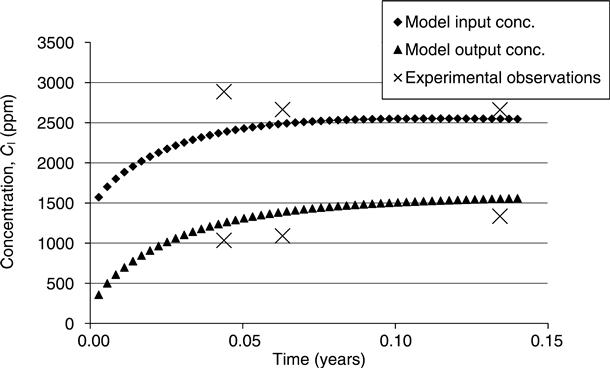
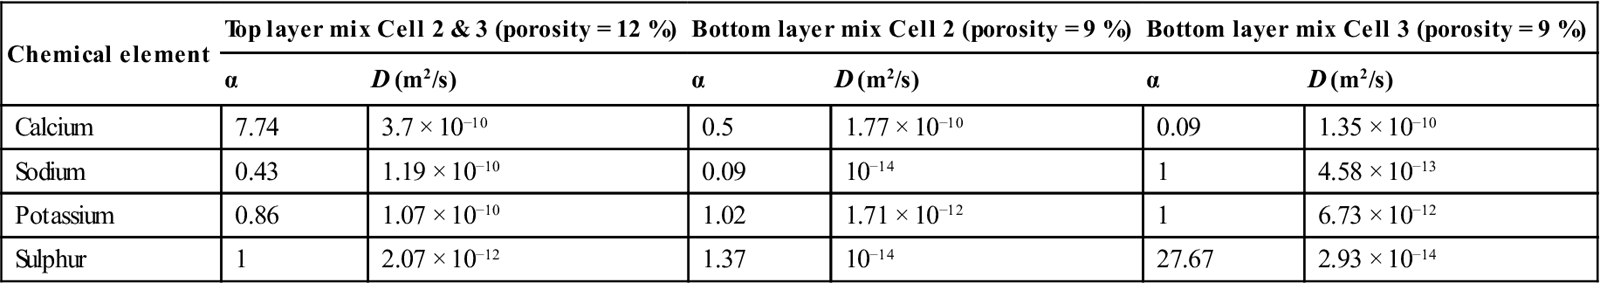
Table 15.5
Capacity factor (α) and diffusion coefficient (D) values for the four major elements in the trial cells
| Chemical element | Top layer mix Cell 2 & 3 (porosity = 12 %) | Bottom layer mix Cell 2 (porosity = 9 %) | Bottom layer mix Cell 3 (porosity = 9 %) | |||
| α | D (m2/s) | α | D (m2/s) | α | D (m2/s) | |
| Calcium | 7.74 | 3.7 × 10⁻¹⁰ | 0.5 | 1.77 × 10⁻¹⁰ | 0.09 | 1.35 × 10⁻¹⁰ |
| Sodium | 0.43 | 1.19 × 10⁻¹⁰ | 0.09 | 10−14 | 1 | 4.58 × 10⁻¹³ |
| Potassium | 0.86 | 1.07 × 10⁻¹⁰ | 1.02 | 1.71 × 10⁻¹² | 1 | 6.73 × 10⁻¹² |
| Sulphur | 1 | 2.07 × 10⁻¹² | 1.37 | 10−14 | 27.67 | 2.93 × 10⁻¹⁴ |
15.3.3 Permeability tests
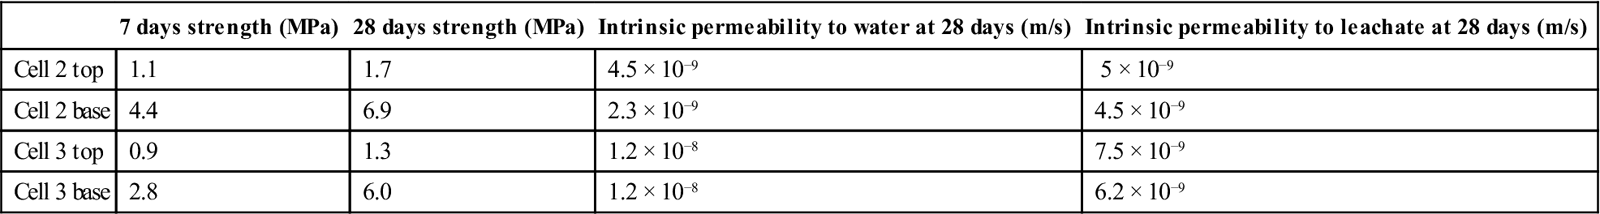
The permeabilities of the specimens were determined using a continuous high-pressure flow experiment described in Section 4.2. Measurements were made after one sample volume of liquid had passed through the concrete or mortar specimens. Assuming an average permeability of 10−9 and a maximum leachate head of 1 m above the liner, this corresponds to 16 years of exposure in service. The results are given in Table 15.6.
Table 15.6
Characteristics of the mixes used in the site trial cells
| 7 days strength (MPa) | 28 days strength (MPa) | Intrinsic permeability to water at 28 days (m/s) | Intrinsic permeability to leachate at 28 days (m/s) | |
| Cell 2 top | 1.1 | 1.7 | 4.5 × 10⁻⁹ | 5 × 10⁻⁹ |
| Cell 2 base | 4.4 | 6.9 | 2.3 × 10⁻⁹ | 4.5 × 10⁻⁹ |
| Cell 3 top | 0.9 | 1.3 | 1.2 × 10⁻⁸ | 7.5 × 10⁻⁹ |
| Cell 3 base | 2.8 | 6.0 | 1.2 × 10⁻⁸ | 6.2 × 10⁻⁹ |
15.3.4 Pore fluid concentrations
Samples of pore fluid were expressed under pressure from samples of the different mixes using a cell similar to an OPI-CAD cell (http://www.cad-inst.com/en, http://www.claisse.info/Lab%20Testing/Chemical%20Testing.htm) and the concentrations obtained from them using ICP analysis. This cell works by applying very high pressures to a confined sample using a compression test machine. As the volume of the sample is reduced, a small amount of pore fluid flows out through a pipe in the bottom of the cell.
15.4 Site trials
15.4.1 Introduction
Two cells were constructed on a licensed landfill operation site at Risley, Cheshire, UK in Winter 2000 with different cementitious composite mineral waste materials. This landfill site received both domestic and industrial waste.
The purpose of the cells was as follows:
• to provide validation data for the modelling of the performance of the barriers in service;
• to demonstrate a construction method;
• to demonstrate that the novel mixes could be made in industrial quantities (150 tonnes of concrete were used in the three test cells);
• to provide samples for on-site workability testing and long-term physical testing in the lab;
• to provide samples for mineralogical analysis when the cells were dismantled.
15.4.2 Layout and construction methods of the cells
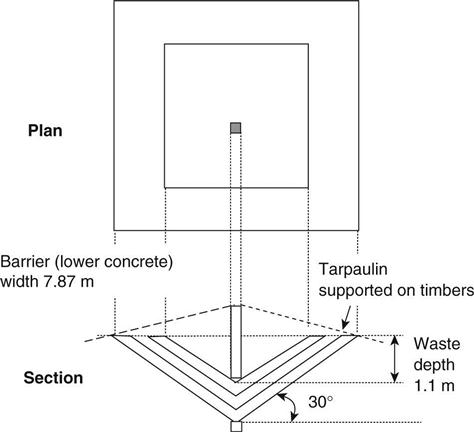
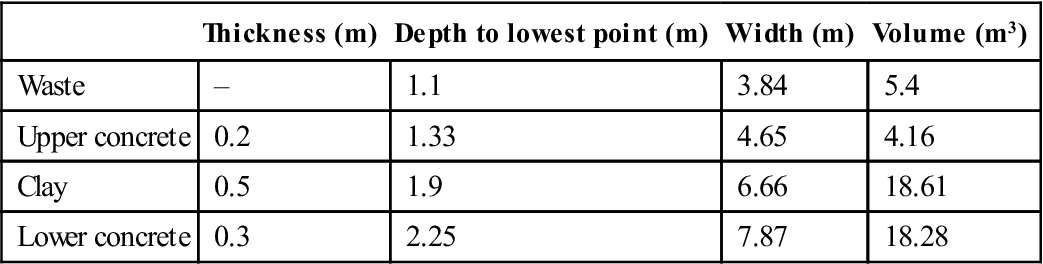
A typical test cell is shown schematically in Fig. 15.5. The barrier was made up of two layers of concrete with a layer of clay between them. These inverted pyramid shape cells measured 8 m wide and contained waste to a maximum depth of 1.1 m. The slopes of the cells were 30° and the cells contained 5.4 m3 of waste. Table 15.7 gives the dimensions and volume of each layer in the test cells. The excavation was carried out with an excavator which was also used to place the concrete and mortar mixes designed for the different cells. The concrete layers were placed and levelled by the excavator. The compaction of concrete layers was carried out by two poker vibrators and the compaction of clay layer was carried out using the outside surface of the excavator’s bucket.
15.4.3 Observations from the construction
During the construction of cell numbers 2 and 3, the mix proportions actually used were different to what was designed in the laboratory due to some practical problems encountered in the batching plant and placement of some of materials (inaccurate weighing of different materials and partial hydration of cement kiln dust (CKD) while stored at the plant). The mixes actually made were tested and showed higher permeabilities than the mixes designed initially in the laboratory.
15.4.4 Emplacement of waste and leachate
Due to size and shape constraints of the cells, shredded waste was used. It was placed and compacted up to the top level of the test cells. A leachate which provided the most aggressive solution representing the leachates found in the landfill was obtained from the leachate treatment plant for the site and the cells were filled 100 mm below the top giving a 1 m head at the deepest point. The cells were covered with a tarpaulin rain cover to prevent rainwater ingress and contain odour.
15.4.5 Instrumentation and sampling
Two types of sampling lines were used between the layers of the cell liners using 3 mm plastic tubes in both. In one type, the ends of the 3 mm plastic tubes were glued inside porous stone discs of 60 mm diameter. In the other type, the layer was drilled and the 3 mm plastic tubes ends were sealed in place in the set concrete with sponge around the end of the line. The sampling lines were placed as an array in the various liner materials and levels. Liquid samples were obtained by applying a vacuum to the lines.
15.4.6 Operation of vacuum lines
On the end of the extract lines, there was a sponge or a stone to form a void. If there was gas in adjacent pores or cracks, etc., samples could be extracted easily with a vacuum. If there was no gas or other pathway, the flow up the line had to be from advection from a spherical region around the void. Solving the equation for permeable flow into a spherical void, the velocity of flow up the pipe VF is given by:
[15.1]
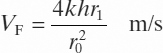 [15.1]
where:
k is the coefficient of permeability (10−9 m/s)
h is the head of water corresponding to the atmospheric pressure (m)
r1 is the radius of the void (10 mm) and
r0 is the bore radius of the pipe (1.5 mm).
The outer radius of the integral is insignificant provided it is much greater than r1. Using the values in brackets gives a calculated flow of 640 mm per hour. Flow rates of approximately this value were observed.
15.4.7 Modelling transport in the test cells
Cell 3 needed to be refilled after 12 months. The reason for this was inadequate compaction of the clay layer leading to an increased permeability. The effective indicated permeability was calculated as follows:
Thus
indicated permeability k = 5.2 × 10⁻⁹ m/s
This corresponds to nearly the same permeability as a bentonite-enhanced sand liner and indicates satisfactory performance even when very poor construction practice was evident, but it did affect the modelling considerably. The permeability calculated from these site observations was therefore used for the clay layer.
15.4.8 Comparison between model and observations
The capacity factors and diffusion coefficients from the diffusion tests on the top and bottom mixes and the initial concentrations of different elements in site leachate and the mixes (from pore pressed solutions, see Table 15.8) were used to verify the modelled concentration against measured values. These are shown in Figs 15.6–15.11 for calcium, sodium and potassium for cells 2 and 3, respectively. On these graphs, error bars are shown between the 10th and 90th percentiles from the probability calculations at ages of 2 and 4 years (in Figs 15.9, 15.10 and 15.11 these have been offset slightly for clarity). The coefficients of variation used for these are shown in Table 15.9. The observed concentrations which are shown in the graphs are based on the average from up to four different samples taken in different parts of the cells. For some of these, a considerable spread of results was recorded.
Table 15.8
Initial liquid concentrations used in models for site trials (mg/l)
| Elements | Site leachate | Cell 2 | Cell 3 | ||||
| Top layer | Clay layer | Bottom layer | Top layer | Clay layer | Bottom layer | ||
| Calcium | 344 | 4 | 350 | 1214 | 4 | 350 | 14 |
| Sodium | 2300 | 450 | 450 | 10802 | 450 | 450 | 2157 |
| Potassium | 4730 | 15193 | 300 | 1761 | 15193 | 300 | 761 |
| Sulphur | 770 | 2000 | 500 | 549 | 9294 | 500 | 50 |
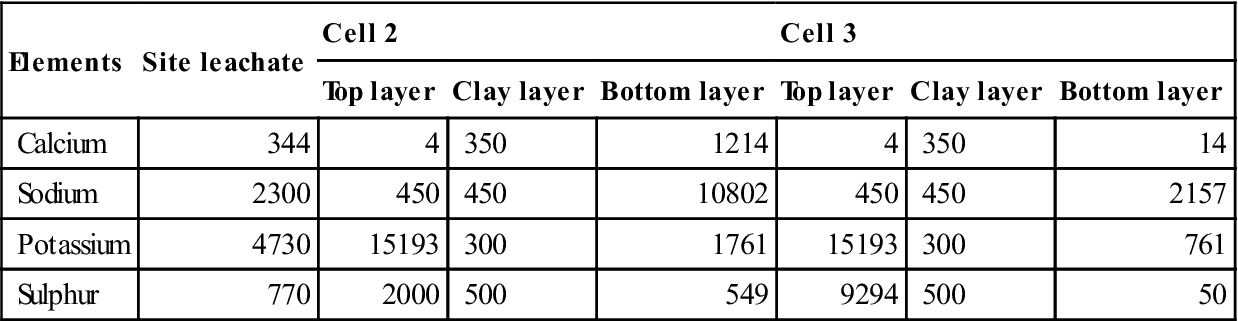
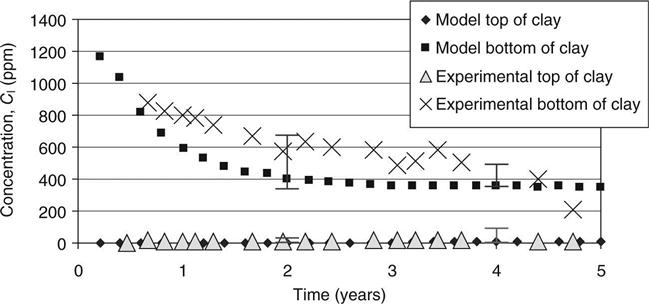
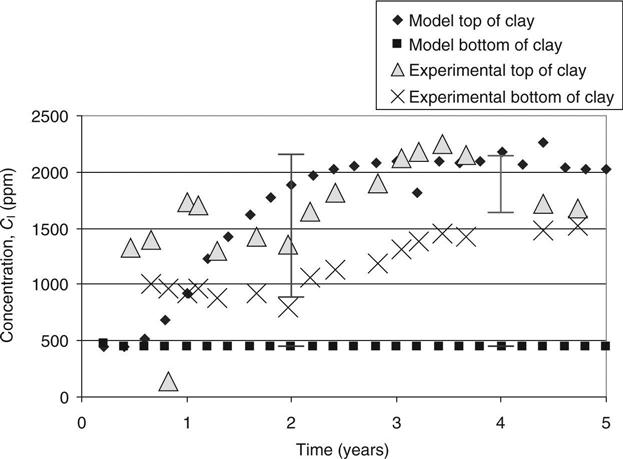
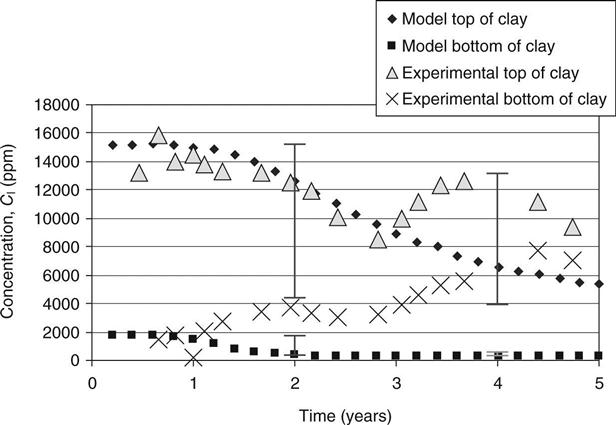
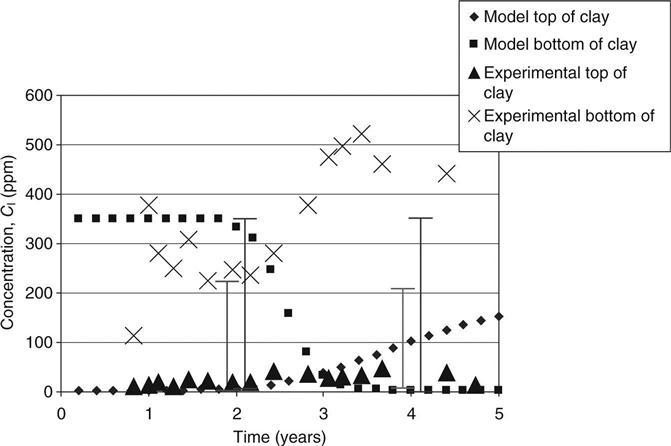
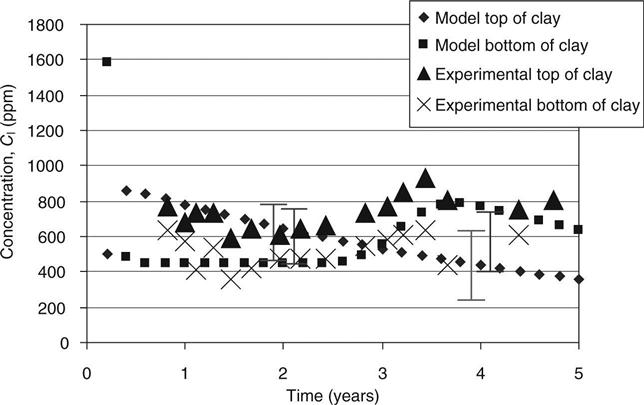
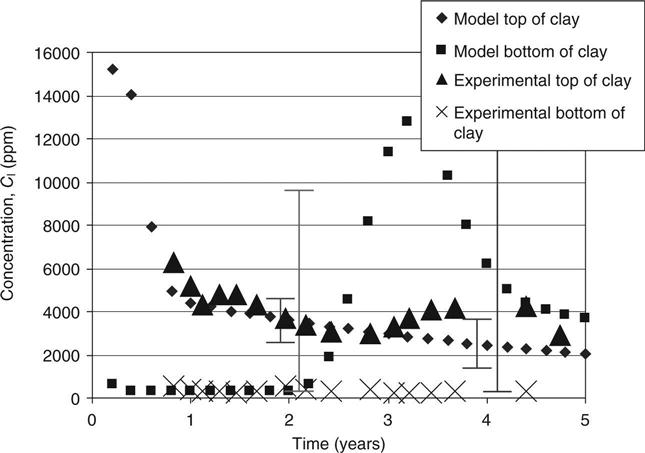
Table 15.9
Coefficients of variation for parameters used in the modelling
| Parameter | V % | Distribution used |
| Capacity factor | 50 | Linear |
| Diffusion coefficient | 4 | Logarithmic |
| Permeability | 3.165 | Logarithmic |
| Layer thickness | 15 | Linear |
In Fig. 15.6, the fall in calcium concentration at the bottom of the clay in cell 2 is somewhat slower than predicted, but the error bars (which included a range of permeabilities in their calculation) allow for this and cover the range of observed data. The very slow rise at the top of the clay is well predicted.
In Fig. 15.7, the rapid rise of the sodium concentration at the top of the clay follows the predictions within the range of the error bars. Some instability in the model may be seen at 3–4 years. This could be solved at the expense of increasing the run time but is not considered relevant within the accuracy of the whole model. The results at the bottom of the clay are not explained at all. There is an unexplained source of sodium (possibly in the shredded waste).
For the potassium in Fig. 15.8, the decline at the top of the clay lies just within the error bars, but there is again an unexplained trend at the bottom.
In cell 3, Fig. 15.9 shows the calcium rising at the bottom of the clay. The model shows it falling and the error bars show that no changes in the input data led to a predicted increase. The agreement at the top of the clay is, however, good with a rise occurring as predicted but somewhat earlier.
In Fig. 15.10, the observed data from both sets lie within the range given. The rise and fall predicted for the bottom of the clay appears to be occurring in the site data at a lower level than expected but within the error bars. The observed increase at the top of the clay after 3 years is not predicted.
In Fig. 15.11, the expected increase in potassium at the bottom of the clay has not occurred; however, the error bars give a very wide range due to uncertainty about the time when this will occur. The data for the top of the clay lies within the error bars.
The transport processes in landfills are associated with a high degree of uncertainty. The processes modelled here used real landfill leachate which was undergoing biological reactions throughout the experiment and took place in a site environment with all of the associated uncertainty. The combination of these factors with the uncertainty associated with the stated assumptions in the model has given rise to some unexpected events. Nevertheless, this is a useful exercise to indicate likely trends in a real environment. Long-term results which will involve transport processes far closer to the steady state are actually likely to be more accurate.
15.5 Reducing transport in cracked concrete
15.5.1 Cracking and other preferential flow paths
This section describes a programme to measure the effect of cracking in concrete on the permeability. It also describes a method used to seal the cracks in waste containment barriers and experiments carried out to confirm that this method works. It is concluded that cracking will not cause failure. The modelling of the transport processes provided a good prediction of the movement of some species in the site trials.
Cracking could be caused by drying or thermal effects or the imposed stresses on the barrier and would permit transport regardless of the properties of the concrete. The solution to this is to use composite systems of concrete and clay, and their performance has been demonstrated experimentally in the work described here.
A possible cause of premature chemical failure is the formation of impermeable ‘boulder-like’ pieces with preferential flow paths for water around them. These boulders could develop impermeable surface layers through the formation of carbonates, chloroaluminates or magnesium compounds in a similar manner to that observed at the surface of existing concrete structures in hostile environments. If this occurred, the alkaline buffering and sorption capacity of the interior of the boulders would be lost. In this way the total buffering and sorption capacity of the repository would be substantially reduced.
In the plans for nuclear waste, it is envisaged that almost all of the cementitious material will be in the form of a soft grout (see Chapter 14). This material has been chosen to comply with various operational criteria including being readily pumpable into small spaces between the packages and having a low strength. These requirements have the effect that the formation of hard impermeable boulders will be strongly inhibited. For non-nuclear waste, the strength of the concrete was also kept as low as possible.
15.5.2 Action of sulphates
Penetrating sulphates react with hardened concrete and produce reaction products which have a volume which is greater than the available pore space (Claisse and Unsworth, 1996). In normal structures, this causes expansion of the matrix which continues until the critical stress is developed and cracks form. It is of note, however, that in a deep nuclear waste emplacement the effect is harmless because there is no void space in the whole repository and all compressible wastes are super-compacted to save space. The entire system is also subject to long-term compression from the surrounding rock and this will prevent any expansion and the resulting compressive stresses may even be beneficial. For non-nuclear applications with typical waste emplacement at depths possibly greater than 20 m, the expansive stresses would be sufficient to cause cracking, but the cracks would not open and would remain sealed with reaction product. In the event of any dissolution of this product, the multilayer barrier design described below would make the cracks fill with clay which would be extruded from the inter-layer.
15.5.3 Trial 1
Cracked samples were investigated using the high pressure cell described in Section 4.2.2. In the first test, a 100 mm diameter mortar disc 33.4 mm thick was cracked by applying small loads using a compression test machine. Fibre reinforcement was used in the sample to prevent it from falling apart. The cracks induced in the disc were clearly visible by naked eye and were measured between 0.5 mm and 1.2 mm wide (see Fig. 15.12).

15.5.4 Trial 2
A 55 mm thick metal spacer ring packed with clay from the trial site was placed on the top of the cracked disc. A two-layer test was then carried out on the high pressure cell apparatus using the synthetic leachate with fluorescein dye. After running the high pressure cell for about 1 h at 95 bar pressure, liquid started to leach out showing the fluorescein colour. When left for another 5 h at 95 bar the leaching stopped. About 0.8 sample volumes of liquid were collected during this period. No more leaching was observed when the cell was continuously run at the same pressure for another 24 h (see Fig. 15.13).
15.5.5 Trial 3
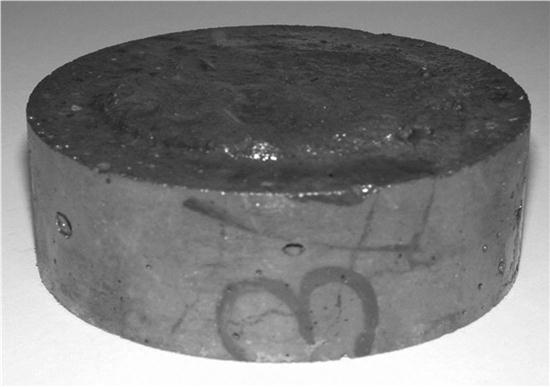
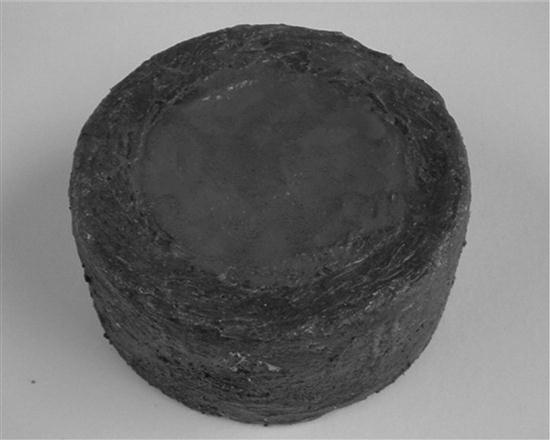
In trial 3, hairline cracks (about 0.2 mm wide) were induced in mortar samples (similar to cell number 2 bottom layer mix) and clay (passing 5 mm mesh sieve) was packed inside the sample (see Fig. 15.14). A mortar disc (similar to the cell number 2 top layer mix) was then placed on top of the clay and cracked mortar (Fig. 15.15). The thicknesses of the three layers were proportional to those in the site trial cells. Running this multi-layered sample at 100 bar for 3 days showed no leaching from it at all. After dismantling, it was noticed that the top mortar had disintegrated under the high pressure leachate flow, but no trace of leachate could be found in the bottom cracked mortar. These experiments therefore indicated that, under the expected high saturation pressures, the clay would effectively seal cracks in the concrete.
15.6 Conclusions
• Transport through concrete barriers may be modelled using simple computer programmes that apply the basic transport equations directly.
• Site trials showed that the model provided a useful estimate but revealed some unexplained data
• Experimental work has indicated that minor cracking will be sealed by the clay. No barrier can withstand the effect of gross failure of the substrate. This would cause major cracks to form and should be avoided.