
Let us take a close look at our current setup, which we created in the first chapter, for monitoring a localhost. Icinga by default comes with object configuration for a localhost. The object configuration files are inside /etc/icinga/objects for default installations.
$ ls /etc/icinga/objects
commands.cfg   notifications.cfg  templates.cfg
contacts.cfg   printer.cfg        timeperiods.cfg
localhost.cfg  switch.cfg         windows.cfg
There are several configuration files with object definitions. Together, these object definitions define the monitoring setup for monitoring some services on a localhost.
Let's first look at localhost.cfg, which has most of the relevant configuration. We have a host definition:
define host{
  use          linux-server
  host_name    localhost
  alias        localhost
  address      127.0.0.1
}
The preceding object block defines one object, that is, the host that we want to monitor, with details such as the hostname, alias for the host, and the address of the server—which is optional, but is useful when you don't have DNS record for the hostname. We have a localhost host object defined in Icinga with the preceding object configuration.
The localhost.cfg file also has a hostgroup defined which is as follows:
define hostgroup {
  hostgroup_name  linux-servers
  alias           Linux Servers
  members         localhost     // host_name of the host object
}
The preceding object defines a hostgroup with only one member, localhost, which we will extend later to include more hosts. The members directive specifies the host members of the hostgroup. The value of this directive refers to the value of the host_name directive in the host definitions. It can be a comma-separated list of several hostnames. There is also a directive called hostgroups in the host object, where you can give a comma-separated list of names of the hostgroups that we want the host to be part of. For example, in this case, we could have omitted the members directive in the hostgroup definition and specified a hostgroups directive, which has the value linux-servers, in the localhost host definition.
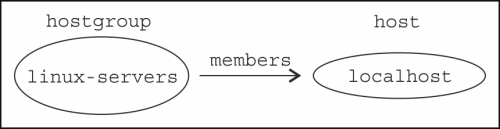
At this point, we have a localhost host and a linux-servers hostgroup, and localhost is a member of linux-servers. This is illustrated in the following figure:
Going further into localhost.cfg, we have a bunch of service object definitions that follow. Each of these definitions indicate the service on a localhost that we want to monitor with the host_name directive.
define service {
use local-service
host_name localhost
service_description PING
check_command check_ping!100.0,20%!500.0,60%
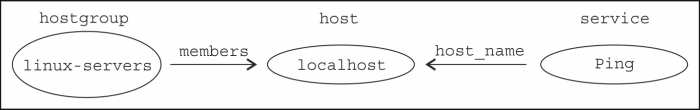
}This is one of the service definitions. The object defines a PING service check that monitors the reachability. The host_name directive specifies the host that this service check should be associated with, which in this case is localhost. Again, the value of the host_name directive here should reflect the value of the host_name directive defined in the host object definition. So, we have a PING service check defined for a localhost, which is illustrated by following figure:
There are several such service definitions that are placed on a localhost. Each service has a check_command directive that specifies the command for monitoring that service.
It is important to remember that the check_ping part in check_command in the preceding example does not mean the check_ping executable that is in /usr/lib64/nagios/plugins/check_ping for most installations; it refers to the Icinga object of type command. In our setup, all command object definitions are inside commands.cfg.
The commands.cfg file has the command object definition for check_ping.
define command {
  command_name    check_ping
  command_line    $USER1$/check_ping -H $HOSTADDRESS$ -w $ARG1$ -c $ARG2$ -p 5
}
The check_command value in the PING service definition refers to the preceding command object, which indicates the exact command to be executed for performing the service check. $USER1$ is a user-defined Icinga macro. Macros in Icinga are like variables that can be used in various object definitions to wrap data inside these variables. Some macros are predefined, while some are user defined. These user macros are usually defined in /etc/icinga/resources.cfg:
$USER1$=/usr/lib64/nagios/plugins
So replace the $USER1$ macro with its value, and execute:
$ value/of/USER1/check_ping --help
This command will print the usual usage string with all the command-line options available. $ARG1$ and $ARG2$ in the command definition are macros referring to the arguments passed in the check_command value in the service definition, which are 100.0,20% and 500.0,60% respectively for the PING service definition. We will come to this later. As noted earlier, the status of the service is determined by the exit code of the command that is specified in the command_line directive in command definition.
We have many such service definitions for a localhost in localhost.cfg, such as Root Partition (monitors disk space), Total Processes, Current Load, HTTP, along with command definitions in commands.cfg for check_commands of each of these service definitions.
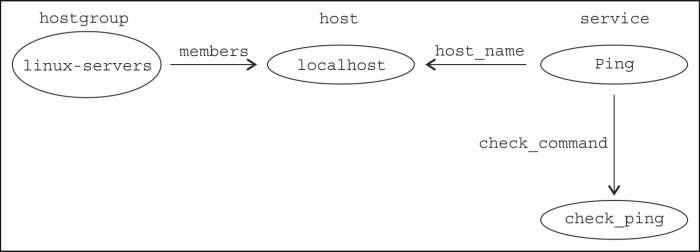
So, we have a host definition for localhost, a hostgroup definition linux-servers having localhost as its member, several service check definitions for localhost with check commands, and the command definitions specifying the exact command with arguments to execute for the checks. This is illustrated with the example Ping check in the following figure:
This completes the basic understanding of how our localhost monitoring is built up from plain-text configuration.