
In the earlier chapters, we looked into most of the important configuration parameters that Icinga provides. We can use them to set up the monitoring configuration best suited for our requirements. We now proceed to look into the available web interfaces that are actually used to access the information and current status of our infrastructure to perform required actions.
Icinga comes with a default web interface, known as Icinga Classic. It is the most basic one in terms of the user interface, providing all available ways to access information and perform action. It also has another more modern web interface, known as Icinga Web. It is advanced in terms of usability, and uses more of AJAX to make the interface intuitive. Both versions have a similar set of features.
There are many independent web UIs and the Thruk project (www.thruk.org) is one of them. It supports a number of monitoring backends such as Nagios, Icinga, and Shinken. It is again more intuitive in usability, but is similar to the classic interface in design. Thruk has the ability to connect to multiple instances of monitoring backends and show the consolidated information in one interface. All the classic web interfaces lack this functionality.
Both Icinga Classic and Thruk use CGI scripts to access information from the Icinga core and show it in the browser. Each CGI script corresponds to a view in the interface. We will look at each of these views and get ourselves acquainted with what the interface provides, and what we can do with it.
Icinga Classic is the default web interface for Icinga. In this section, we will look into various views that this interface provides.
Icinga's Apache configuration, by default, requires the user to provide an authentication to access the web interface. This is a simple HTTP authentication using a htpasswd file to store usernames and encrypted passwords. The default username and password is icingaadmin and icingaadmin respectively. You should change this using the htpasswd utility. It can be used to set/update passwords and add new users.
# create johndoe user or update its password:
htpasswd /etc/icinga/htpasswd johndoe
If the username is the name of a valid Icinga contact, the web interface will show only those hosts and services that are associated with this contact, either directly by contacts directive or indirectly via contact groups. So, operational teams managing different set of servers can have a contact associated with relevant hosts and services, set a password for that username in the htpasswd file, and use the authentication details to see only relevant information about the hosts and services.
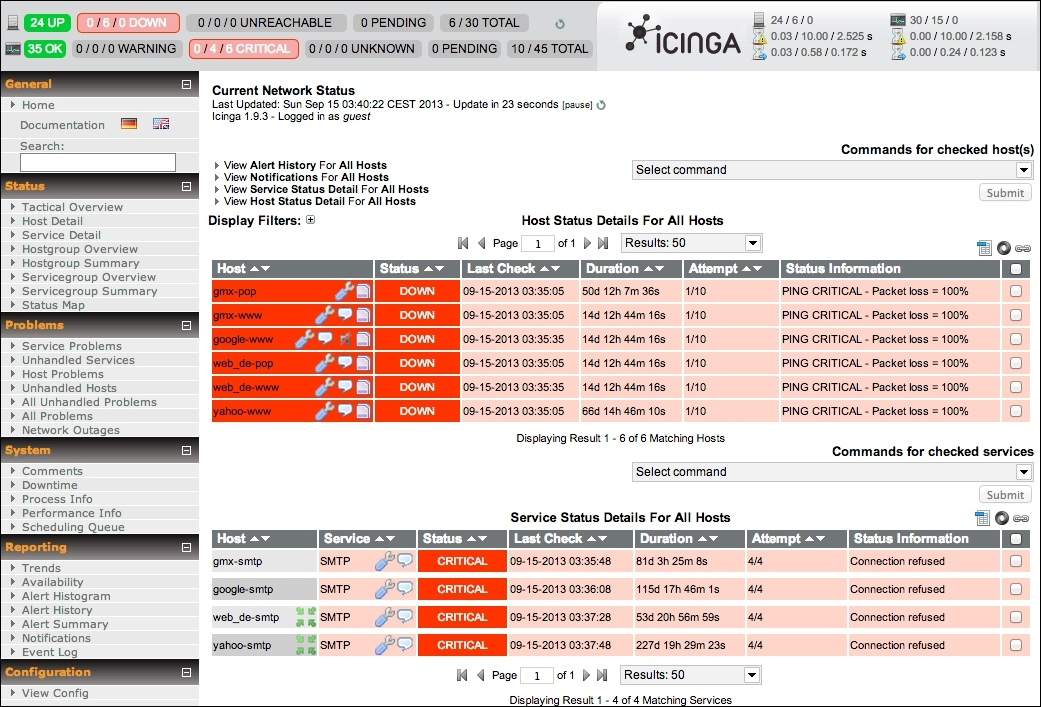
The Status view shows a quick overview of the on-going problems in the network. Here is a screenshot of the view from Icinga's official demo website:
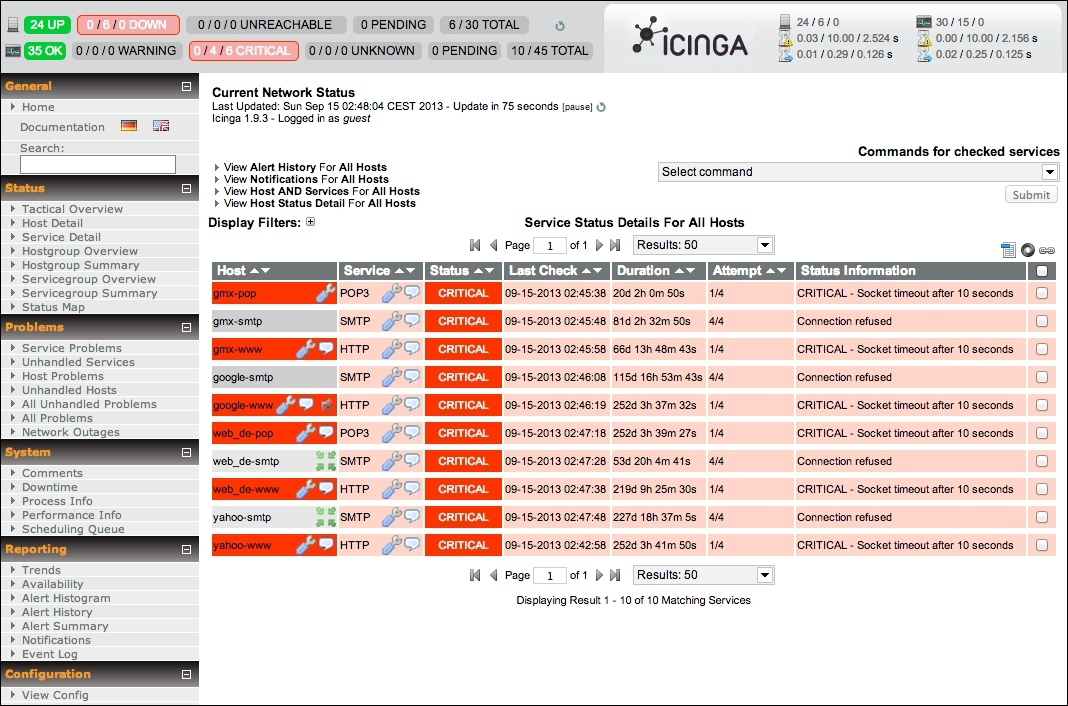
The status view
The current default view is the Service Problems page under the Problems section. In the preceding screenshot, the table in the center shows that the hosts are gmx-pop, gpx-www, web_de-pop, and so on, all these hosts are unreachable, and the relevant services on them are also critical. Some services such as SMTP on gmx-smtp are critical although the servers are still reachable. The table shows short information on details such as the time when last check was performed, the duration that the service has been critical for, and the output of the check plugin describing the problem.
The top panel shows a statistical overview of the current network status. The first row on the left-hand side shows the number of hosts in various states. The second row shows the numbers for services. The three numbers in each state correspond to unacknowledged, acknowledged, and total problems in that state. The last entry TOTAL in each row shows the number of problems and number of all hosts and services. On the top-right corner (inside the panel), the statistics about the Icinga core process running are available. You will see indicators for minimum/maximum service check execution time, latency, and so on.
The area above the table in the center gives filtering and pagination options. There is also a commands dropdown on the right-hand side, providing commands such as schedule downtime, and acknowledge a problem. Icinga supports some external commands that include setting downtime for service checks during a migration, acknowledging a problem to prevent further notifications, or for the purpose of records.
Users can select multiple problems at once using the checkbox at the end of each row in the table, and execute the selected command on all of them at once. This is helpful if there is a widespread outage and we need to acknowledge a number of problems on the screen at once.
On the left-hand side of the screen, there is a navigation bar for quickly accessing relevant information in the center part.
The tactical view is the default view that opens when we open up the web interface. It is under the Status category, as shown in the following screenshot:
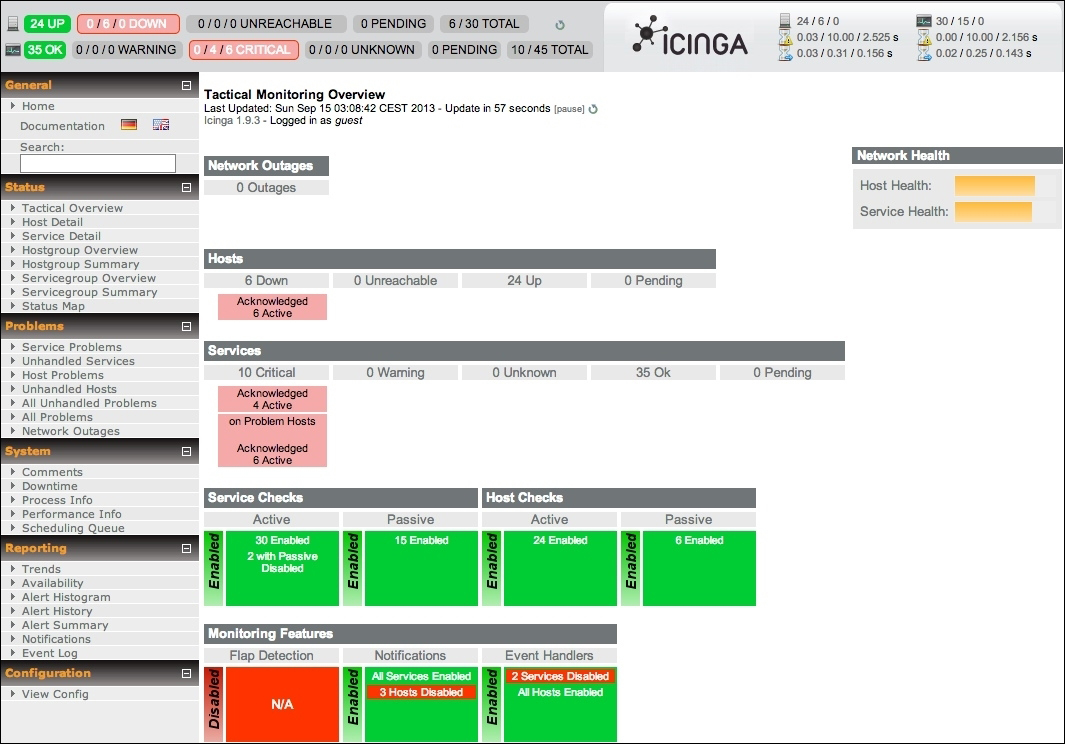
A tactical overview
This view gives an overview of the network health in terms of host and service health. It shows the number of acknowledged and unacknowledged problems in various states, along with information such as active/passive checks, flap detection configuration, notifications being sent, and event handlers being called.
The panel at the top and navigation bar on the left-hand side remains the same in all the views; however, the central part keeps changing.
The Host Detail and Service Detail entries are under the Status section in the navigation bar.
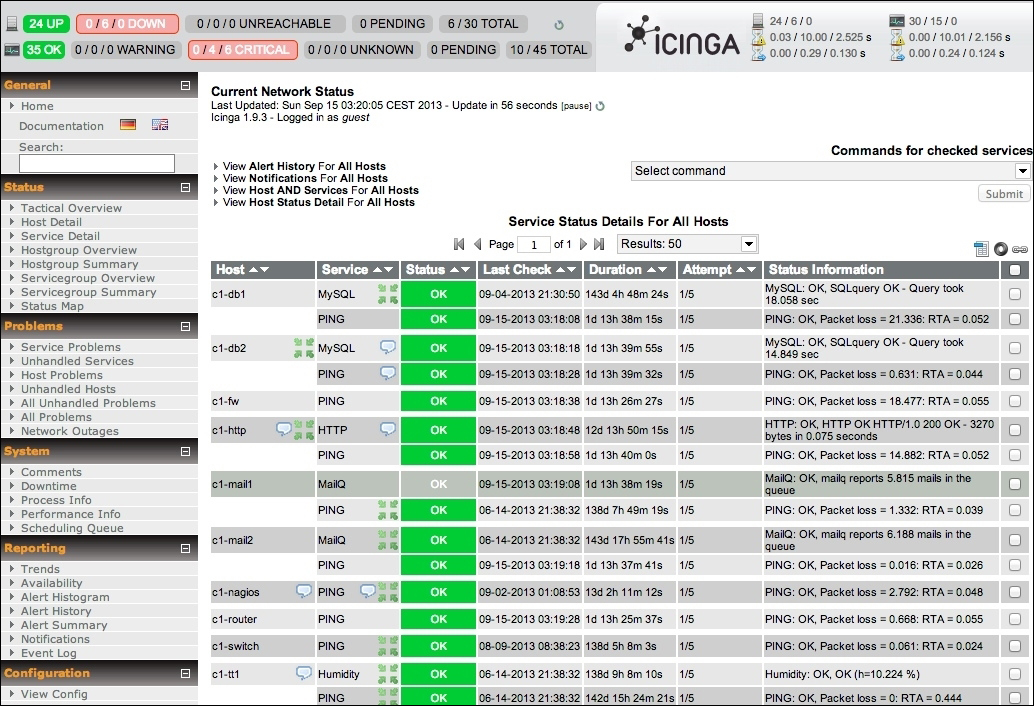
Service details
Each of these views shows the list of all hosts/services and their status. The default view shows only those hosts and services that are in one of the problem states. This helps when setting up the monitoring configuration, and need to make sure that all hosts and services are in place.
The Hostgroup Overview, Hostgroup Summary, Servicegroup Overview, and Servicegroup Summary entries are under the Status section. The overview page shows the hosts and services that are grouped by hostgroups/servicegroups, while the summary page shows numerical statistics for the same.
The status map view is an informative one, it shows the map of the entire network using information from the host-parent relationships, and it helps in analyzing the point of failure in case of an outage. Following is an example screenshot:
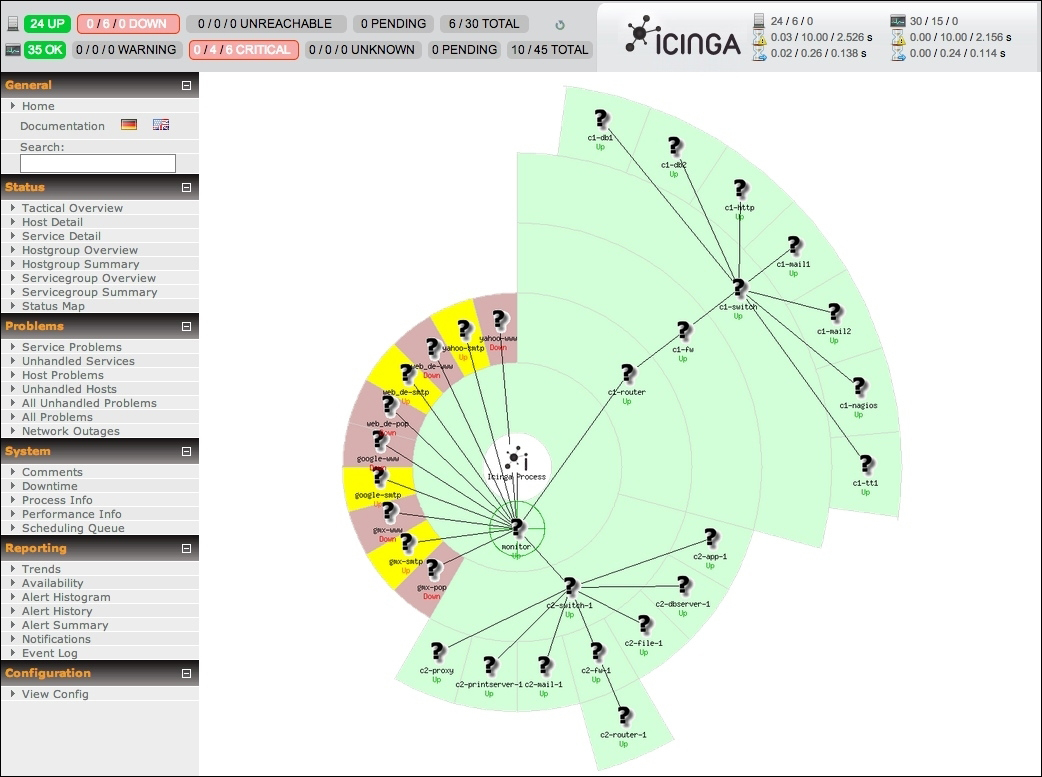
The status map
The preceding figure shows the network map in a graph-like form connecting routers/switches and servers. As we can see, the end points in red and yellow are in a problem state. They are directly connected to the Icinga process node as they don't have a proper host-parent (network device) set in their configurations.
The All Problem view is a view under the Problems section. It is a clean view that shows separate lists of hosts and services in the problem state.
The All Problems view
The web interface comes with many other views to look into various things, such as the comments view that lists all comments and acknowledgements made by users on various checks, a downtime view to look at all hosts/services with scheduled downtime, and various other views to generate different reports.