GDB is controlled at a low level through the GDB machine interface, GDB/MI, which is used to wrap GDB in a user interface or as part of a larger program and considerably extends the range of options available to you.
I have only mentioned those which have features that are useful in embedded development.
Terminal user interface (TUI), is an optional part of the standard GDB package. The main feature is a code window which shows the line of code about to be executed, together with any breakpoints. It is a definite improvement on the list command in command-line mode GDB.
The attraction of TUI is that it just works and doesn't need any extra set-up and, since it is in text mode, it is possible to use over an ssh terminal session when running gdb natively on a target. Most cross toolchains configure GDB with TUI. Simply add -tui to the command line and you will see the following:

Data display debugger (DDD), is a simple standalone program that gives you a graphical user interface to GDB with minimal fuss and bother and, although the UI controls look dated, it does everything that is necessary.
The --debugger option tells DDD to use GDB from your toolchain and you can use the -x argument for GDB command files:
$ ddd --debugger arm-poky-linux-gnueabi-gdb -x gdbinit sort-debug
The following screenshot shows off one of the nicest features: the data window which contains items in a grid that you can rearrange as you wish. If you double-click on a pointer, it is expanded into a new data item and the link is shown with an arrow:

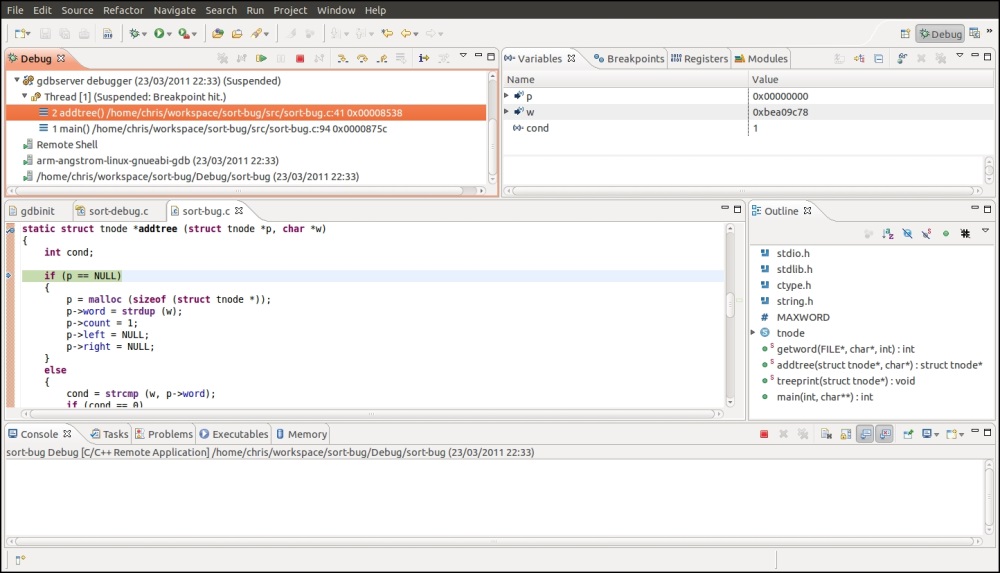
Eclipse, with the C development toolkit (CDT) plug-in, supports debugging with GDB, including remote debugging. If you use Eclipse for all your code development, this is the obvious tool to use but, if you are not a regular Eclipse user it is probably not worth the effort of setting it up just for this task. It would take me a whole chapter to explain adequately how to configure CDT to work with a cross toolchain and connect to a remote device, so I will refer you to the references at the end of the chapter for more information. The screenshot that follows shows the debug perspective of CDT. In the the top right window you see the stack frames for each of the threads in the process, and at the top right is the watch window showing variables. In the middle is the code window, showing the line of code where the debugger has stopped the program.