
2
Compliance Test
The purpose of this test is to verify whether the measurements conducted on a batch of parts comply with a specification, standard, etc. For example, a pull test can be conducted to verify whether the weld type complies with the bonding strength. However, the specification can be seen as a normal distribution of the average of the specified value and zero standard deviation.
The proposal is to use the “resistance/constraint” method, the resistance being what the test data yields, while the constraint is the specification. The principle is then to calculate the probability that the constraint is greater than the resistance and to verify that this probability is below a maximal value Pmax, fixed in advance.
The diagram shown in Figure 2.1 illustrates this method.
The probability Po that the constraint is greater than the resistance is given by:
where ϕ is the distribution function of the standard normal distribution.
In the specific cases when the constraint can be described by a normal distribution of zero standard deviation, the above formula becomes:
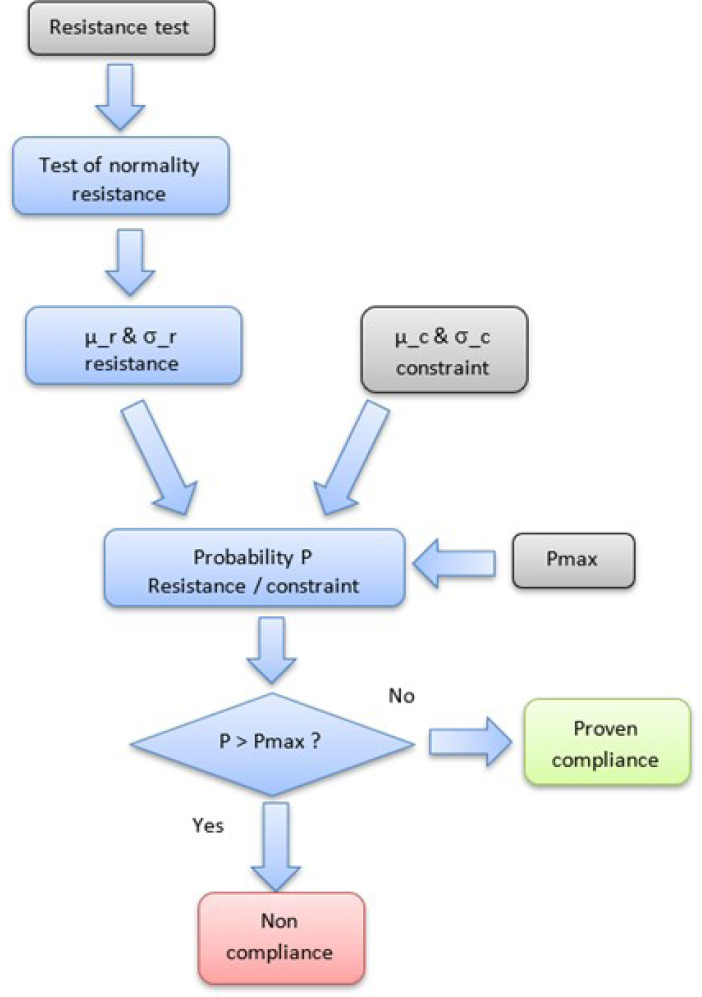
Figure 2.1. Overview diagram of the non-compliance test
EXAMPLE.–
Pull tests were conducted on 30 parts using the data in Table 2.1.
Table 2.1. Example of data for a non-compliance test
| 3.692 | 1.731 |
| 3.835 | 1.904 |
| 5.706 | 2.532 |
| 5.062 | 2.015 |
| 5.095 | 0.099 |
| 4.157 | 5.944 |
| 3.321 | 1.342 |
| 4.005 | 5.175 |
| 6.193 | 3.874 |
| 5.621 | 1.91 |
| 2.046 | 5.52 |
| 2.346 | 6.639 |
| 1.047 | 7.828 |
| 5.773 | 3.33 |
| 6.828 | 2.645 |
The Anderson–Darling normality test was conducted to verify data normality (see Figure 2.2).
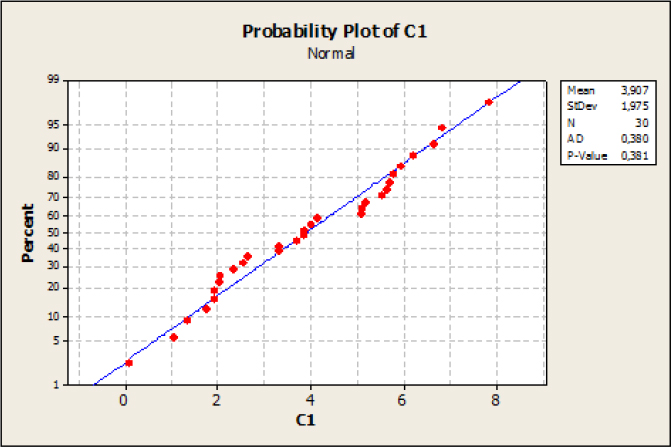
Figure 2.2. Test of normality
Therefore, the normality hypothesis cannot be rejected since the p-value is greater than the accepted risk level of 5%. The average resistance is therefore μr = 3.663 and the standard deviation is σr = 2.138. The constraint is defined by the MIL-STD-883G standard. Its average is μc = 1.5 and the standard deviation is σc = 0. The maximal probability Pmax is fixed at 5%.
This data yields Po = 15.6%, which is greater than Pmax. Consequently, the batch of parts is rejected.