
The trusty old bug has been the bane of software developers and engineers for more than 140 years. Yes, you read that right. It was in fact Thomas Edison that coined the term "bug" in the late 1870s. It appeared in many of his notebook entries where he describes for example that the incandescent lightbulb still had many "bugs left."
His efforts to debug his inventions are quite legendary. Consider the true grit and determination it took for a man already in his mid-sixties to work 112-hour working weeks. He and his seven-person team (it is a common misconception that there were only six because the seventh member didn't appear in the group photograph) became known as the insomnia squad during a 5-week stint that resulted in very little sleep.
These days, thanks to advances in technology, software developers have a vast array of debugging tools (inside and outside of Visual Studio) at their disposal. So does debugging really matter? Of course it does. It is part of what we as software developers do. If we don't debug, well, here are some examples:
- In 2004, the Electronic Data Systems (EDS) Child Support System in the UK overpaid almost 2 million people, underpaying almost a million and resulted in billions of dollars in uncollected child support payments. The incompatibility between EDS and another system it relied on resulted in taxpayers losing money and negatively affecting the lives of so many single parents.
- The initial release of Apple Maps in 2012. Enough said. While bemusing for many, I still find myself using Google Maps for turn-by-turn directions when in an unfamiliar city or area.
- The Therac-25 radiation therapy machine used electrons to target tumors in patients. Unfortunately, a race condition in the software caused the machine to deliver lethal overdoses of radiation in several patients.
Examples of software bugs affecting the lives of millions of people can be found all over the Internet. We're not simply talking about the run-of-the-mill bugs either. Sometimes we're faced with seemingly insurmountable issues. It is the comfort of knowing how to use some of the tools available that makes the difference between a stable application and one that is totally unusable.
As of writing this, IntelliTrace is only available in Visual Studio 2015 Enterprise. IntelliTrace is, however, not a new feature in Visual Studio. It has evolved over time, since Visual Studio 2010, into what we have available today.
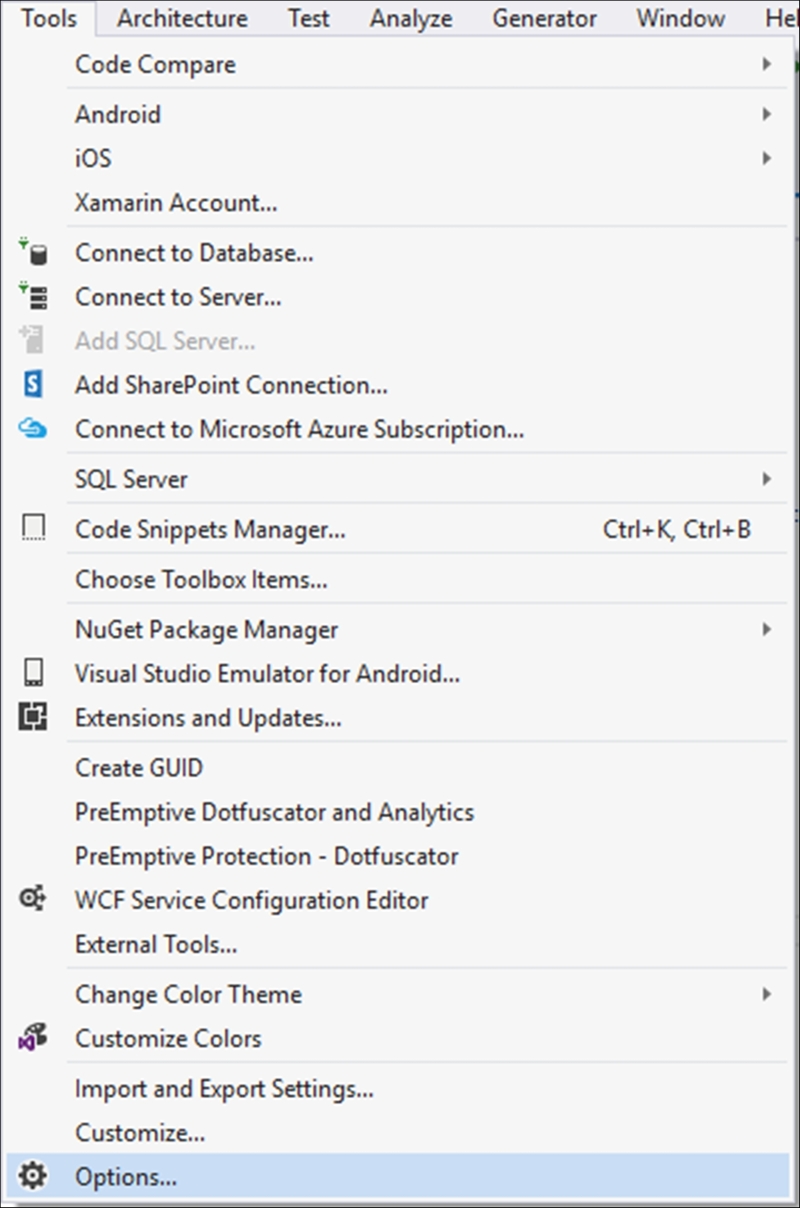
- First off, go to Tools | Options:
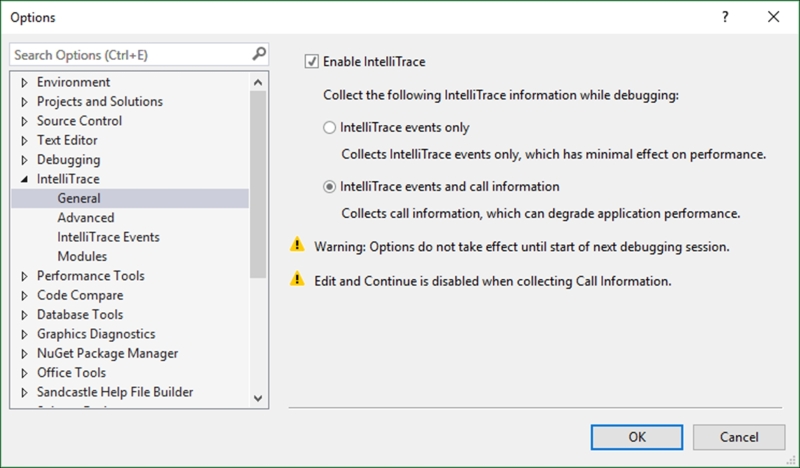
- Expand the IntelliTrace node and click on General. Ensure that Enable IntalliTrace is checked. Also, make sure that the IntelliTrace events and call information option is selected. Click on OK:
- In the
Recipes.csfile, you might need to add the followingusingstatements:using System.Diagnostics; using System.Reflection; using System.IO;
- Add a method called
ErrorInception()to theRecipesclass. Also, add the code to read the base path and assume that there is a folder calledlog. Do not create this folder on your hard drive. We want an exception to be thrown. Lastly, add another method calledLogException()that does nothing:public static void ErrorInception() { string basepath = Path.GetDirectoryName (Assembly.GetEntryAssembly().Location); var full = Path.Combine(basepath, "log"); } private static void LogException(string message) { } - Add the following code to your
ErrorInception()method after the full path has been determined. Here we are trying to open the log file. This is where the exception will occur:try { for (int i = 0; i <= 3; i++) { // do work File.Open($"{full}\log.txt", FileMode.Append); } } catch (Exception ex) { StackTrace st = new StackTrace(); StackFrame sf = st.GetFrame(0); MethodBase currentMethodName = sf.GetMethod(); ex.Data.Add("Date", DateTime.Now); LogException(ex.Message); } - When you have added all your code, your code should look like this:
public static void ErrorInception() { string basepath = Path.GetDirectoryName(Assembly.GetEntryAssembly().Location); var full = Path.Combine(basepath, "log"); try { for (int i = 0; i <= 3; i++) { // do work File.Open($"{full}\log.txt", FileMode.Append); } } catch (Exception ex) { StackTrace st = new StackTrace(); StackFrame sf = st.GetFrame(0); MethodBase currentMethodName = sf.GetMethod(); ex.Data.Add("Date", DateTime.Now); LogException(ex.Message); } } private static void LogException(string message) { } - In the
Program.csfile, call theErrorInception()method. Right after that, do aConsole.ReadLine()so that our console application will pause there. Do not add any breakpoints anywhere to your code:ErrorInception(); Console.ReadLine();
- Start debugging your application. The exception is thrown and the application continues running, a condition often experienced with much more complex applications. At this point, you would expect a log file to be appended with the fictitious data of the app, but nothing happened. It is at this point that you stop your application and start adding breakpoints all over your code in a hit and miss-type exercise. I say hit and miss because you probably will not know exactly where the error is. This is especially true if your code file contains a few thousand lines of code.
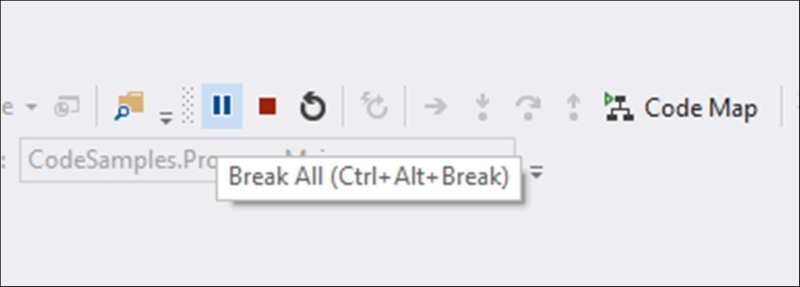
Well now, with IntelliTrace and Historical Debugging, you just need to click on the Break All button:
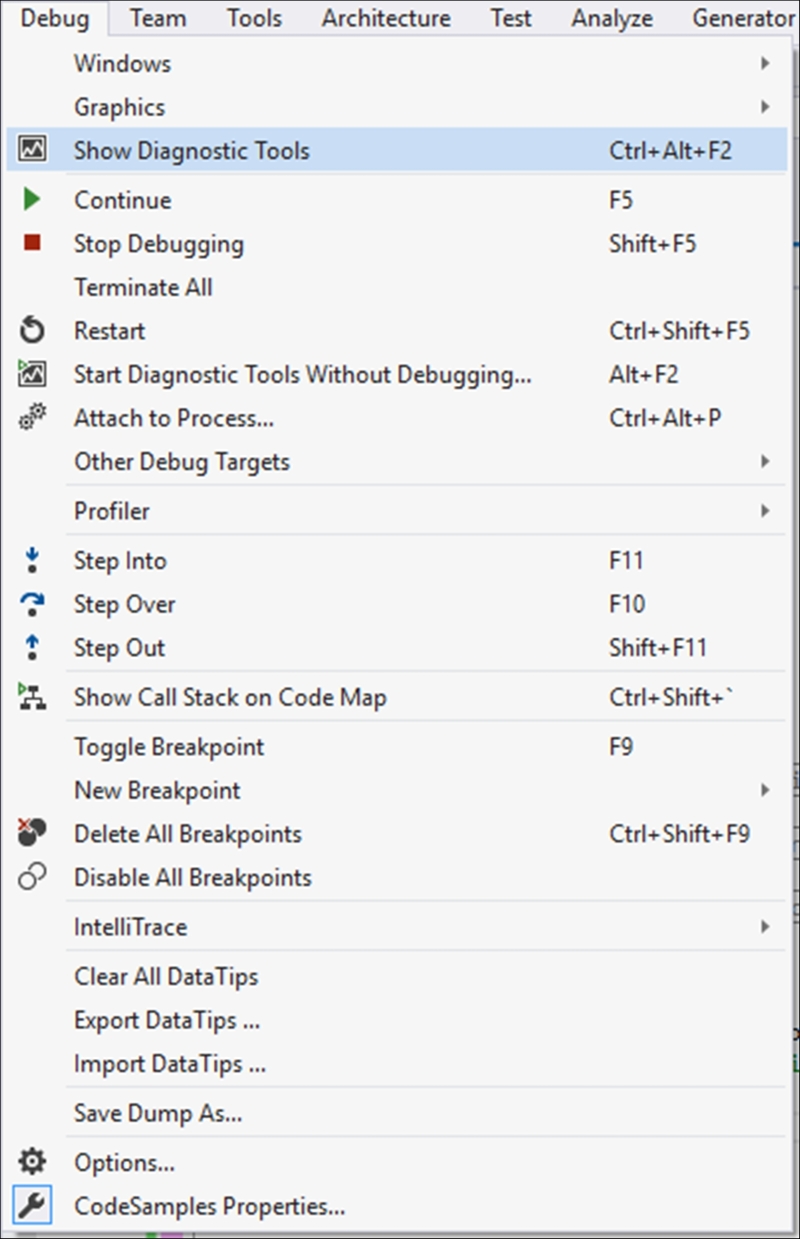
- Your application is now essentially paused. If you don't see the Diagnostic Tools window, go to Debug and click on Show Diagnostic Tools (or Ctrl + Alt + F2):
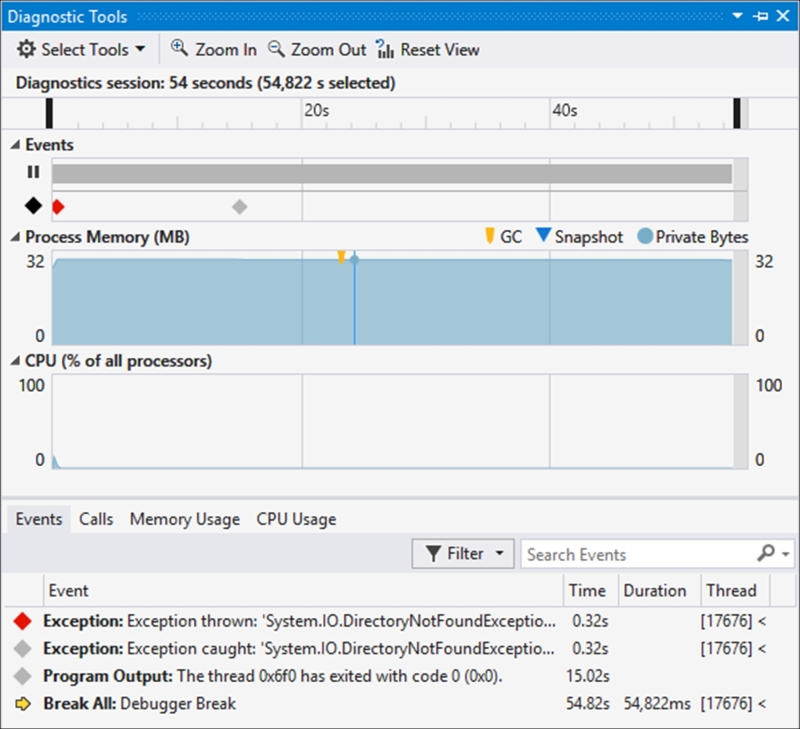
- Visual Studio now displays the Diagnostic Tools window. Immediately you can see that there is a problem indicated by the red diamond icon on the Events section. In the Events tab at the bottom, you can click on the exception:
- Doing this expands the exception details, where you can see that the log file was not found. Visual Studio, however, goes one step further with Historical Debugging:
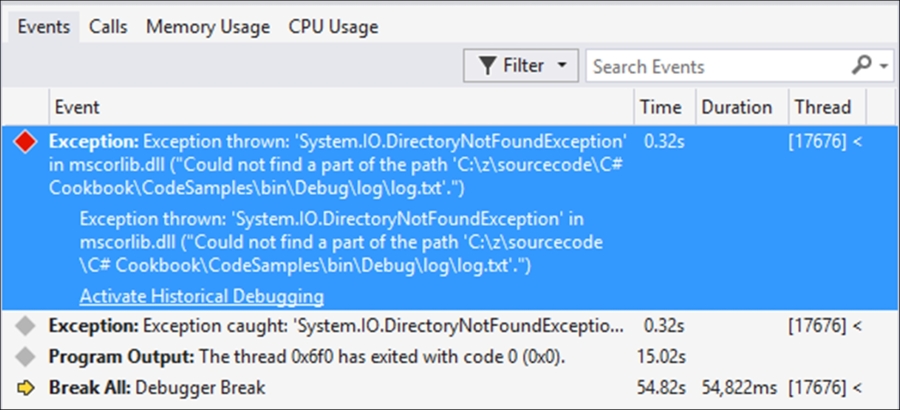
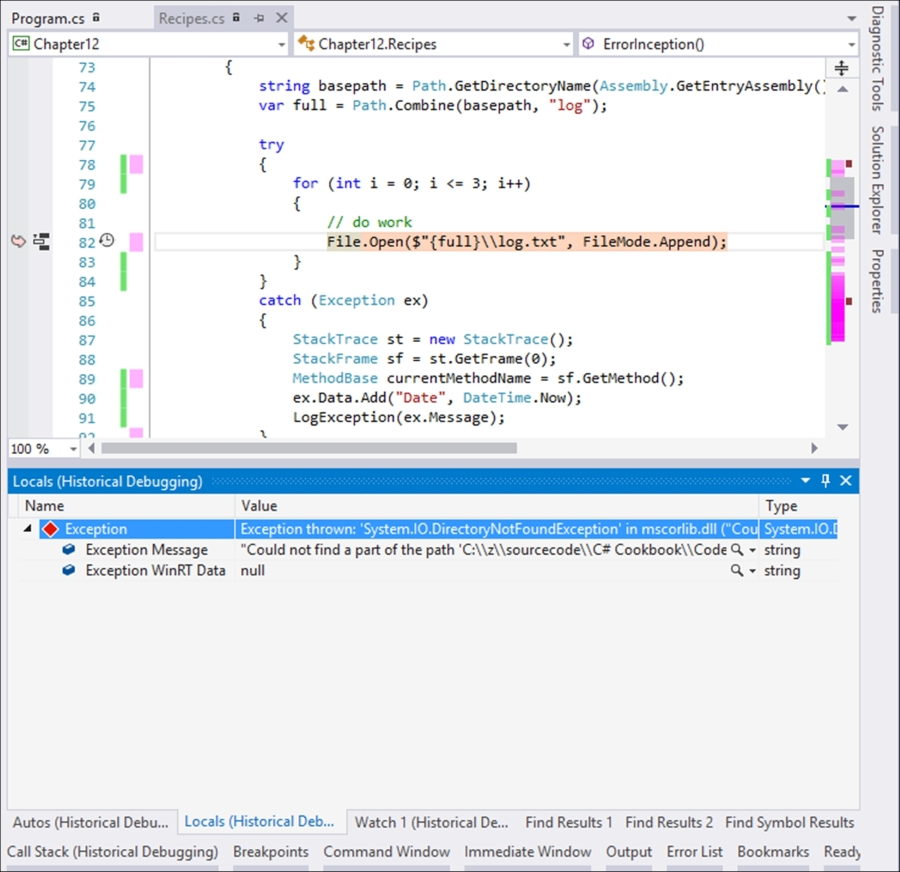
- You will see a link at the bottom of the exception details that says Activate Historical Debugging. Click on this link. This allows you to see the actual line of code that caused this exception in the code editor. It also allows you to view the history of the application's state in the Locals window, call stack, and other windows. You now can see the specific line of code that caused the exception in your code editor. In the Locals window, you can also see what the path was that the application used to look for the log file. This kind of debugging experience is immensely powerful and allows developers to go straight to the source of the error. This leads to increased productivity and better code:
So what is the takeaway here? If you only remember one thing, remember this. Once the users of your system lose faith in the abilities and potential of that system due to bugs, that confidence is almost impossible to regain. Even if you resurrect your system from the ashes, after it was laid low by bugs and other issues, to produce a flawless product, your users will not be easily swayed. This is because in their mind, the system is buggy.
I once had to take over a system partially developed by a senior developer who was leaving the company. She had an excellent specification and a well presented prototype shown to the customer. The only problem was that she left the company shortly after the system's phase one was implemented. When the bugs came popping up, the client naturally asked for her assistance.
Telling the client that the developer (who has been solely responsible for building a relationship with the client) has left the company did not bode well to instil a sense of confidence. Having a single developer involved was the first mistake of this particular project anyway.
Secondly, phase two was about to be developed by yours truly, who was also the only developer assigned to this client. This had to be done while building on top of the buggy phase one. So I was fixing bugs while developing new features for the system. Luckily this time round, I had a fantastic project manager called Rory Shelton as my wingman. Together we were dumped in the deep end and Rory did a fantastic job managing the client's expectations while being totally transparent with the client regarding the challenges we were facing.
The users were unfortunately already disillusioned with the provided system and didn't trust the software. This trust was never fully regained. If we had IntelliTrace and Historical Debugging back in 2007, I definitely would have been able to track down the issues in a code base that was unfamiliar to me.
Always debug your software. When you find no more bugs, debug it again. Then give the system to my mom (love you mom). You as the developer of that system know which buttons to click and what data to enter, and in which order things need to happen. My mom doesn't and I can assure you that a user unfamiliar with a system can break it quicker than you can brew a fresh cup of coffee.
Visual Studio provides developers with a very powerful and feature rich set of debugging tools. Use them.