
PerfTips are definitely one of my favorite features of Visual Studio 2015. Explaining what they do doesn't do them justice. You have to see them in action.
Do not confuse PerfTips with CodeLens. PerfTips is a separate option from CodeLens in Visual Studio.
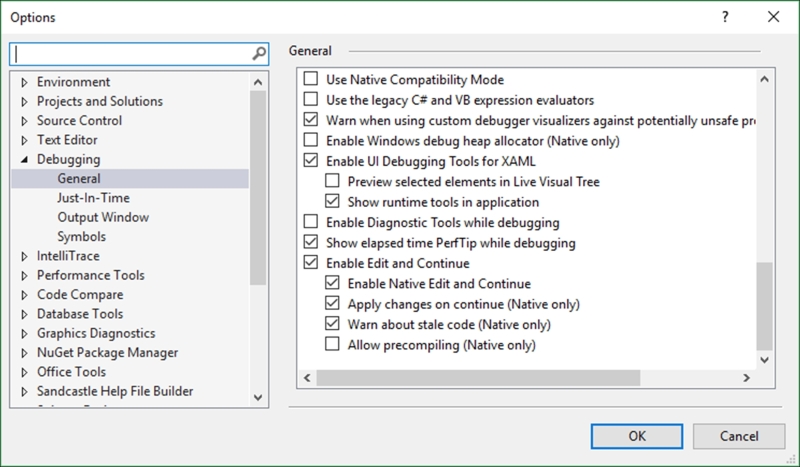
- PerfTips are enabled by default. But just in case you are not seeing any PerfTips, go to Tools | Options, and expand the Debugging node. Under General, to the bottom of the settings page, you will see an option called Show elapsed time PerfTip while debugging. Ensure that this option is checked:
- We will create a few simple methods that mimic long-running tasks. To do this, we will just sleep the thread for a couple of seconds. In the
Recipes.csfile, add the following code:public static void RunFastTask() { RunLongerTask(); } private static void RunLongerTask() { Thread.Sleep(3000); BottleNeck(); } private static void BottleNeck() { Thread.Sleep(8000); } - In your console application, call the static method
RunFastTask()and place a breakpoint on this line of code:RunFastTask(); Thread.Sleep(1000);
- Start debugging your console application. Your breakpoint will stop on the
RunFastTask()method. Hit F10 to step over this method: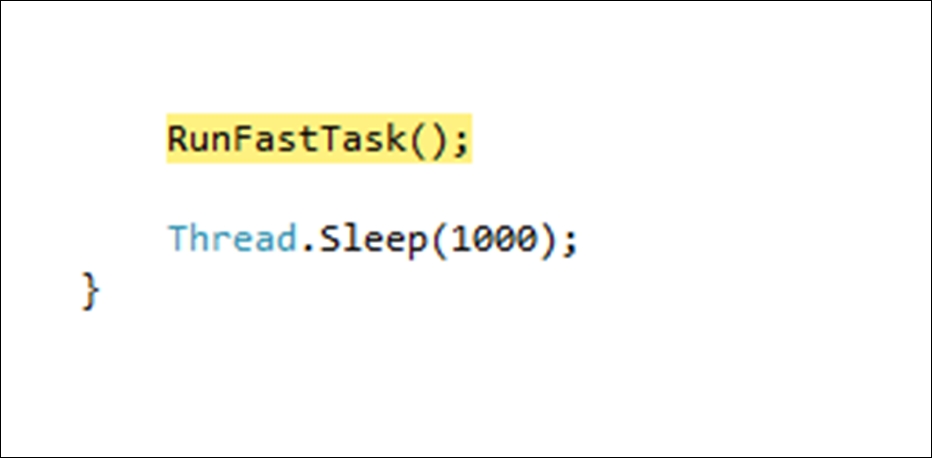
- You will notice that 11 seconds later, the next line will be highlighted and the PerfTip will be displayed. The PerfTip displays the time it took for the previous line of code to execute. So the debugger that now sits on the
Thread.Sleep, shows that theRunFastTask()method took 11 seconds to complete. The task is clearly not very fast: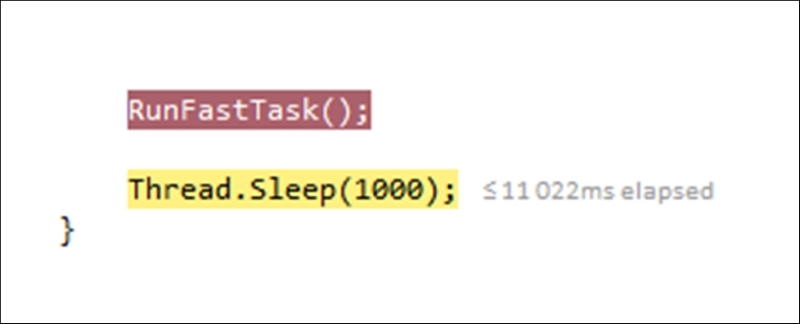
- Stepping in to the
RunFastTask()method, you can place further breakpoints and step over them one by one to find the method that is causing the longest delay. As you can see, PerfTips allow developers to quickly and easily identify bottlenecks in code: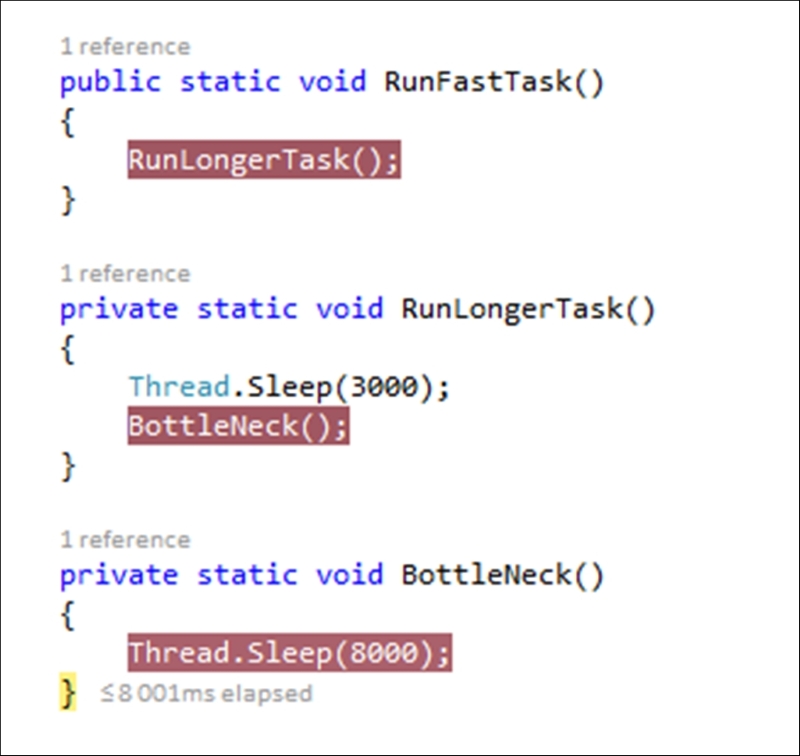
There are many tools on the market that do this and much more, allowing developers to view all sorts of code metrics. PerfTips, however, allow you to see issues on the fly while you are stepping through your code as per your normal debugging tasks. It is, in my opinion, an indispensable debugging tool.
..................Content has been hidden....................
You can't read the all page of ebook, please click here login for view all page.