The ReactiveX project is composed of several hundreds of operators, and the Python implementation contains about 140 of them. When writing ReactiveX code, especially in the early days, you should regularly refer to the operator's documentation. Do not hesitate to read through it to find the most adapted operator for your needs. This is a good way to discover operators that you may use later, and you may find an operator doing exactly what you want to implement.
Unfortunately, this documentation is often difficult to understand. A representative of this situation is the FlatMap (http://reactivex.io/documentation/operators/flatmap.html) operator description:
This simple description is—obviously—correct, but may not be easy to comprehend. This is why there is also a more detailed explanation on how the operator works. In the case of the flat_map operator, the behavior is to take an observable as input and apply a transformation on each item of this observable. The transformation is done by a function also provided as an input of the operator. This function is called for each item emitted by the input observable and returns an observable at each execution (that is, for each item). Finally, flat_map merges all the observables returned by the transformation function in a single output observable.
This is a very detailed description of how the operator works, but even when you are used to the ReactiveX terminology, you need to spend some time carefully reading each word of the documentation to understand what it means. Marble diagrams are a clever application of the a figure is worth a thousand words idiom. They represent graphically an example of the behavior of an operator. All operators are documented with their descriptions, and a marble diagram. Most of the time, the marble diagram allows you to understand the behavior of the operator without even having to read the documentation.
Figure 1.7 shows the structure of a marble diagram. A marble diagram is composed of three parts: input timelines, a transformation description, and output timelines:
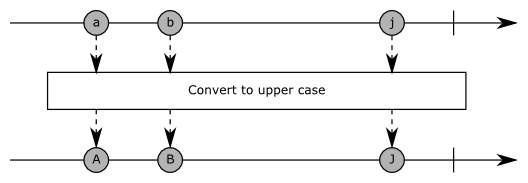
A timeline represents an observable state according to the time that goes on. It is drawn as an arrow going from left to right. Each item emitted on the observable is drawn as a circle. The official documentation uses different shapes and colors to represent items. In this book, we will only use circles with labels. Depending on the operator, there may be one or several input timelines.
Below the input timeline is the transformation description drawn as a rectangle. Some brief information about the transformation being performed is printed inside this rectangle. There are dashed arrows between the input timeline items and the transformation description each time the transformation is applied to an item or some items.
Finally, below the transformation description are the output timelines. They represent the result observables of the operator. In the example of Figure 1.7 each input letter is transformed to uppercase, so a becomes A, b becomes B, and j becomes J. Just like input timelines, most of the time there is only one output timeline. But some operators may return several observables, and some return observables of observables. This is shown in the following figure, in which for each item a new observable is generated, emitting the next three letters:
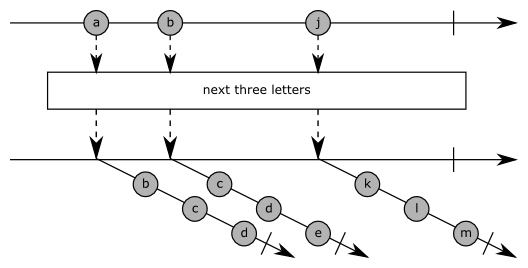
An observable of observables is an observable that emits items that are themselves observables. While this may surprise at first, this is just one level of composition; an observable can convey items of any type, including observables. So, at some point you may work with several layers of observables being composed this way. Such observables are called higher order observables in this book, borrowing the naming convention used for higher order functions.
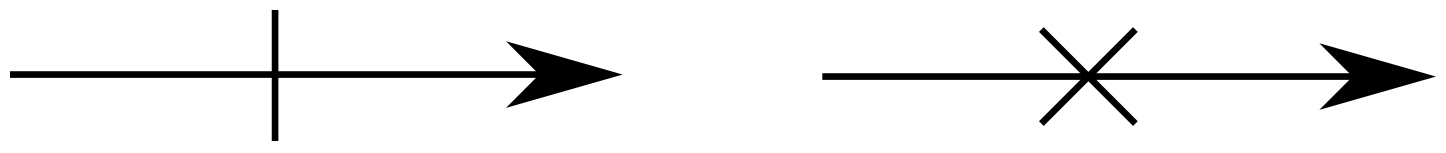
The last thing to understand in marble diagrams is the way timelines can end. An observable lifetime ends either on completion (that is, on success) or on error. These are respectively represented as a vertical line and as a cross, as shown in the following figure: