
We will complete this tour of the reactivity diagrams by writing the echo example. Its diagram is shown in the following figure:
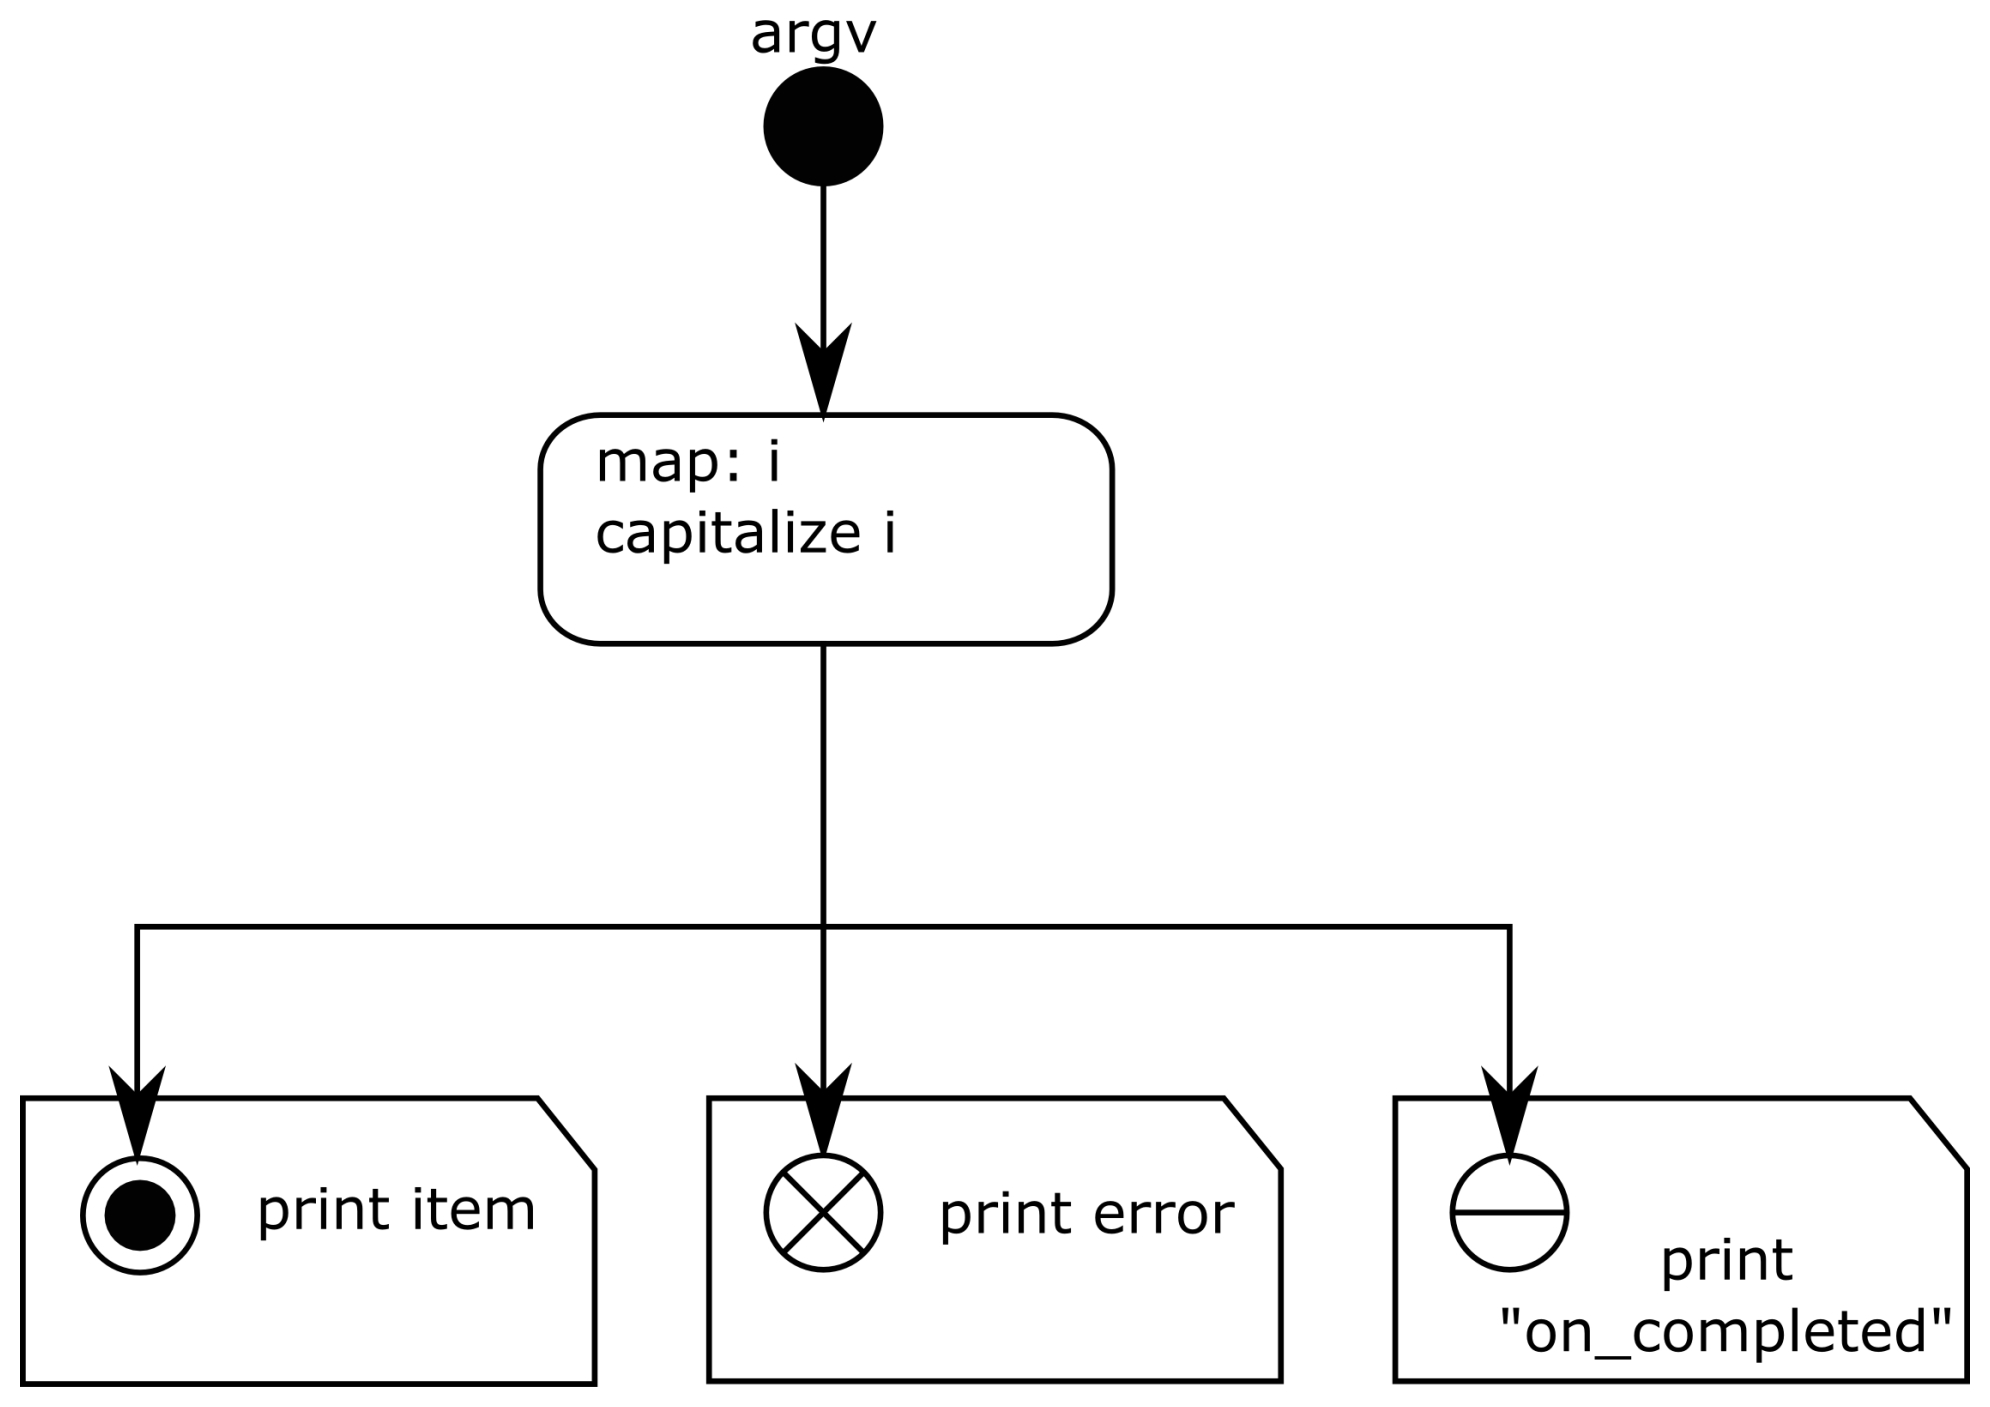
Figure 1.19: The echo app reactivity diagram
This simple diagram should allow any developer to understand what is going on, provided that he knows that it applies to each item emitted on the argv input observable. First, the input observable is created from the argv variable. Then each item is capitalized with the map operator. Finally, each event type (item, completion, or error) is printed. Note that the content of each element is not a copy of the code, but a small description of what it does. The echo example was quite simple, but in a real application you want to document the behavior with reactivity diagrams, not duplicate the code on a diagram.