
Chapter 14: Hunting and Investigating Security Incidents
This is the last chapter of the book; it has been an exciting journey and you have learned some new things. In this chapter, you can put into practice your knowledge by working on a practical case of a security incident.
Unlike the previous chapters, you will do most of the work, and you will be able to follow incident response (IR) procedures, organize activities in the incident management (IM) platform, and use different tools for hunting and investigation.
In this chapter, you will learn about the following topics:
- Responding to a data breach incident
- Opening a new IR case
- Investigating the security incident
Technical requirements
In case you haven't already, you need to download and install VMware Workstation Player from this link https://www.vmware.com/products/workstation-player/workstation-player-evaluation.html.
You'll also need to download the following from the book's official GitHub repository https://github.com/PacktPublishing/Incident-Response-with-Threat-Intelligence:
- Virtual machines:
- IR-Laptop
- SO-Platform
- Lab file:
- Chapter14
Responding to a data breach incident
Michael Scott, the chief executive officer (CEO) of a global energy company, traveled to Asia a couple of months ago to attend one of the industry's most notable events.
Recently, confidential and strategic information from the company that was in the hands of very few people—including the CEO—began to circulate publicly.
This leak of information has impacted different areas of the business and has affected some negotiations that were taking place with different companies around the world.
Some of the published information was on the CEO's computer, and now, there are suspicions that his computer could have been hacked on the last trip.
You were assigned as the lead investigator of the case, so now, you need to do first response procedures and get the necessary information from the CEO's computer to start the investigation.
Analyzing the cybersecurity incident
According to this scenario, there are several elements that we need to consider. The initial point of our analysis is about the identification of places where information is stored, and which people have privileges to access that information.
In this case, within the circle of people who have that information in their possession is just the CEO, and there are suspicions that he may have been one of the targets of this security compromise.
On the basis of the circumstances and information we have, the first device to review is the CEO's computer, without ruling out that it may be necessary to review other devices.
As a first step, we must have a meeting with the CEO to get as many details as possible to allow us to have a clearer context and focus on the type of information we are looking to obtain.
Once we have the interview, we must request the CEO's computer to perform first-response procedures.
Selecting the best strategy
Considering the circumstances of the case, it would be very useful to perform procedures to obtain disk and memory forensic images from the CEO's computer. In this way, we would be able to review all the information and have evidence that the incident could have happened during the period between his trip abroad and the time when the information leak was discovered.
In addition, it would be very valuable to obtain specific artifacts of programs installed on the computer and the preprocessed information of timelines, executed applications, information about requests to domains or Internet Protocol (IP) addresses, and some other data that would allow us to speed up the investigation and enable us to use tools to obtain this information.
Preparing for the lab
In this case, we are simulating that we got these logs directly from the suspicious computer, so we are going to start the investigation from an alert generated in the security operations center (SOC).
Before we start with the practical exercises of this chapter, we will need to prepare the work environment. First, we are going to start the SO-Platform and IR-Laptop VMs.
Note
The SO-Platform VM has a pre-installed version 2.3.100 of Security Onion. This distribution already includes its IM module, Cases, and replaces TheHive to escalate alerts.
First, start the IR-Laptop VM and sign in using the following credentials:
- Username: Investigator
- Password: L34rn1ng!
After that, start the SO-Platform VM. You do not need to sign in here for now.
Once you start both VMs, go to IR-Laptop and proceed as follows:
- Open a Terminal console with administrator privilege, by pressing Shift and right-clicking on the Windows Terminal icon, and then click on Run as administrator, as shown in the following screenshot:

Figure 14.1 – Opening Windows Terminal as administrator
Note
We are opening Windows Terminal as an administrator because you may require elevated privileges to perform some exercises.
- Open a new Windows Subsystem for Linux (WSL) Terminal by clicking on the down arrow button at the top to display a drop-down menu and select Ubuntu-20.04, as shown in the following screenshot:
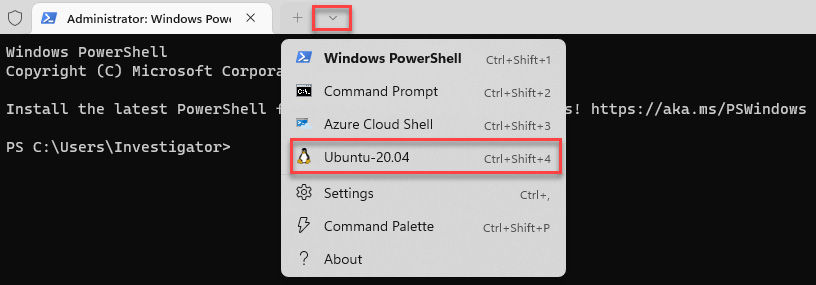
Figure 14.2 – Opening a new Linux Terminal
- As you used the IR-SOAR VM in Chapter 11, Integrating SOAR Capabilities into Incident Response, you will use the SO-Platform VM in this chapter, and both use the same IP address, you will need to flush the Secure Shell (SSH) keys first by running the following command:
ssh-keygen -f "/home/investigator/.ssh/known_hosts" -R "192.168.8.5"
- Switch to the /mnt/c/Users/Investigator/Workspace/Labs/Chapter-14 directory.
- Connect by SSH from the IR-Laptop VM (IP address 192.168.8.150) to the SO-Platform VM (IP address 192.168.8.5), providing the following credentials:
- Username: ssh [email protected]
- Password: P4cktIRBook!
- Once you are connected, create repositories where you are going to save the files related to some artifacts collected in the cybersecurity incident, as follows:
mkdir logfiles
mkdir pcapfiles
You can verify the created directories by running the ls -l command, as shown in the following screenshot:
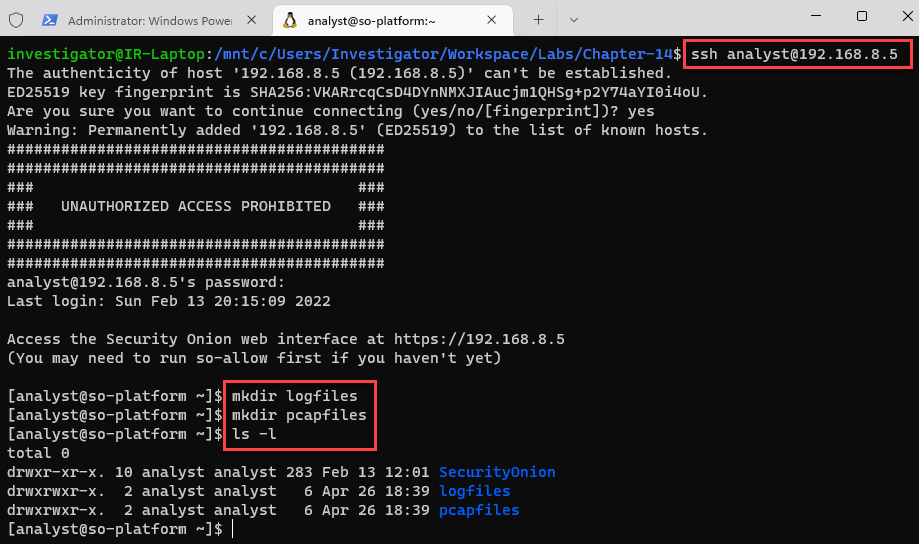
Figure 14.3 – Connecting to SO-Platform using SSH and creating evidence repositories
- It is important to be sure that all services on Security Onion are up, so review the status by entering the so-status command providing the analyst password (P4cktIRBook!), as shown in the following screenshot:
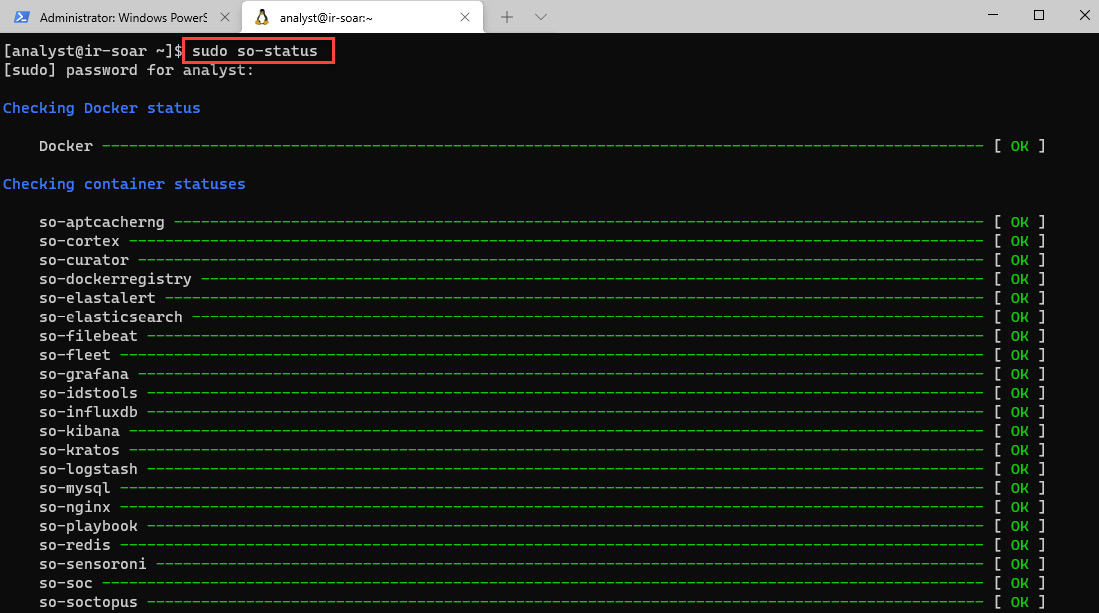
Figure 14.4 – Validating the status of services
Once all the container statuses are showing a status of OK (this could take some time, so you can use the up arrow to keep checking the status of Security Onion services), we can now connect to the Security Onion management console.
- Open a web browser and connect to the following address: https://192.168.8.5. Then, provide the [email protected]/L34rn1ng! credentials, as shown in the following screenshot:
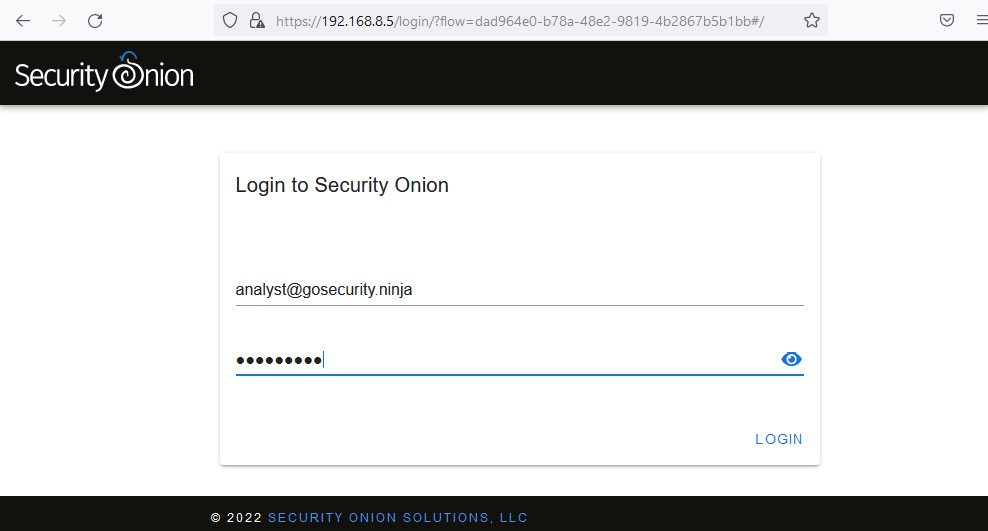
Figure 14.5 – Logging in to the Security Onion web interface
Note
You might get a privacy error, as follows:
Brave: Your connection is not private. Click on Advanced. Next, proceed to 192.168.8.5 (unsafe).
Firefox: Warning: Potential Security Risk Ahead. Click Advanced…. Next, click on Accept the Risk and Continue.
Microsoft Edge: Your connection isn not private. Click on Advanced. Next, continue to 192.168.8.5 (unsafe).
At this point, you can start working with Security Onion to import system logs and network capture files.
Copying and importing evidence files
One of the features of Security Onion is the possibility to import system logs and network capture files for analysis from systems where you do not have Security Information and Event Management (SIEM) visibility or network monitoring. Here's how you can do this:
- From the book's cloud repository, download the Chapter-14 folder.
- Copy the content of this folder to your IR-Laptop VM and paste it under the C:UsersInvestigatorWorkspaceLabsChapter-14 directory.
- Under the Chapter-14 directory, right-click on the AD-SRV_Logs.7z file.
- Select Show more options.
- Select the 7-Zip option.
- Finally, select Extract Here.
Repeat the same process to extract the Corp-Laptop_Logs.7z and Network_Captures.7z files.
The process is illustrated in the following screenshot:
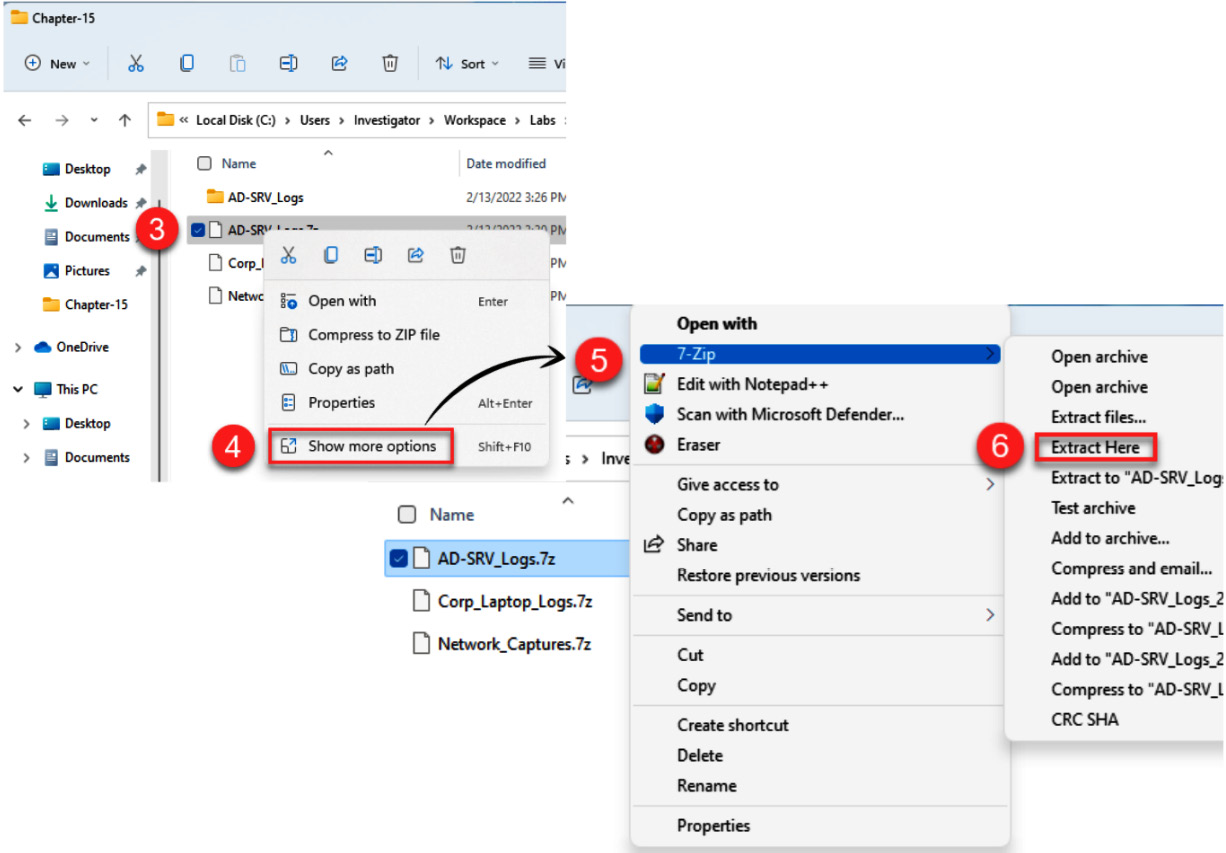
Figure 14.6 – Extracting evidence files
Now that we have extracted the needed files for the exercises, we will import these files into the SO-Platform VM.
- On the Windows/WSL Terminal, log off your current connection from the SO-Platform VM by running the following command:
logout
- Switch to the AD-SRV_logs directory:
cd AD-SRV_Logs
- Verify the content of the directory by running the following command:
ls -l
- Copy all files from the AD-SRV_Logs folder to the directories on the SO-Platform VM created previously:
scp -r AD-SRV_Logs [email protected]:/home/analyst/logfiles/
This is shown in the following screenshot:
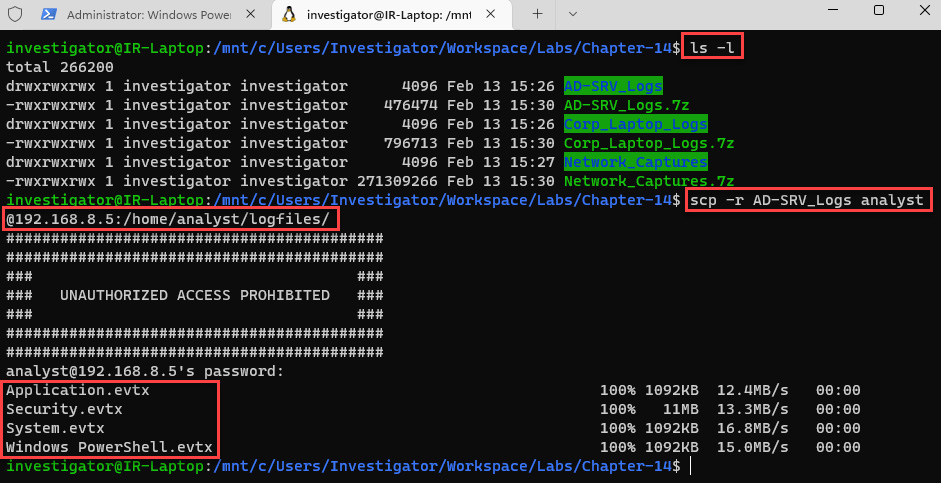
Figure 14.7 – Opening a new WSL Terminal
- Repeat the same procedure to copy the Corp_Laptop_Logs directory, as follows:
scp -r Corp_Laptop_Logs [email protected]:/home/analyst/logfiles/
- Now, copy the network captures directory, as follows:
scp -r Network_Captures [email protected]:/home/analyst/pcapfiles/
The last command can be seen in action in the following screenshot:
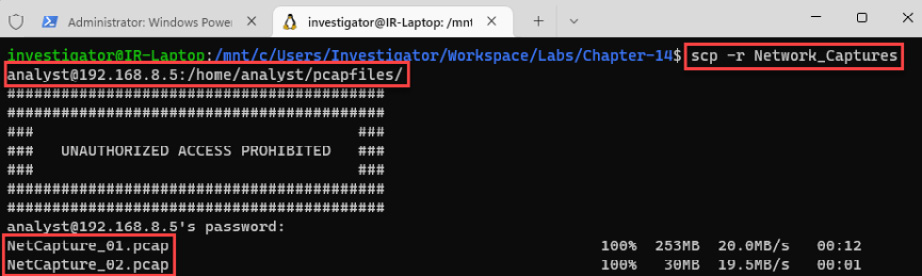
Figure 14.8 – Copying network traffic files
- Once you finished the copying the files, log on again to the server using the usual credentials, as follows:
- Username: ssh [email protected]
- Password: P4cktIRBook!
Now that you have the files on the server, you can start importing them into Security Onion.
- To import the network files into Security Onion, first switch to the pcapfiles/Network-Captures directory by running the following command:
cd pcapfiles/Network_Captures/
- Import the files by running the following command:
sudo so-import-pcap NetCapture_01.pcap NetCapture_02.pcap
The command and its output are shown in the following screenshot:
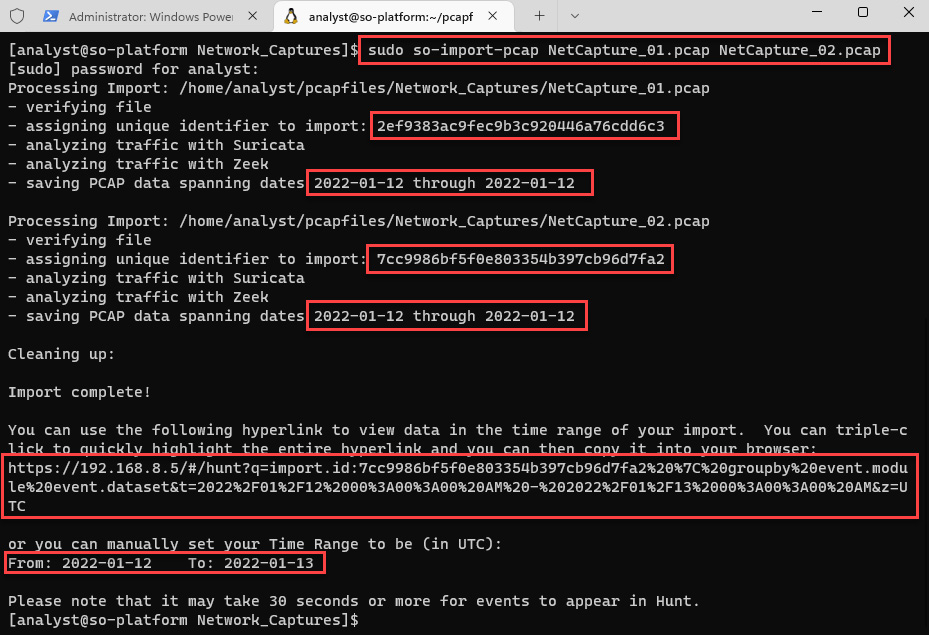
Figure 14.9 – Importing network traffic files
Once the process has been completed, you will see a unique identifier (UID) assigned to this import and a specific link to access directly information regarding the processed files. You can save this specific information in a text file for further revisions.
- To start analyzing the content of these network packages, you can copy and paste the provided link on the navigation bar of your web browser. You will see the import ID and the filter applied, as shown in the following screenshot:
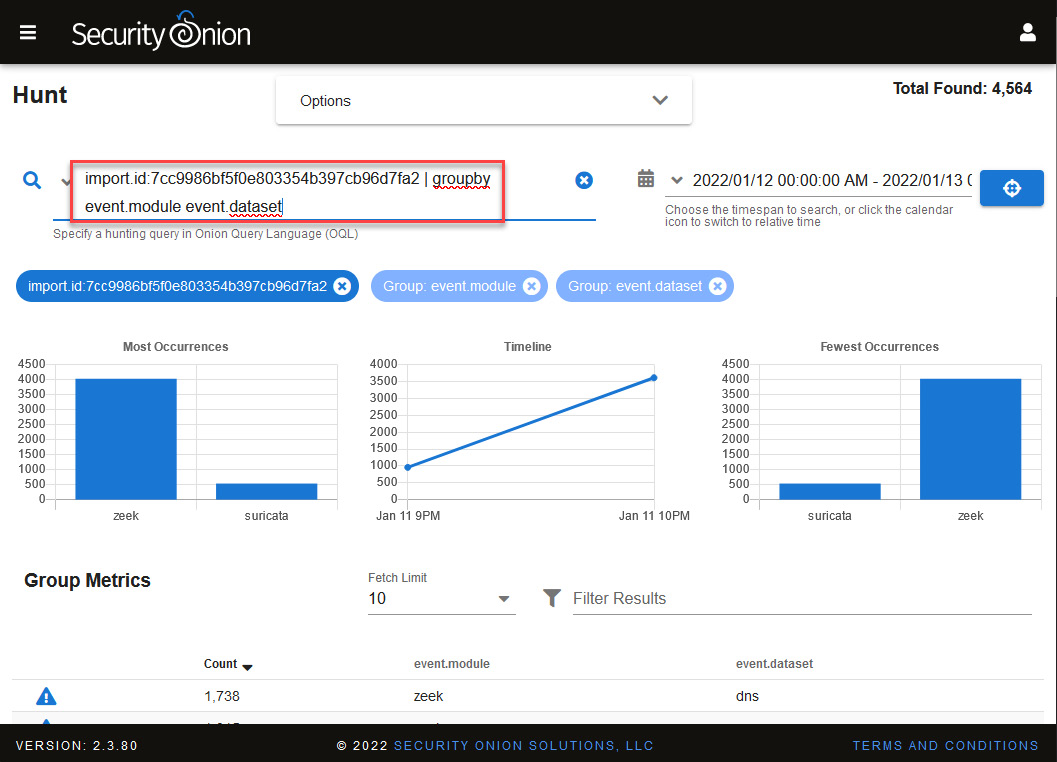
Figure 14.10 – Visualizing data generated from the import
This could be a good point to start an investigation because you can focus on this information directly.
- To import the log files, repeat the same procedure, switching to the /home/analyst/logfiles/AD-SRV_Logs directory and running the following command:
sudo so-import-evtx Application.evtx Security.evtx System.evtx 'Windows PowerShell.evtx'
Note
Linux is a case-sensitive operating system (OS); please ensure that you enter filenames, including directories, in the correct case.
- Now, switch to the /home/analyst/logfiles/Corp_Laptop_Logs directory to import the log files from here, as follows:
sudo so-import-evtx Application.evtx Security.evtx System.evtx Microsoft-Windows-Sysmon%4Operational.evtx "Windows PowerShell.evtx"
As I mentioned before at the beginning of this chapter, the point at which we will start this IR case is from an alert generated in the SOC, so we will prepare our scenario to start the investigation.
Starting the investigation
After we have imported the logs and network files into our SO-Platform VM simulating the capture of traffic and log collection from the organization, we need to define a date range related to the incident. Here's how to do this:
- On Security Onion, click on the Alerts panel.
- To filter by date, click on the Time Picker functionality, just to the left of Last (clock with an arrowed circle), Next, click the date range section, then the custom range to be investigated, as follows:
- January 10 to 14, 2022
- 12:00:00 AM - 11:59:00 PM
You will do the same for all hunting and investigation processes. The following screenshot provides an overview of the preceding steps:
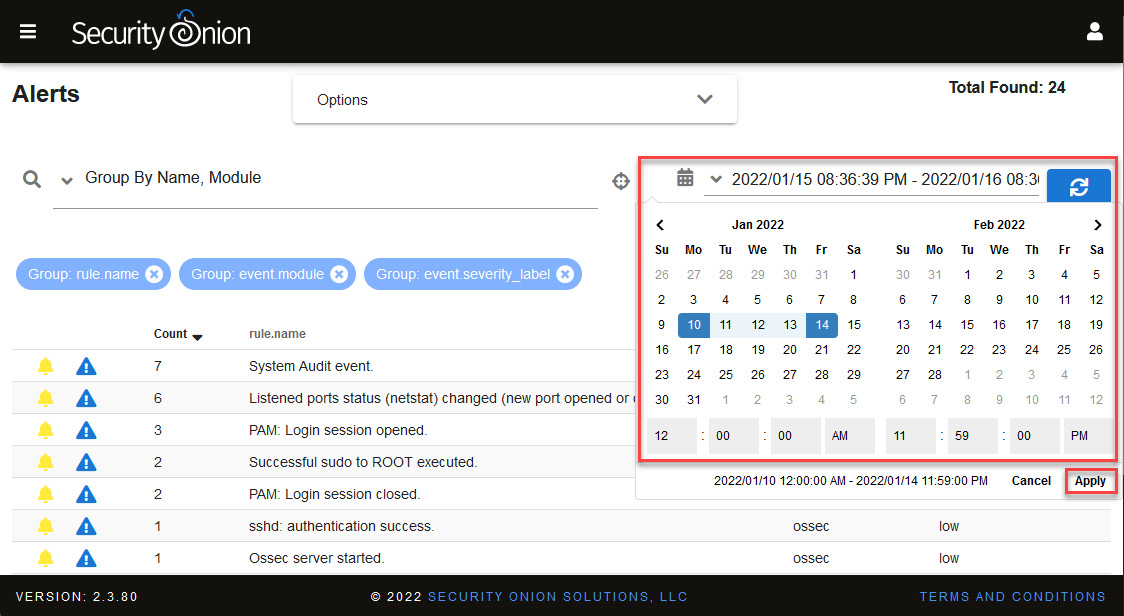
Figure 14.11 – Filtering by date range
When you apply this filter, you will see several alerts with the severity level classified as high and other alerts with severity classified as medium; for now, we will focus on the following alerts:
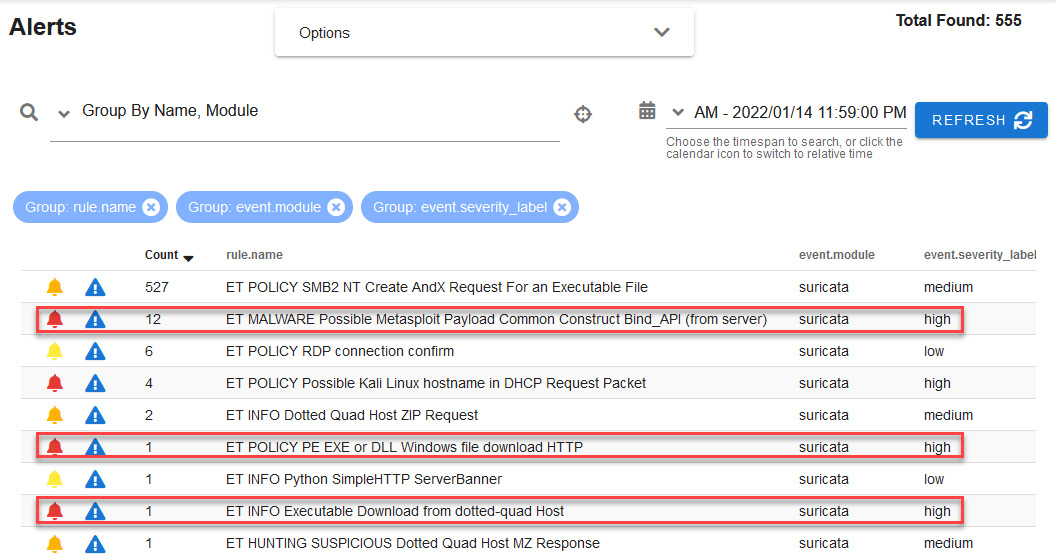
Figure 14.12 – Prioritizing security alerts by their level of severity
The first alert that catches our attention is related to an apparent detection of possible malware related to a Metasploit payload.
- To start investigating this alert, click on the detection rule name, expand the Actions option, and select Hunt (be sure to verify that the date range is established, as indicated in the previous section), as illustrated in the following screenshot:
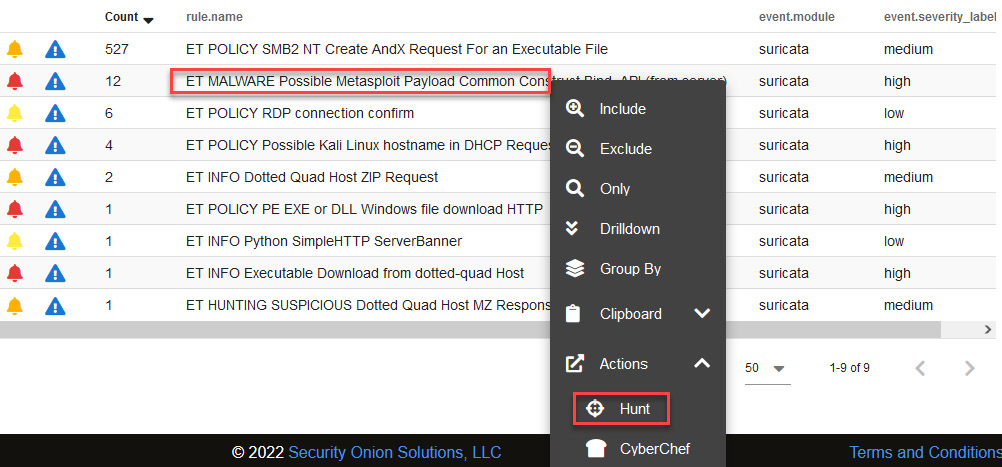
Figure 14.13 – Starting an investigation from an alert
You will see an Events list related to this alert, as illustrated in the following screenshot. You can take a different approach here; for instance, you can start looking for information by reviewing events by the most recent date or by the date closest to the start of the incident. In this case, we are interested in initiating an investigation by the date closest to the beginning of the incident:
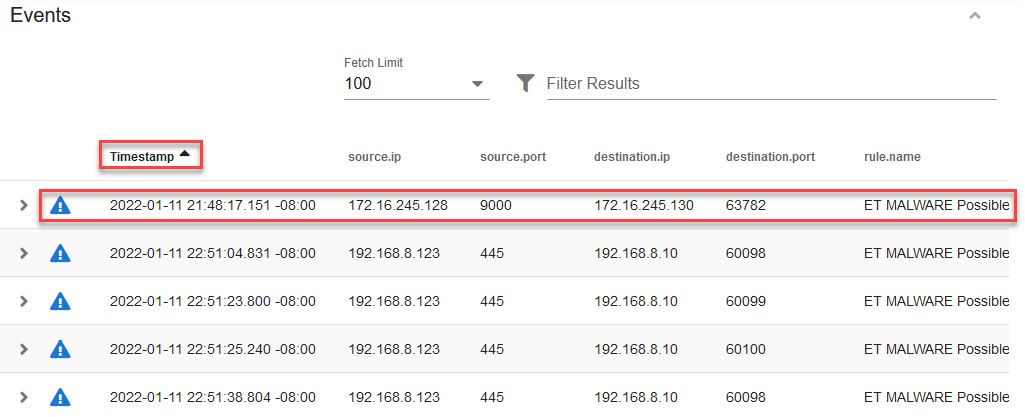
Figure 14.14 – Events view ordered by oldest events
When you identify and want to analyze a particular event, it is very useful to correlate with other activities carried out around that event. Security Onion takes several components of information such as IP addresses, among other things, to generate a single hash and thus correlate different pieces of information.
- Scroll to the right side of the dashboard until you see the network.community_id column and click on the hash to display the contextual menu.
Select Actions and then the Correlate option, as illustrated in the following screenshot:
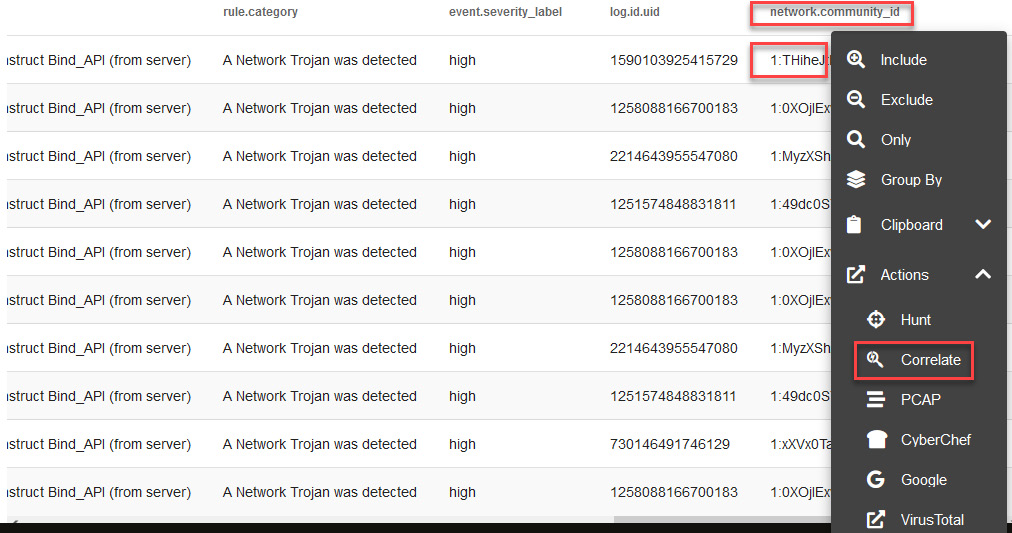
Figure 14.15 – Correlating information regarding an event
As a result, you will see a timeline of correlated events; in the first event, there is a connection from the victim's computer to port 9000, and after that, interaction with a Python SimpleHTTPServer to download several files, and finally, a Metasploit payload, as shown in the following screenshot.
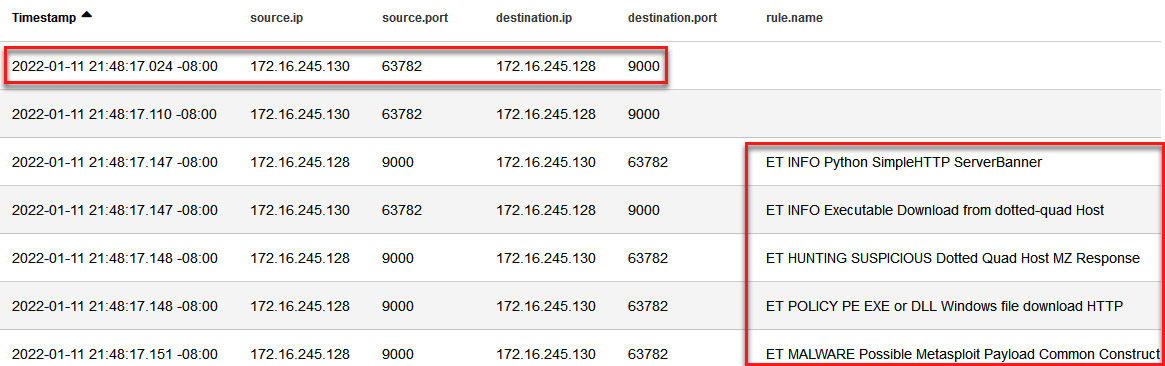
Figure 14.16 – Timeline of correlated events
Click on the first event under the destination.port field, and then click on Actions and PCAP to view the network traffic, as shown in the following screenshot:
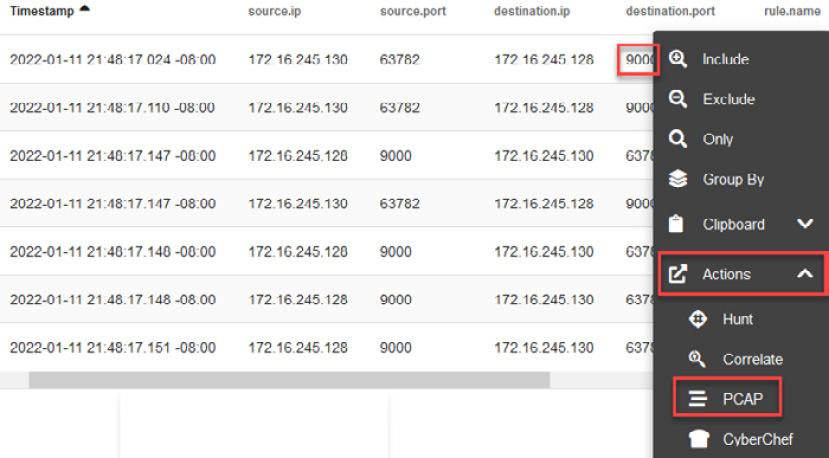
Figure 14.17 – Opening the packet capture (PCAP) of a specific event
You will see all the traffic between the victim's computer—172.16.245.130 —and the potential attacker's computer—172.16.245.128.
- Filter the view to see unwrapped packets from the encapsulation, clicking on the Show all Packets and Include hexadecimal representation buttons to deselect them, as shown in the following screenshot.
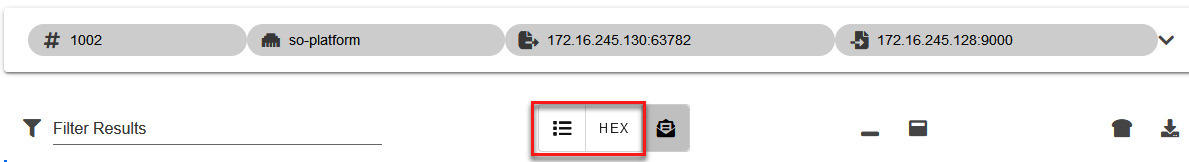
Figure 14.18 – Showing only unwrapped packets
Once you modify the view, you will see the contents of the packages clearly and identify some interesting elements, such as the following:
- A file called TradeAPP_Windows.exe was downloaded via http from a 172.16.245.128:900 address using a GET command.
- You can also see that the remote server is a Python SimpleHTTP server and the content of the traffic is an executable file.
These findings are indicated in the following screenshot:
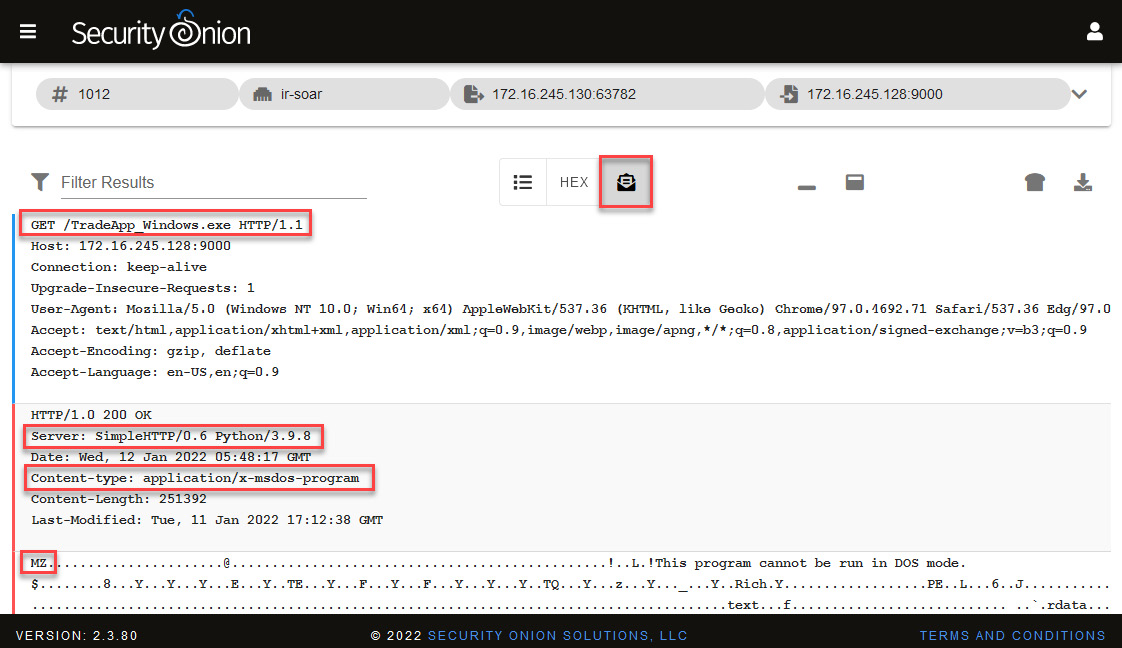
Figure 14.19 – Analyzing the content of the PCAP
As the server is within the same network segment of the hotel and as suggested by the characteristics of the communication, it could be an initial attack vector and a potential target.
Although this panel is very useful to start an analysis, you can use tools that have more advanced functionalities—for example, to deobfuscate or decrypt content.
As this is a Windows executable file, we can send these packages to CyberChef to try to get the malicious file for further analysis.
Note
CyberChef is a very powerful tool that we can use to create recipes to simplify the removal of these two HyperText Transfer Protocol (HTTP) headers, giving us a clear visualization of the information that we need to save.
- Click on the Send the transcript to CyberChef button, as shown in the following screenshot. This will open a new CyberChef tab on your web browser with the content of the PCAP:
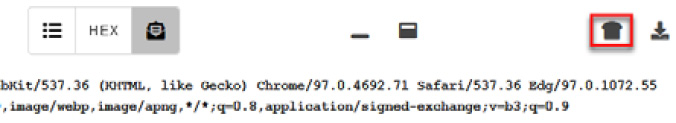
Figure 14.20 – Sending the PCAP content to CyberChef
In the same way, you can also download the PCAP file to be analyzed in other network packet analysis applications such as Wireshark or NetworkMiner (you can learn how to use both tools in the Code in Action video).
To filter packages, you need to remove the HTTP content to leave only binary content in CyberChef:
- In the Operations textbox, write the word strip to filter the options.
- Drag the Strip HTTP headers field to the Recipe section. This will remove the first HTTP header, then do this again to remove the second HTTP header. Now, you should be left with a line starting with MZ.
- Click on the Save output to file button.
- Change the name of the file to susp_file_01.dat and click the OK button to save the file.
The process is illustrated in the following screenshot:
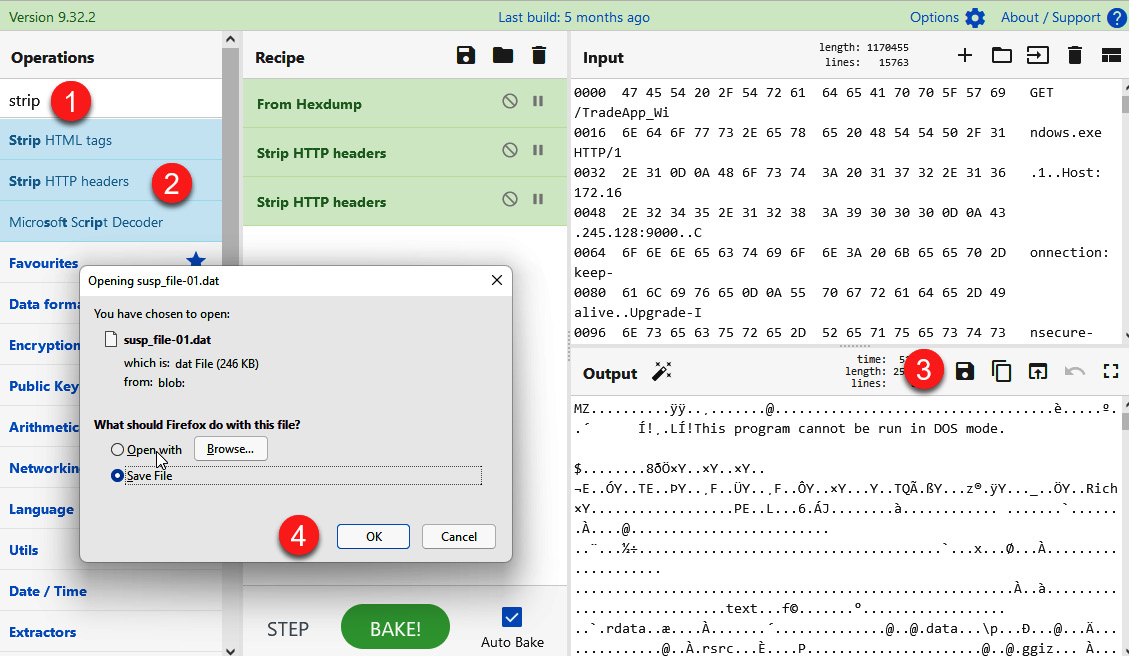
Figure 14.21 – Saving the executable file
We now have the sample of potential malware, and we can review it to identify its functionality.
Note
You may need to disable Windows Defender beforehand because it could catch this malware sample.
- Move the downloaded file to the following path: C:UsersInvestigatorWorkspaceLabsChapter-14.
- Open pestudio.exe from C:UsersInvestigatorWorkspaceToolspestudio.
- Drag the susp_file_01.dat file to the pestudio interface.
You will see the content of the binary file, as shown in the following screenshot:
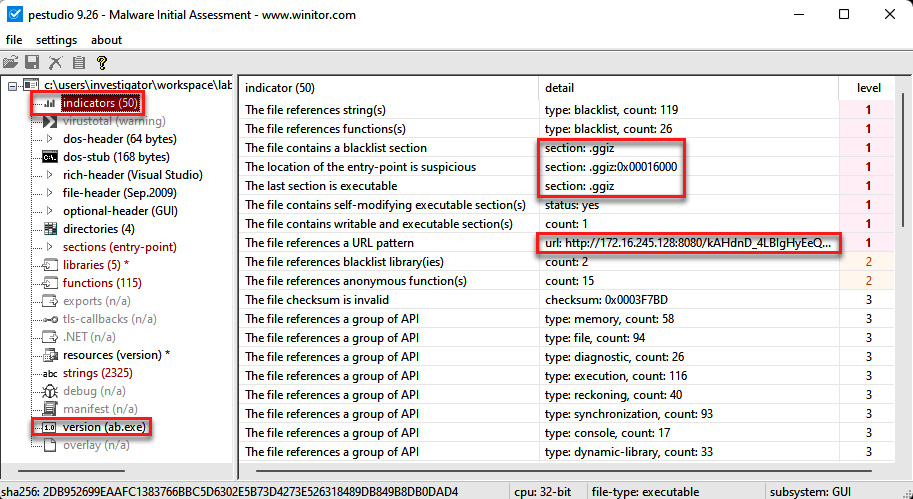
Figure 14.22 – Analyzing the content of the susp_file_01.dat file
Here, you will find interesting things; for instance, on indicators, you will see section contents tagged as blacklisted or suspicious. You will also see a Uniform Resource Locator (URL) where this file could connect once executed.
- Now, click on sections (entry-point), as shown in the following screenshot:
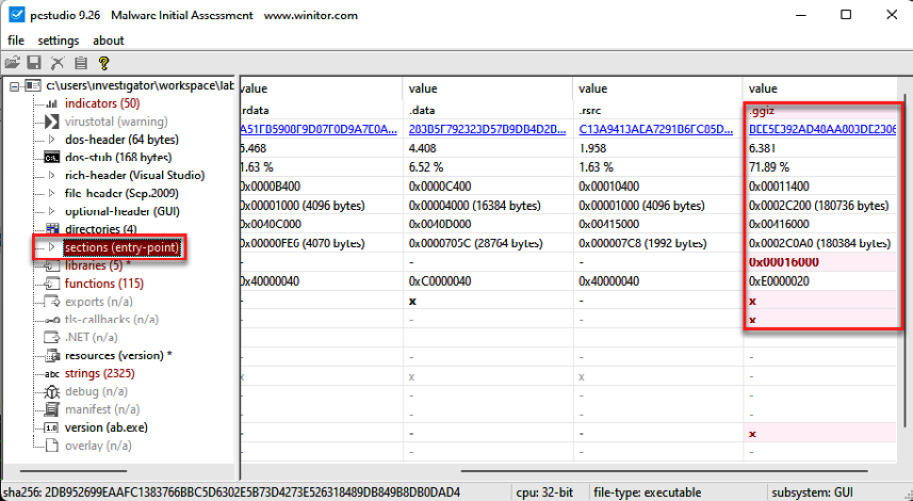
Figure 14.23 – Looking for suspicious sections (entry points)
You will see a suspicious and anomalous section called .ggiz. It is not common to find these types of sections in normal executable files.
- Now, click on strings, and you will see a lot of strings within the file that can provide valuable information about the behavior or content of the file, as shown in the following screenshot:
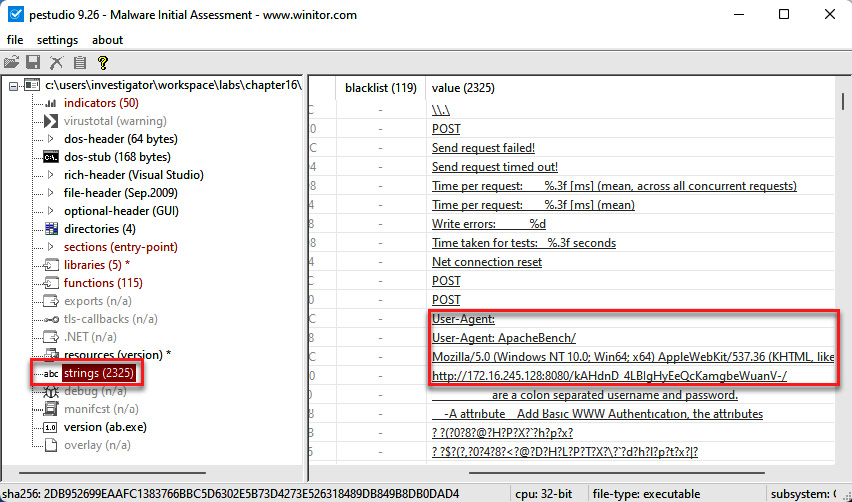
Figure 14.24 – Identifying strings within a file
Note
Sometimes, malware can be packaged in such a way that the number of strings that can be identified is very small and may not provide much information.
Some strings displayed show indicators related to programs generated in Metasploit. Additionally, you can see the URL to which this malicious file would try to connect.
- Scroll down in the strings section to find other relevant information.
At this point, it would be a good idea to create a YARA rule from this file to search on other devices on your network to see whether this file is present and ascertain the number of devices compromised with this implant. This is an important step in the first two phases of IR: identify and contain.
Try to do this yourself with what you've learned. Here's how:
- Create a YARA rule based on the strings found in the implant.
- Test the YARA rule on your IR-Laptop VM to validate that it is effective and does not detect false positives.
Now that we have verified malicious activity on at least one of the systems, we will open a new case on the IR platform built into Security Onion to formally initiate the investigation process.
Opening a new IR case
Once we validate that this malicious file is related to the incident, we will open a new case from the alert, using the new Cases tool integrated into Security Onion. Here's how to do this:
- In Security Onion's Alerts console, on the ET MALWARE Possible Metasploit Payload Common Construct Bind_API (from server) event, click on the Escalate button, then select Escalate to new case (remember to filter based on date, as you did in the Starting the investigation section of this chapter), as illustrated in the following screenshot:
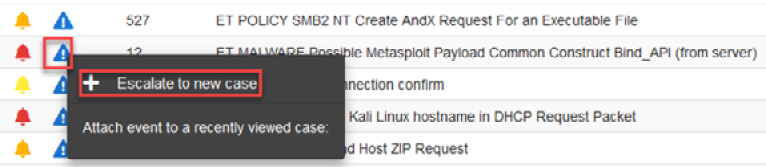
Figure 14.25 – Escalating an alert to create a new case
- Go to the Cases panel on Security Onion, and you will see listed the recent case created, as shown in the following screenshot:
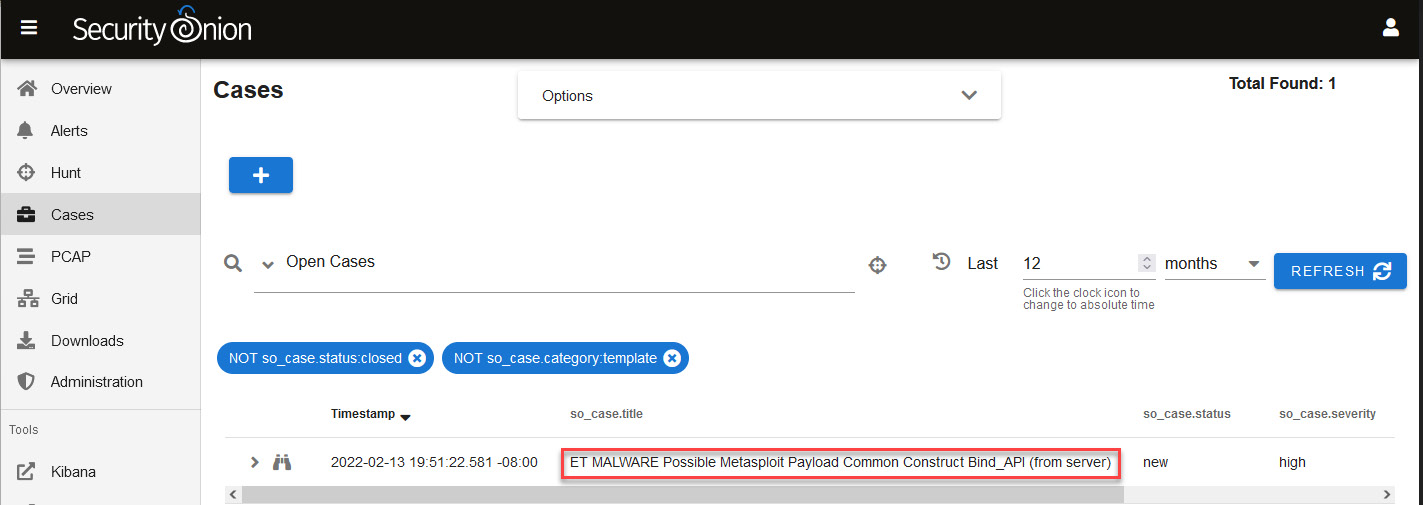
Figure 14.26 – Looking for cases in the Cases panel

Figure 14.27 – Opening a case
You will see the case management interface where you can start assigning tasks—including evidence and observables—and documenting the investigation, as shown in the following screenshot:
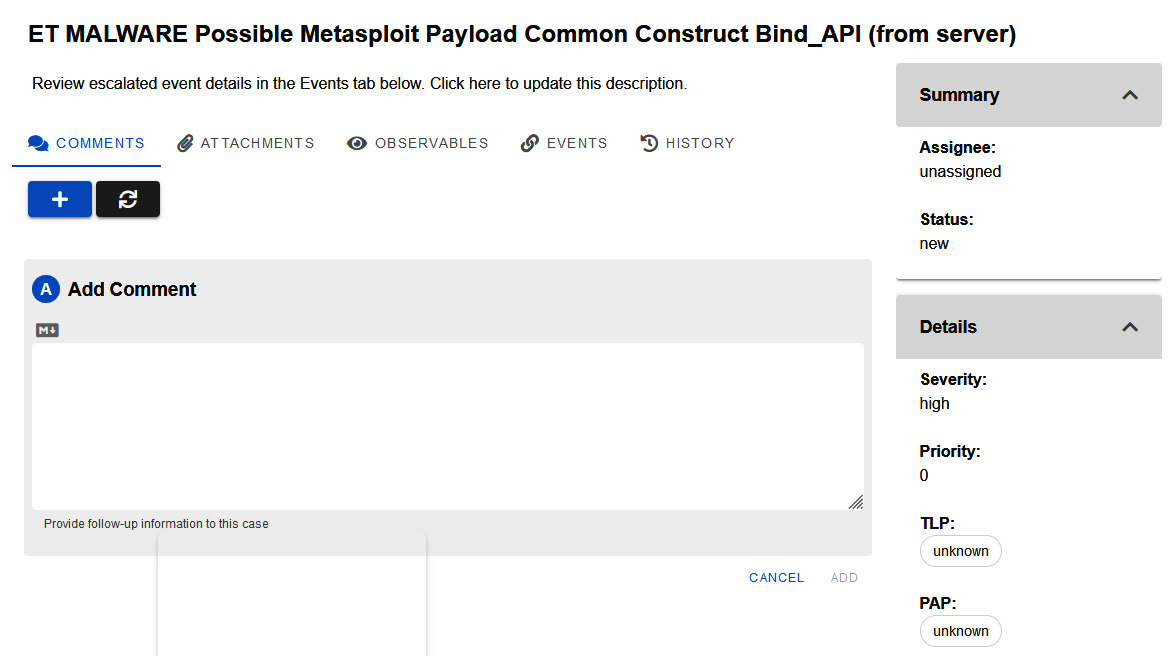
Figure 14.28 – Case management interface
As this incident is about an information leak, not just malware, you need to modify the default incident's name.
- Click on the incident name to enter into Edit mode.
- Change the name to 202201-IR-Data_Leak_Incident, and click on the SAVE label.
You can also add a description of the incident by just clicking on the Click here to update this description section.
You can see an illustration of the process in the following screenshot:
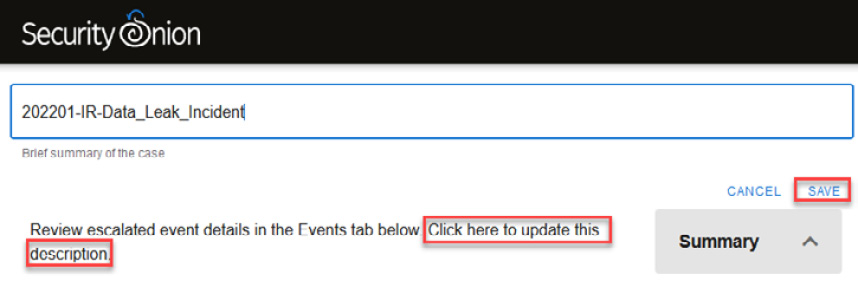
Figure 14.29 – Changing the name and description of a case
We are going to add the first observable of the case. This will be the Message Digest 5 (MD5) and Secure Hash Algorithm 256 (SHA256) hashes of the malicious file.
- Click on the OBSERVABLES label.
- Click on the blue plus (+) button.
- Expand the classification list.
- Finally, select the hash option.
- Add the MD5 and SHA256 hashes of the file. (You can copy these hashes from pestudio by clicking on the filename, including the path at the very top of pestudio. Next, right-click on either md5 or sha256 and then copy the value(s).)
- Add a description of the observable.
- Check the box above Enable this field if this is an Indicator of Compromise.
- Define the Traffic Light Protocol (TLP) as red.
- Add confirmed and malware tags.
- Click on the ADD button to save the changes.
You can see an overview of the process in the following screenshot:
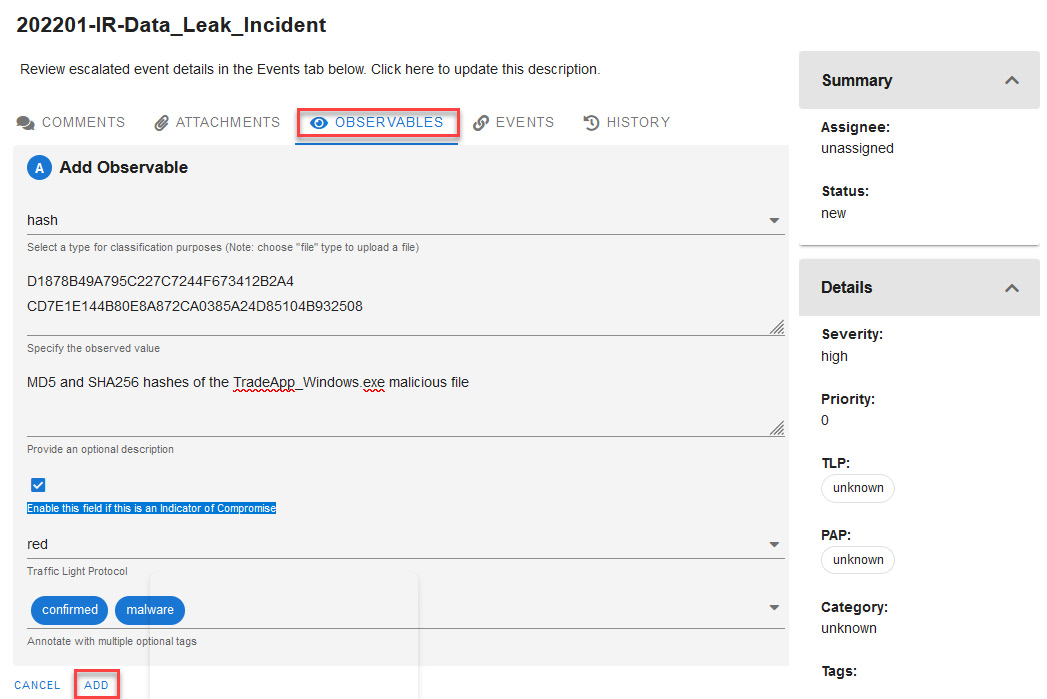
Figure 14.30 – Adding a new hash observable
Now, try for yourself by adding a new file-type observable and uploading the malicious file; this is important because you may need to share it with other teams for further analysis.
I recommend that you compress the malicious file in 7-Zip (.7z) format with a password of infected (without quotes) to prevent it from being accidentally executed or deleted by antivirus software.
Investigating the security incident
Now that we have the vector of compromise, we can continue our investigation by looking for evidence about what happened after the initial compromise. Proceed as follows:
- Go to the Alerts panel on Security Onion.
- On the Options menu, click to open the list and select Acknowledged and Escalated to see an alert regarding the malware, as shown in the following screenshot:
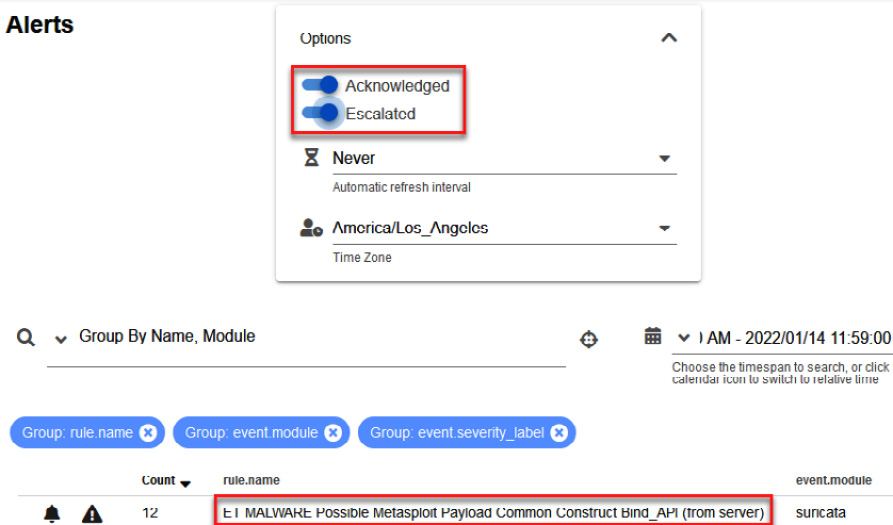
Figure 14.31 – Filtering to show cases created from alerts
- To see details about this alert, click on the rule.name column and select Actions then Hunt (remember to filter by date, as you did before).
You will see a list of events associated with this alert again; because we already analyzed traffic related to port 9000 communication, we can now try to investigate traffic related to port 445.
- Click on the second event that connects from port 445, then Actions, and then click on PCAP, as shown in the following screenshot:
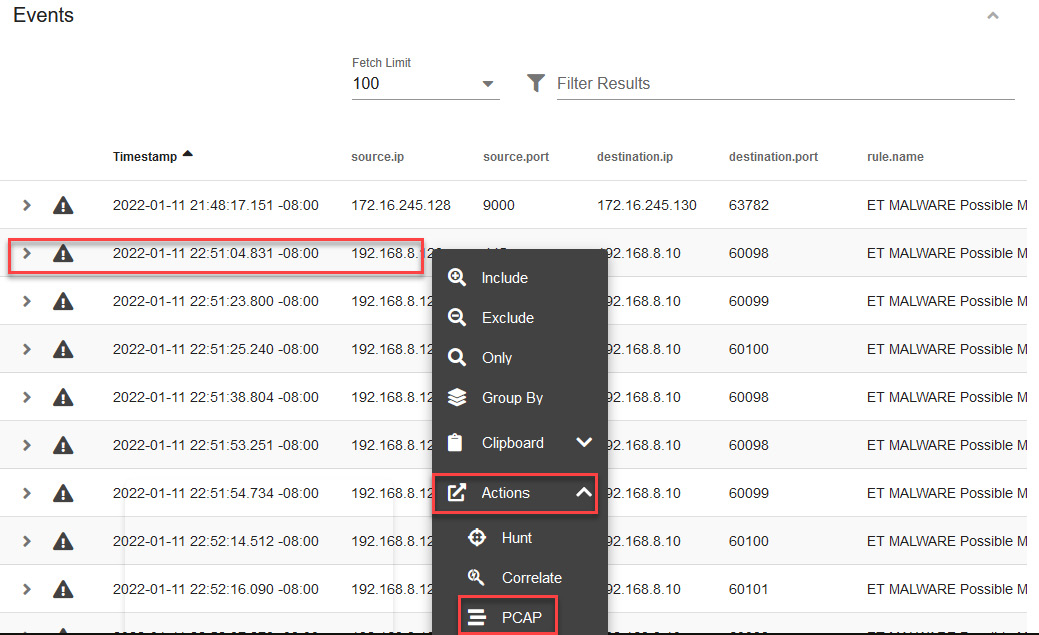
Figure 14.32 – Opening a new PCAP from an event
You will see unwrapped network packages, identifying some interesting strings. As in the previous section, we will use CyberChef to have a better visualization.
- Click on the CyberChef button at the top of the dashboard, as shown in the following screenshot:
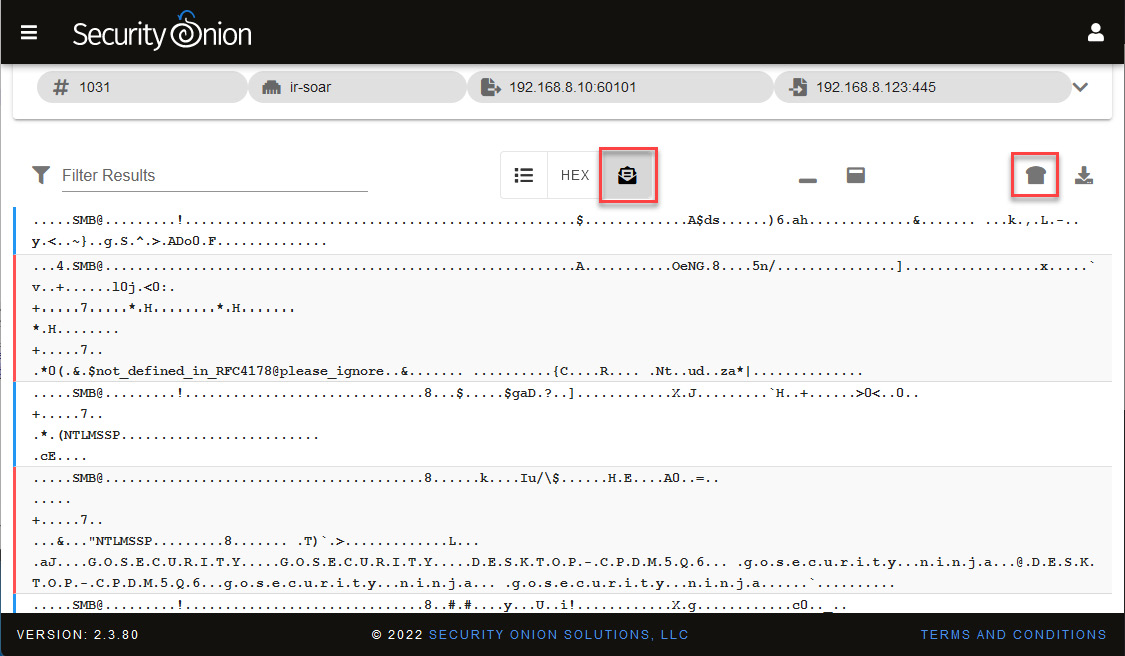
Figure 14.33 – Analyzing network traffic in unwrapped mode
This will open CyberChef in a new tab of your browser with the information obtained from Security Onion.
- In the Operations section, type the word strings in the text field, drag this operation to the Recipe section, and select All on the Encoding list, as shown in the following screenshot:
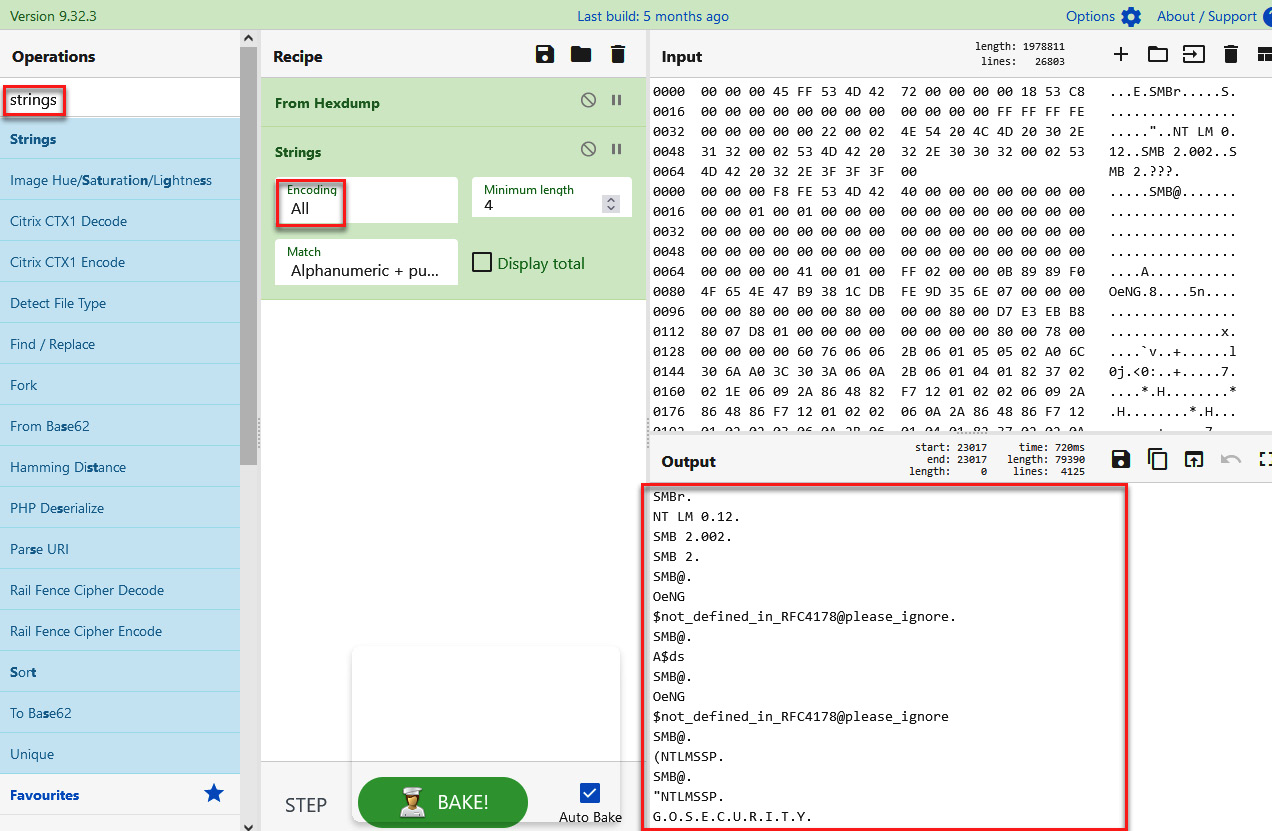
Figure 14.34 – Analyzing PCAP content on CyberChef
At first glance, we can identify some interesting strings.
- Scroll down, and you will see what seems to be a New Technology LAN Manager (NTLM) authentication process of the admin01 user from the Desktop-CPDMSQ6 computer of the gosecurity.ninja domain to the WIN-AIR09F7CBLS7 server, as illustrated in the following screenshot:
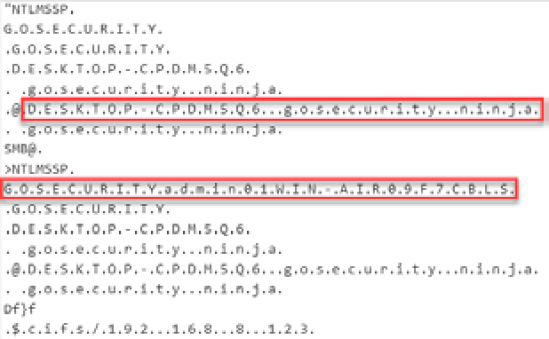
Figure 14.35 – Analyzing the strings of a network package on CyberChef
- Continue scrolling down and identify additional information that could be valuable for your investigation, such as other programs or files and what you think this means, according to the context of the case.
To get more context about the incident, you request information from the Information Technology (IT) department about the domain the admin01 user found previously in the network traffic strings. They mentioned that this is not a known user of the system.
It is possible that this account was created by threat actors to maintain persistence, and it could also mean that there is a possible previous compromise of some accounts with administrator privileges, so it is a good idea to look for information related to this account and all activities that were performed with it.
Using Sigma rules to find a user creation event
We will start our hunting by using a Sigma rule from the Playbook platform on Security Onion. On the left menu of Security Onion, under Tools, select the Playbook option, as shown in the following screenshot:
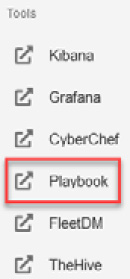
Figure 14.36 – Opening the Playbook tool from Security Onion
We can create a new Sigma rule from scratch, as you learned in the previous chapter, you can use a Sigma rule from the Detection Playbooks platform in Security Onion, or you can search for Sigma rules externally.
In this case, we can assume that a user may not have been created using Active Directory Users and Computers (ADUC) Microsoft Management Console, so we will use a Sigma rule that detects the creation of local user accounts on this system that are not in Active Directory (AD), published in the following blog: https://www.patrick-bareiss.com/detecting-local-user-creation-in-ad-with-sigma/.
In this blog, you will find a Sigma rule that detects Event 4720 on a non-domain controller computer, so it is perfect to use in this case.
On the Detection Playbooks platform, proceed as follows:
- Click on the Create New Play option.
- Copy the Sigma rule from the blog post and paste it into the Sigma rule section.
- Click on the Convert button.
On the right side of the dashboard, you will now see the converted rule.
- Click on the Copy button.
The preceding interface is shown in the following screenshot:
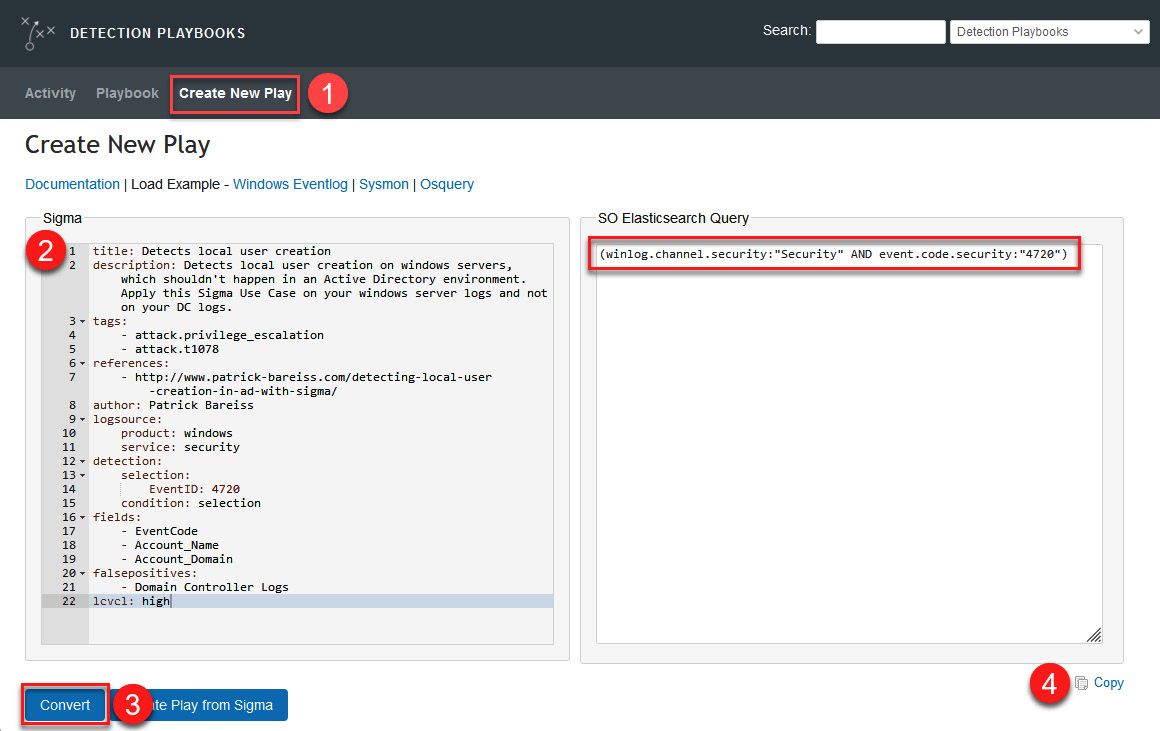
Figure 14.37 – Converting a Sigma rule to an Elasticsearch query
- You can use this query to search directly in the Hunt section of Security Onion, or you could also search on the Kibana dashboard. In this case, we are going to do it in the Hunt dashboard of Security Onion.
From the menu on the left side of Security Onion, select the Hunt option, as shown in the following screenshot:
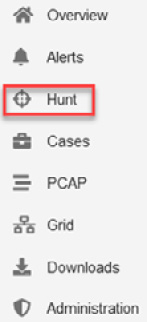
Figure 14.38 – Opening the Hunt dashboard
- Paste the query created from the Sigma rule into the Search section, making sure that the date range filter is defined appropriately, as shown in the following screenshot:
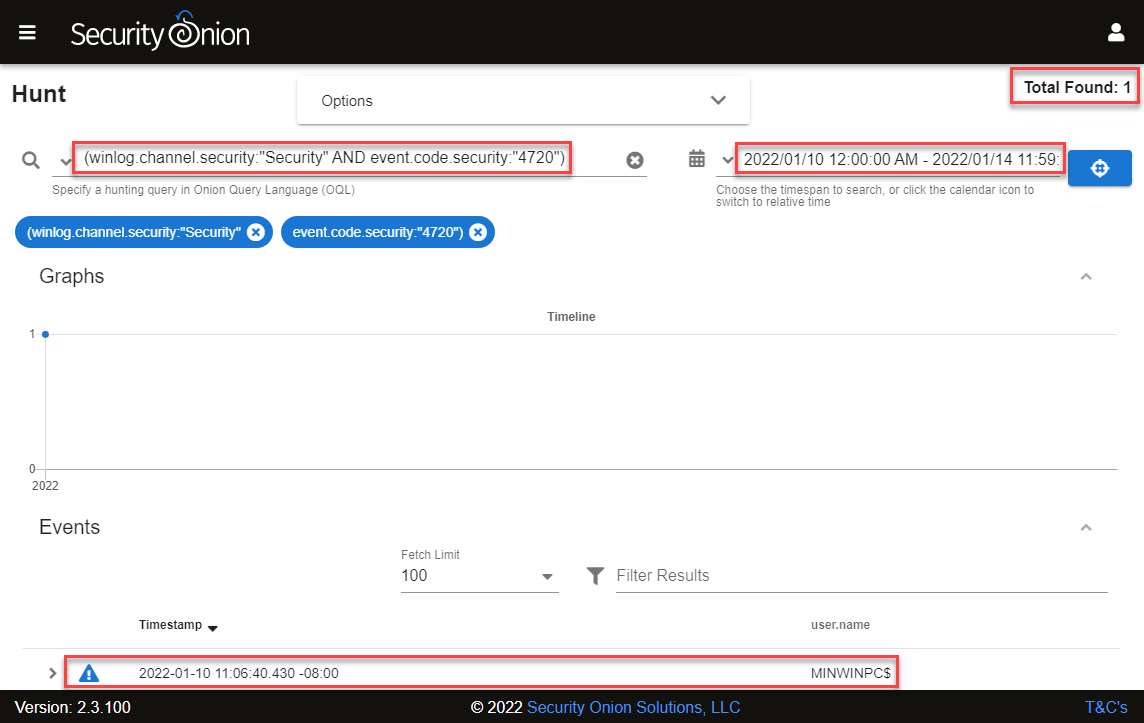
Figure 14.39 – Looking for security events with code "4720"
- You will see an event generated by the user creation.
- Click on the Timestamp dropdown to sort events so that the oldest ones appear first, and then display the content of the first event by clicking on the arrow that appears on the left side of the event, as shown in the following screenshot:
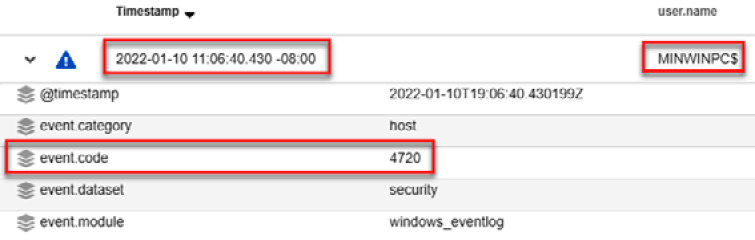
Figure 14.40 – Analyzing the details of a log event
As you will notice, the event code corresponds to the creation of a new user, and this account was created by the MINWINPC$ user, so we are verifying that that account was compromised.
- Scroll down to collect more information; you will identify the name of the WDAGUtilityAccount created account and some other details that make it look suspicious, as shown in the following screenshot:
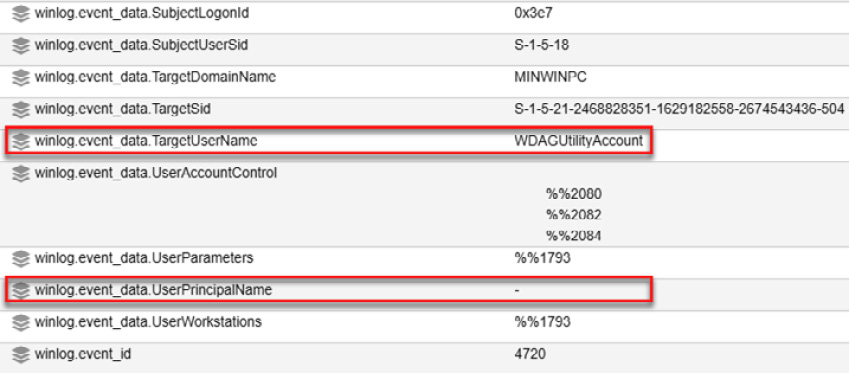
Figure 14.41 – Identifying additional details regarding this log event
If you check the UserPrincipalName field, it is blank, which indicates that this account was created without following the company's user creation standards. You can use this information to search more deeply for activities carried out with this account.
Searching by the activity of devices involved
At this point, we can focus on search information from the device's activity in the period when we believe that the incident occurred, as follows:
- To limit the amount of information and focus on what may be useful, we will apply an event.dataset:conn | groupby source.ip destination.ip network.protocol destination.port filter that is predefined by default in the Hunt queries section, as shown in the following screenshot (ensure that the search is carried out in the period mentioned before):
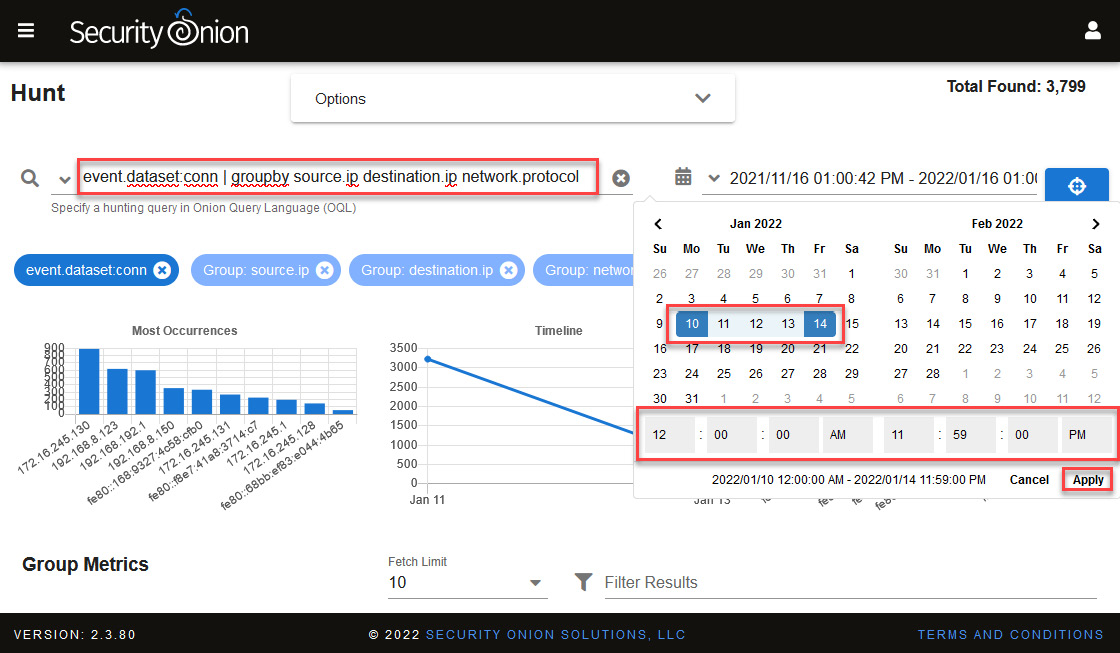
Figure 14.42 – Filtering events using a predefined query
We are particularly going to focus on devices that had some activity out of the ordinary—in this case, those that connected to HTTP ports 9000 and 4444, as shown in the following screenshot:
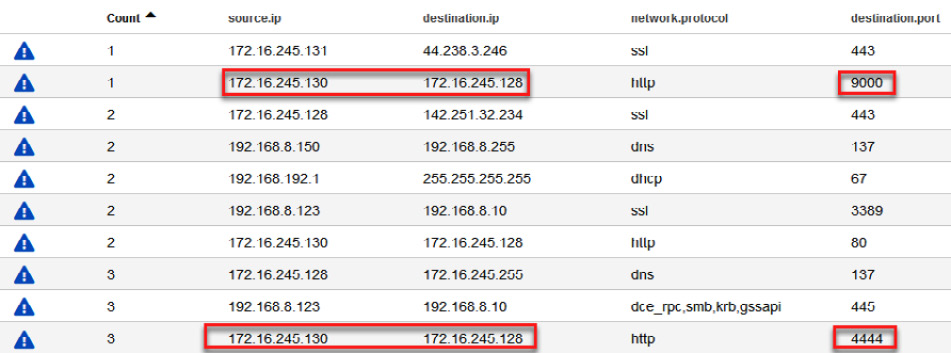
Figure 14.43 – Filtered communications in a range of time
As you can see, this communication was made between the 172.16.245.130 and 172.16.245.128 IP addresses. Investigating a little more, you will verify that the first IP address (172.16.245.130) was assigned to the Corp-Laptop VM by the Dynamic Host Configuration Protocol (DHCP) of Michael Scott's hotel.
- To filter and analyze traffic from these devices, change the order of the Count field to see the lower occurrence of communications and click on the destination.ip value to select the Include option, as shown in the following screenshot:
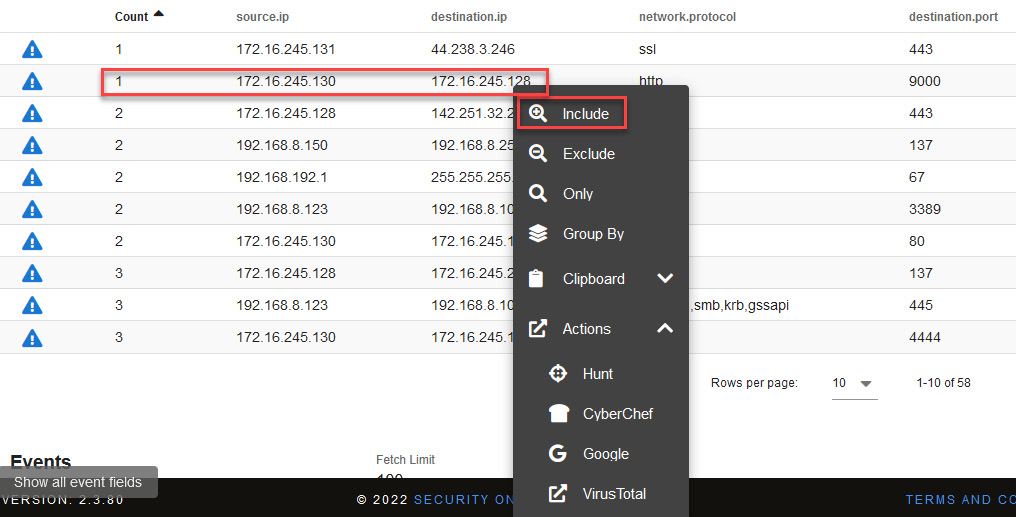
Figure 14.44 – Filtering for a specific communication
You will see all communication established by these computers in the defined period. In this case, all the communications were under the http protocol and the following destination ports:
- 9000
- 80
- 4444
- 8080
You can see confirmation of this in the following screenshot:
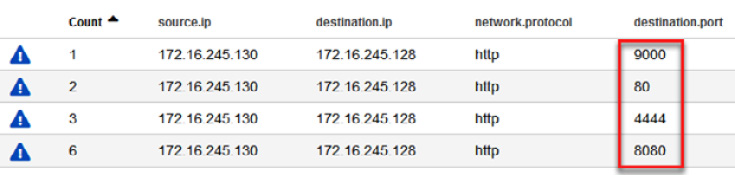
Figure 14.45 – Communications filtered by ports
- First, let's filter the communication made to port 9000. Click on the port number and select the Only option, as shown in the following screenshot:
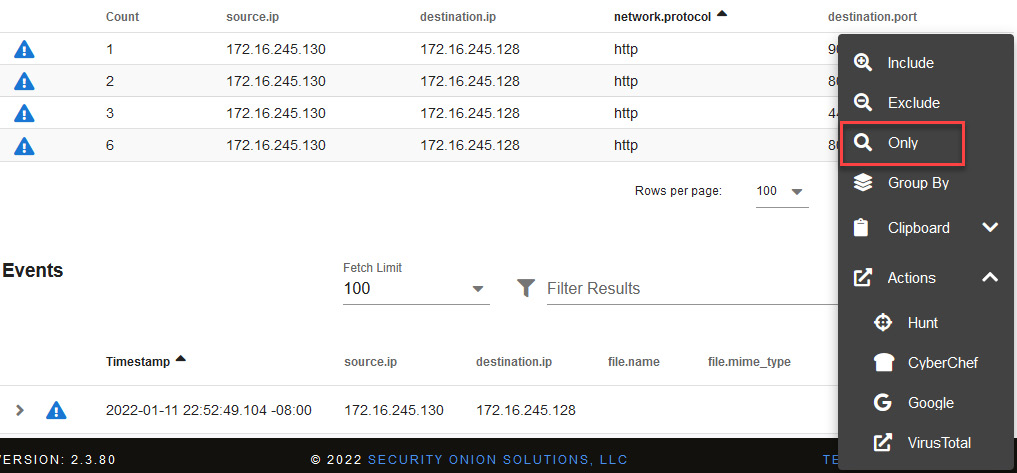
Figure 14.46 – Grouping and analyzing a specific port
- To analyze this traffic, below the Events section, click on the first row where there is communication between these two IPs, and under Actions, select PCAP, as shown in the following screenshot:
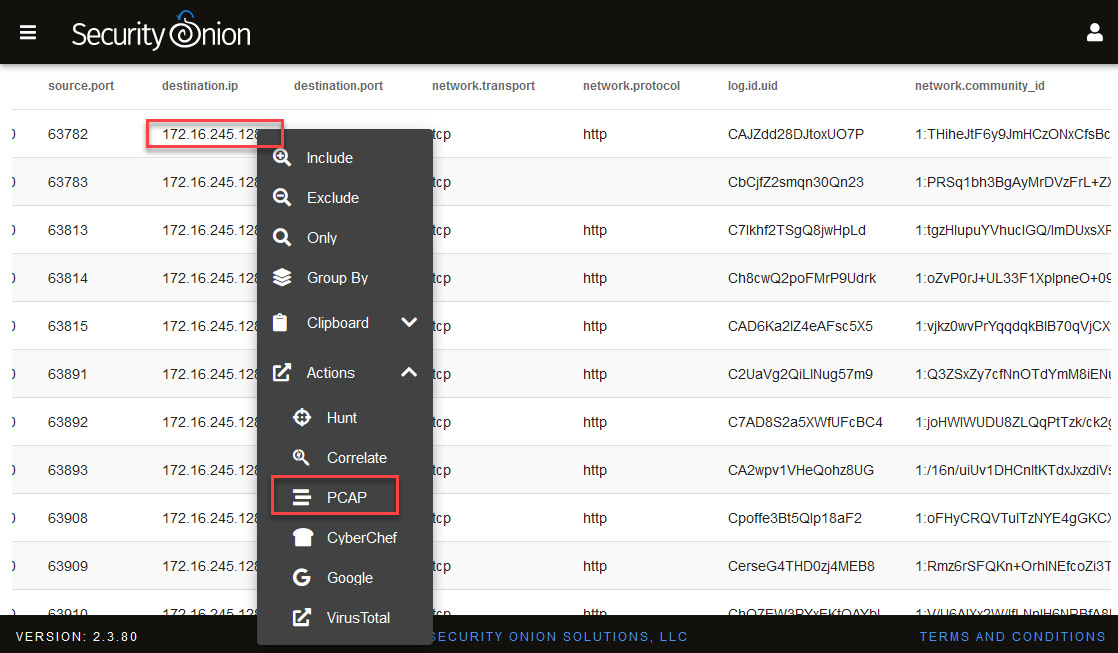
Figure 14.47 – Selecting the PCAP option to analyze traffic
You will be redirected to the PCAP analysis console; apply only the Raw Packages option and you will see the content of the package. Now, let's analyze the content of communications between these two computers using port 80.
In the Hunt console, apply the following filter in the Queries section: "172.16.245.128" AND destination.ip:"172.16.245.128" | groupby source.ip destination.ip network.protocol destination.port. You will again see communications filtered by the destination port, as in the previous search, as illustrated in the following screenshot:
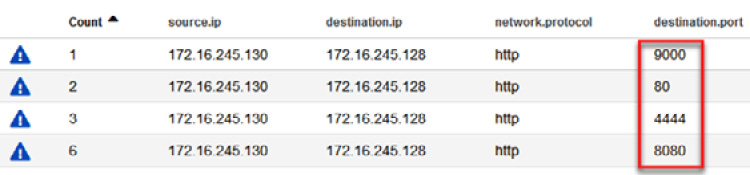
Figure 14.48 – Communications filtered by ports
- As you did before, click port 80 of the destination.port column and select the Include option to filter the traffic of that port, as illustrated in the following screenshot:
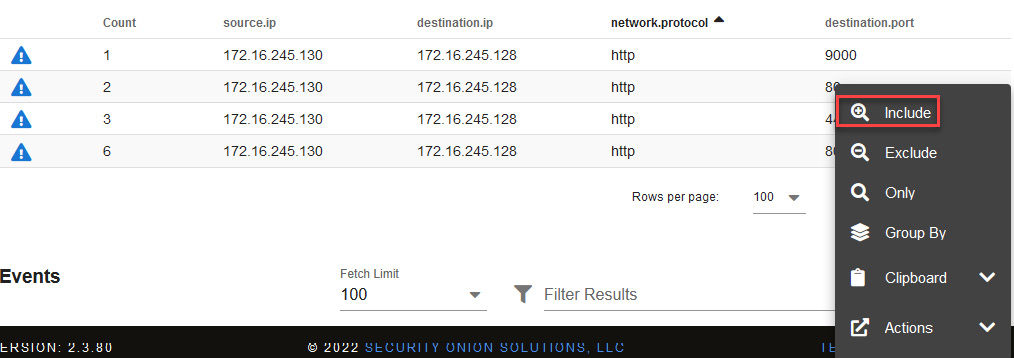
Figure 14.49 – Grouping and analyzing a specific port
Now that you've filtered the traffic of port 80, let's analyze the PCAP packets.
- Click on the destination.ip first package and then select PCAP under Actions, as shown in the following screenshot:
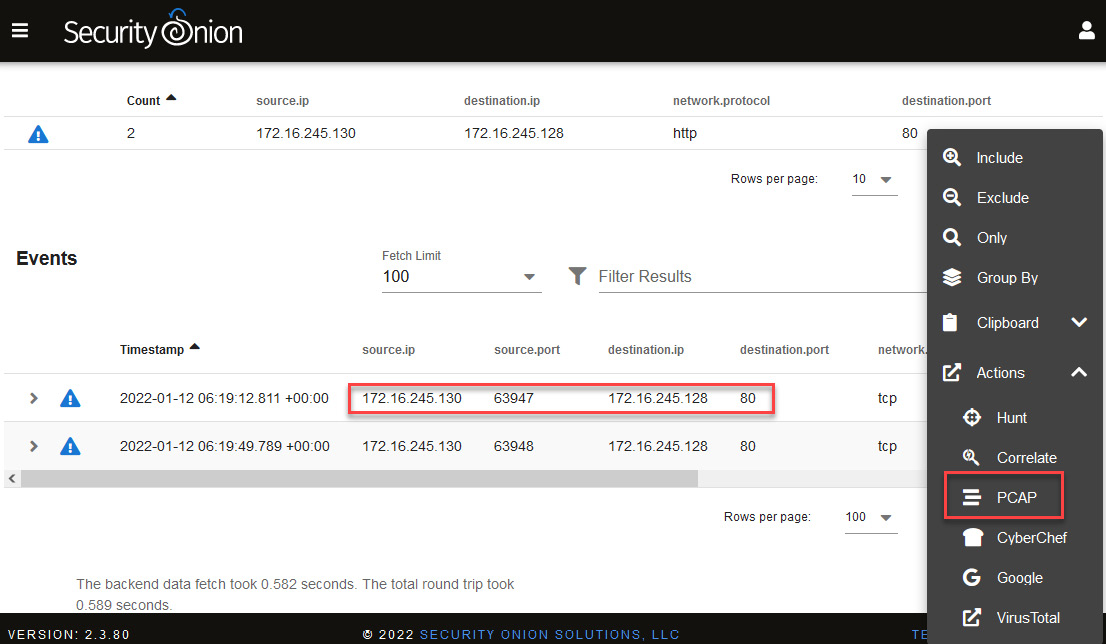
Figure 14.50 – Selecting the PCAP option to analyze port 80 traffic
You can now analyze the content of the packages. In this case, you can see the download of the procdump.zip file using the GET command from the same URL previously identified.
Again, a binary file appears in the content of the package, so we will perform the same procedure we did earlier, as follows:
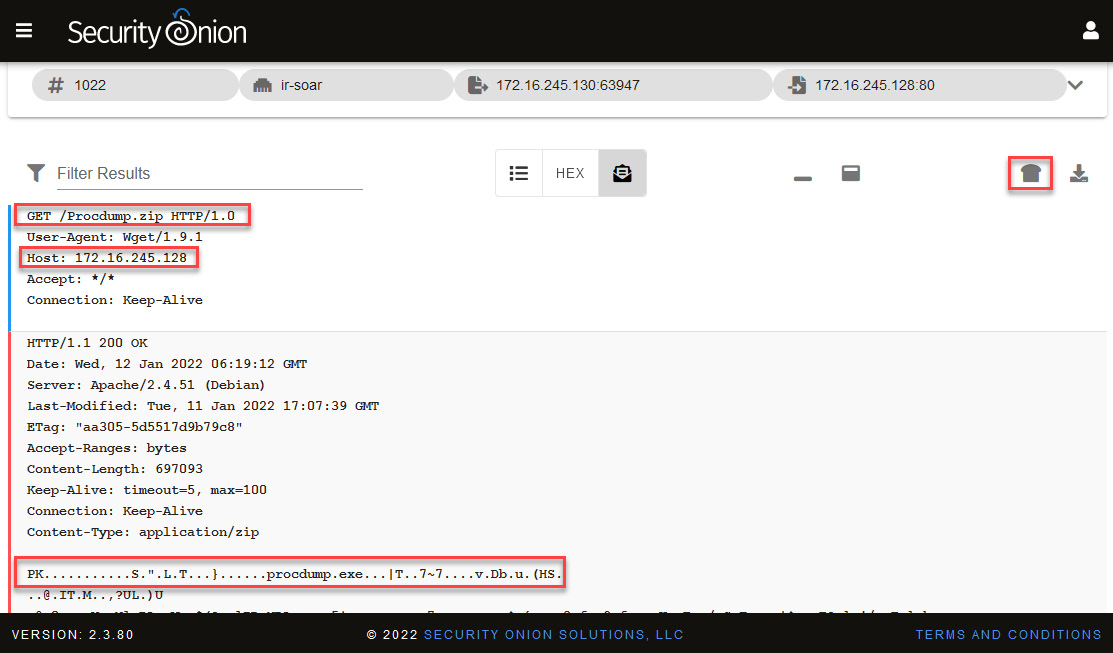
Figure 14.51 – Analyzing the content of the PCAP
- Click on the Send the transcript to CyberChef button. This will open a new CyberChef tab in your web browser with the content of the PCAP. Remove the HTTP content and leave only the binary content.
- In the Operations textbox, write strip to filter the options.
- Drag the Strip HTTP headers option to the Recipe section. Repeat this one more time.
- Click on the Save button.
- Change the name of the procdump.dat file, as shown in the following screenshot:
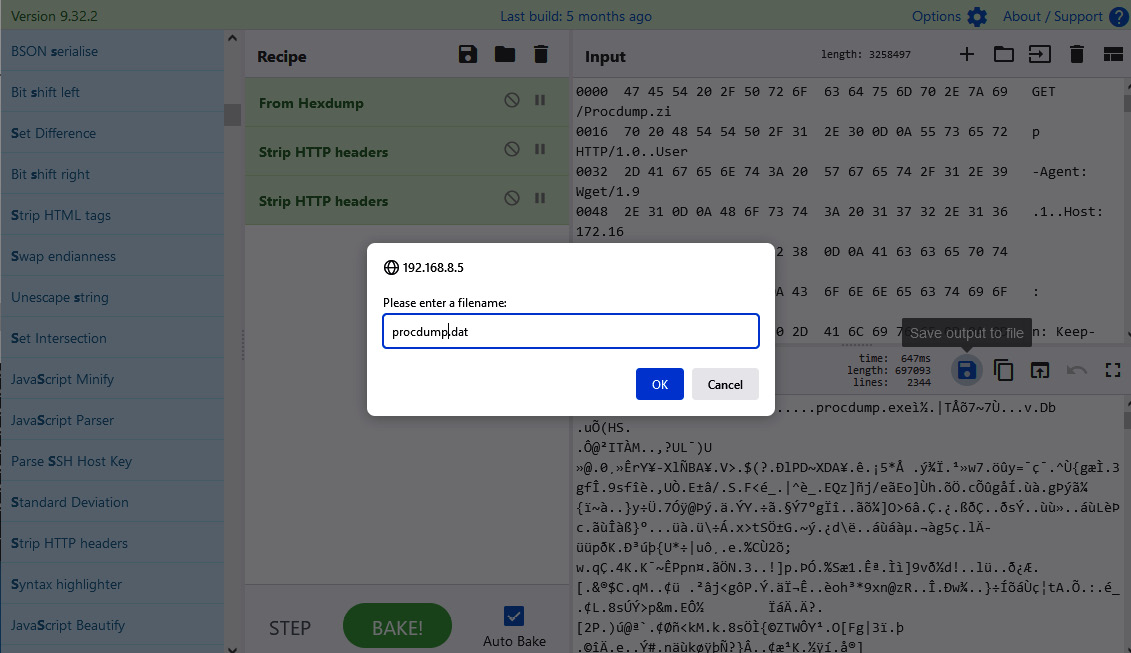
Figure 14.52 – Saving the binary content
- Save the file to C:UsersInvestigatorWorkspaceLabsChapter-14.
Open a new instance of pestudio and drag the procdump.dat file to the center of the program.
In this case, you can see that the virustotal section appears in green, and no antivirus apparently detects it as malicious. This is because this is a legitimate program abused by threat actors:
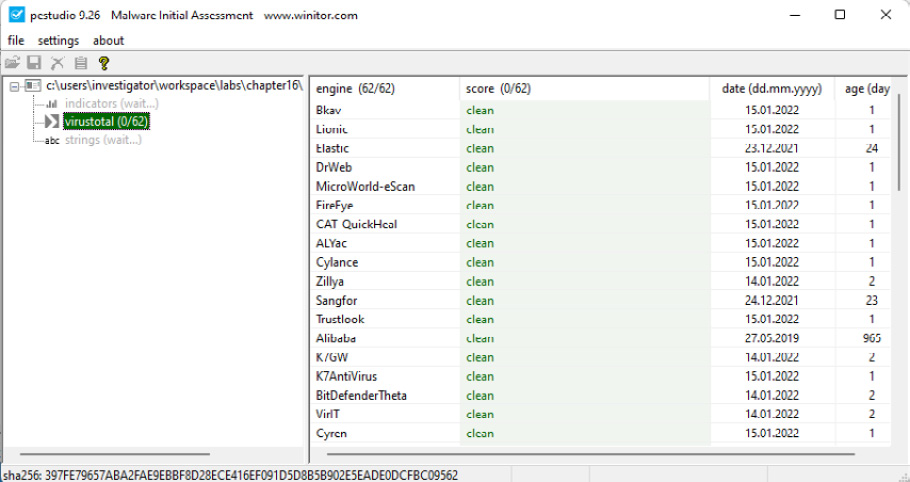
Figure 14.53 – Analyzing the procdump.dat file in pestudio
Now, let's go back to the Hunt console to analyze the second packet filtered by port 80, as shown in the following screenshot:
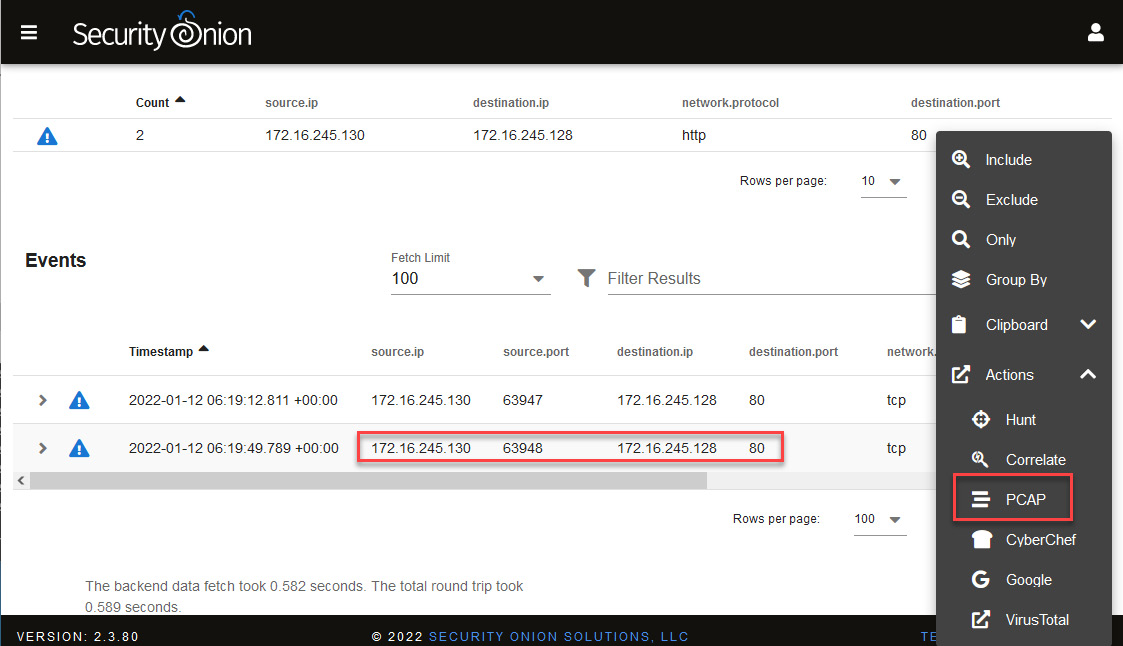
Figure 14.54 – Selecting the PCAP option to analyze port 80 traffic
In this case, you will find what seems to be the download of the Mimikatz program, which is used to dump passwords and can be used in conjunction with the ProcDump tool:
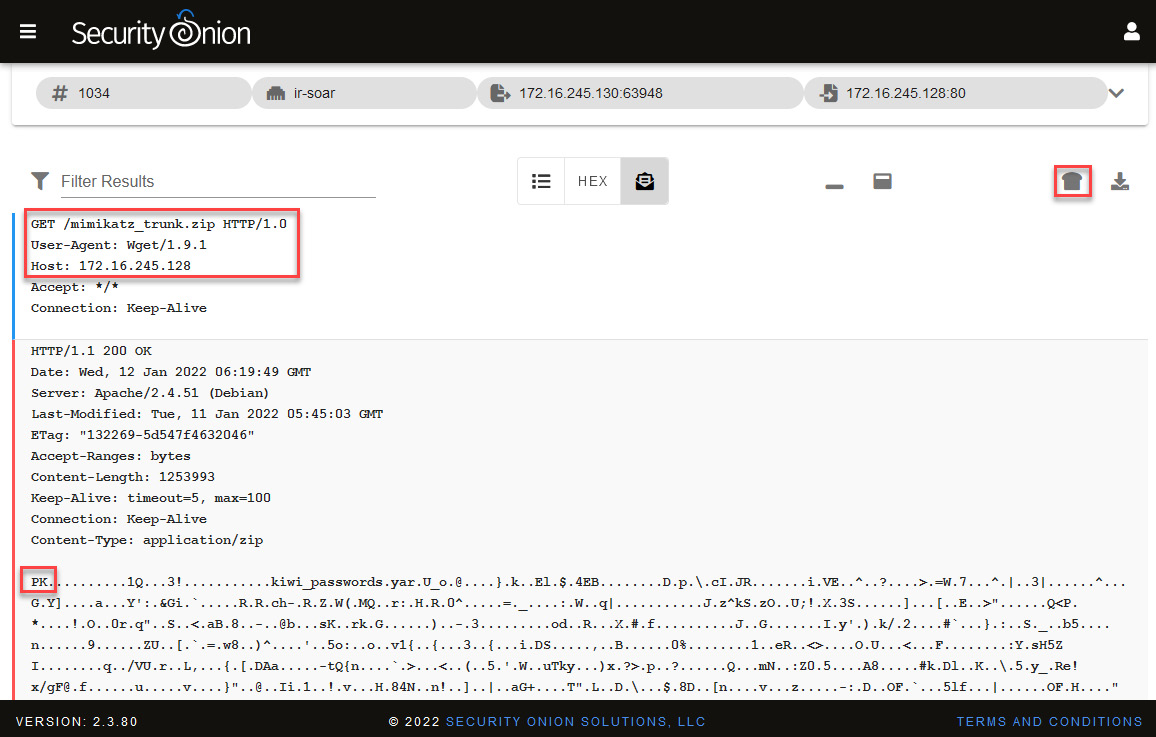
Figure 14.55 – Analyzing the content of the PCAP
To review the file, as on previous occasions, we will send it to CyberChef, save it on our VM, and analyze it with pestudio.
- Click on the Send the transcript to CyberChef button.
- In the Operations textbox, write strip to filter the options.
- Drag the Strip HTTP headers option to the Recipe section. Repeat this one more time.
- Click on the Save button.
- Change the name of the mimikatz.dat file and press the OK button, as shown in the following screenshot:
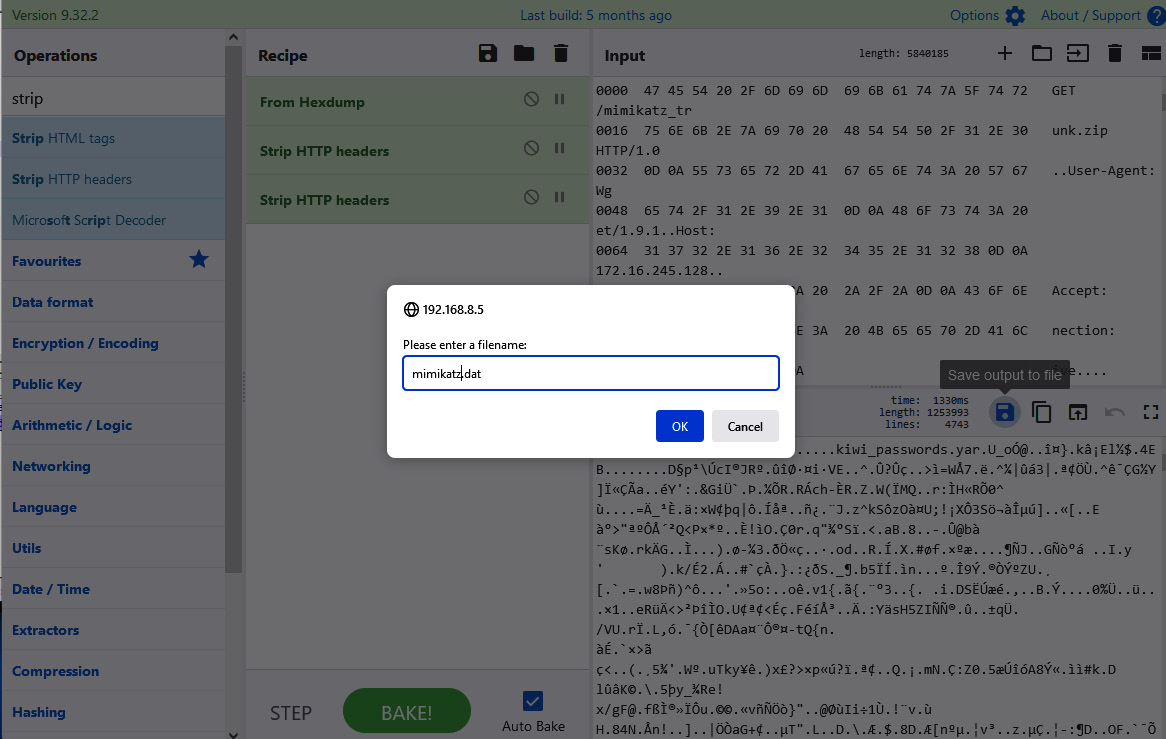
Figure 14.56 – Saving the binary content
- Open a new instance of pestudio and drag the mimikatz.dat file to the center of the program.
Unlike the previous file, you can see in the virustotal section that this file is detected and identified by almost all antiviruses, as you can see in the following screenshot:
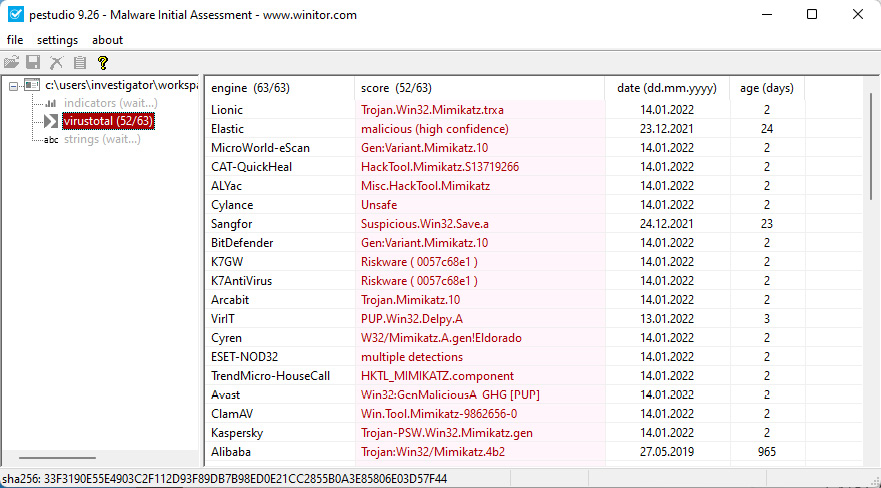
Figure 14.57 – Analyzing the mimikatz.dat file on pestudio
With this, we confirm that one of the intentions of the threat actor was to obtain the user's credentials.
Both files, procdump.dat and mimikatz.dat, are .zip files, so if you want to analyze the binaries in their content, you just need to change the extension and decompress them. Just remember that this must be done in a controlled environment to avoid accidents.
Up to this point, you have obtained very valuable information to help you understand some of the techniques used by threat actors, some indicators of compromise (IoCs), as well as some samples of implants and programs used by attackers.
It is very important that you begin to document all these findings on TheHive and include indicators of attack (IoAs) and IoCs.
Now, you will begin to use your instinct, apply the knowledge acquired with this book, and research different sources to find as much evidence as possible, using this information to identify the dimension of attacks and develop the best strategy to contain them.
Try to find evidence that will help you answer the following questions:
- Which other programs and tools did the threat actor use?
- Which tactics, techniques, and procedures (TTPs) were used?
- Which credentials could be compromised?
- What information was exfiltrated during the process?
- What was the attacker's main motivation?
- Are there other network devices compromised?
I am sure that you will do an excellent job if you take the time to work on this security incident investigation. Feel free to analyze the evidence further to discover additional artifacts to figure out what could happen, the attacker's possible objective and motivation, and how far they went in this attack.
Summary
In this last chapter, you had the opportunity to apply some of the IR concepts learned in this book.
From a security breach incident, you opened and managed a case and started an investigation by analyzing events and behaviors detected from network traffic monitoring and the centralization of logs from different systems in the corporate network.
Additionally, you learned to perform network traffic and file analysis to get valuable artifacts for your investigation.
I sincerely hope that this book will be helpful for you, whether it is for your professional development as reference material or simply for you to learn something new.
Knowledge evolves quickly, and environments and tools change frequently, so I invite you to visit the repository of this book (https://github.com/PacktPublishing/Incident-Response-with-Threat-Intelligence), where you will find updated versions of the tools mentioned in the book and additional tools that will help complement your knowledge.
You will also find guides, short videos, and complementary support material.
Thank you for joining me on this journey; it has been an honor to share some knowledge with you.
I wish you success in your career as a professional incident responder, and I hope we can meet at some place or event in the industry.