4
Data Center and Cloud
In this chapter, you will learn why there has been a shift from on-premises to cloud computing, the definition of the cloud, and the value and opportunity for enterprises leveraging the cloud, sustainable digital infrastructure, in data centers or in the cloud. Secondly, we will dig into the sustainability benefits of cloud computing. Thirdly, we will look at how sustainable global cloud service providers are in general and what public commitments they have made. We will look at some of the best practices and innovations from these cloud providers in terms of sustainability. Furthermore, we will investigate a case study where a data center provider is creating a net-positive cloud. Finally, this chapter will outline external green and eco-sustainability agencies alongside a few independent data center and cloud alliances to get involved in to take part in the switch to sustainable digital infrastructure.
The main objective of this chapter is to introduce you to the sustainable digital infrastructure within the data center and cloud realm, its benefits, and what sustainable IT benefits it can bring. We will explore what considerations are available to transition data center estates to sustainable digital infrastructure.
In this chapter, we will cover the following topics:
- The sustainability benefits of moving from on-premises to cloud computing
- Sustainable IT benefits from cloud computing
- Choosing a sustainable cloud provider
- The power of alliances
From the sustainable IT reference model perspective, in this chapter, we will primarily cover the middle part, that is, the responsibility of the data center and cloud provider section. We will look at how the different capabilities play an integral part in building a sustainable digital infrastructure:

Figure 4.1: The sustainable IT reference model – Chapter 4 focus
By the end of this chapter, you will have learned about cloud computing service models, deployment models, cloud characteristics, and cloud service areas of responsibility. You will understand what value the cloud brings from an agility, scalability, reliability, resilience, cost optimization, and sustainability perspective. You will understand what metrics can be applied to create a data center sustainability score card. Furthermore, you will better understand what sustainable and public commitments the seven global cloud service providers – Microsoft Azure, Google Cloud, Amazon Web Services (AWS), Alibaba Cloud, Oracle, Tencent Cloud, and IBM – have made and their overall sustainability report card. You will gain insights into how to transfer from on-premises to the cloud and how it is possible to set up a net-positive data center by involving the right ecosystem players from the start. We will look at a few use cases from Wipro, Operational Intelligence, and EcoDataCenter. Finally, you will better understand the Climate Neutral Data Centre Pact and Sustainable Digital Infrastructure Alliance, along with a few other alliances, and how you could get involved.
The information backbone of our connected world
Today, data centers worldwide represent the information backbone of our increasingly digitized world. The forecast is that the global data center market will nearly double in this decade and become a $948 billion industry in 2030, up from $466 billion in 2020 (Verdict 2022). Data centers have become crucial to business operations. In particular, the recent pandemic forced many companies to adapt quickly and migrate their on-premises services to the cloud to cater to the demand of an increasingly distributed workforce. In the last two years, there has been a race to close the accelerated gap for digital transformation, and the demand for cloud, AI deployments, and consequently data has increased exponentially.
Data centers provide computing facilities to large entities, such as online social networks, cloud computing services, online businesses, hospitals, and universities (Brady, et al. 2013). Data centers entail a cluster of interconnected resources through communication links, hosting applications, storing data, and providing other services, such as cloud computing services (Khan, Othman, and Khan 2013). Data centers and network links are the engine room of the digital economy, and they provide the backbone of connectivity and the internet as we know it today.
Heatwave brings cloud providers to their knees
During the heatwave in Europe during the summer of 2022, many countries reported record-breaking temperatures. On July 19, 2022, parts of England reported temperatures above 40 degrees Celsius or 104 degrees Fahrenheit. As a result, data centers in London belonging to both Google and Oracle were severely affected and caused disruption to several cloud services (Condon 2022). Google reported a cooling failure in one of its facilities, and Oracle reported that a subset of its cooling infrastructure had been affected. As seasonal temperatures are on the rise, it is abundantly clear that data center providers will also have to respond to climate change and build further resilience into their infrastructure to cater to this high-temperature variability that we will continue to experience in the coming years.
Data center operations, for obvious reasons, are energy intensive. To operate efficiently, data centers need to be regulated to a certain temperature (15°C–32°C), which requires investment in advanced cooling equipment. In 2020, data centers globally devoured between 200–250 TWh of electricity, which roughly accumulates to 1%–2% of global consumption (Kamiya 2021). The tech industry alone accounts for roughly 12% of the world’s electricity consumption, and Bitcoin alone consumed a staggering 0.5% to mine digital currency, or 100 TWh of electricity in 2020. Given the massive rise in digitalization, that could rise to 8% of the global total by 2030, according to a study by Anders Andrae, a researcher at Huawei Technologies Ltd (Andrae 2020).
The rising demand for computing power and data storage presents a significant environmental challenge, as roughly 70% of the global energy mix comes from fossil fuels resulting in carbon dioxide (CO2) being released into the atmosphere (Ritchie and Roser 2020). The number of connected devices is expected to reach 55.7 billion by 2025, of which 75% will be connected to an IoT platform. The data generated by connected IoT devices is expected to grow fourfold, from 18.3 zettabytes in 2019 to 73.1 zettabytes by 2025 (IoT Growth Demands Rethink of Long-Term Storage Strategies 2020). As the demand for their services has been rising rapidly, data-intensive technologies such as AI, robotics, autonomous vehicles, and distributed manufacturing systems have an increased energy demand in the form of electricity, heating, and cooling. These technologies also require more sophisticated hardware specifications on graphics processing units (GPUs) and central processing units (CPUs) to do more elaborate computations and image processing. Data centers are a very resource-intense operation, and the demand keeps surging, so it is critical to set a path toward a sustainable digital infrastructure.
The sustainability benefits of moving from on-premises to cloud computing
No matter whether you house your servers, storage, or network equipment in your own data centers, outsource them to a hosting provider, or place them with one of the global cloud hyperscalers such as Microsoft Azure, AWS, Google, IBM, Oracle, Tencent, or Alibaba, it is probably one of your most resource-intense operations.
The global transition from on-premises data centers to the public cloud is gaining momentum as sustainability moves up the corporate IT and executive teams’ list of priorities. According to Gartner (Gartner 2021), public cloud spending is expected to increase by roughly 22% in 2022. By 2026, the prediction is that 45% of all enterprise IT spending will be on the public cloud. While the cloud is a crucial enabler to meeting the challenges of digital disruption, it is also emerging as a critical mechanism for businesses to achieve their sustainability goals.
According to Gartner, the traditional data center is already on its way out, and estimates that four in five enterprises will have shut down their own on-premises data centers in just three years.
Furthermore, the analyst firm notes that the percentage of the IT budget for the cloud will increase from 17% in 2021 to exceed 45% by 2026 – a clear reflection of enterprises’ own data centers’ declining relevance in the modern IT function. So, what is the cloud? Is it just another data center run by large hyperscalers such as Amazon, Google, or Microsoft somewhere in the world? Before we go any further, let us dissect the definition of the cloud, its three service models, four deployment models, and five essential characteristics.
Definition of the cloud
Cloud computing is an exponential technology that has propelled IT services into industrialization and commoditization. In the traditional IT service delivery world, each component in the stack was divided into siloed delivery teams such as data centers, network and storage, firewalls, physical servers, virtualization, databases, and applications. In the traditional IT service delivery model, the focus was on stability instead of agility and the rapid delivery of business outcomes. With the entrance of the cloud, the IT service model changed from a silo-oriented approach to an IT services approach delivering Infrastructure as a Service (IaaS), Platform as a Service (PaaS), and Software as a Service (Saas).
Cloud computing enables organizations to scale capacity up and down to match the demand dynamically. This allows for sharing infrastructures to leverage economies of scale. The concept of the cloud is like an electrical power utility, where the computing resources are provided over a wide-area network instead of electricity. Just like in the world of utilities, such as electricity, water, and waste management, IT can switch to a pay-as-you-go model, where consumers only pay for what they consume, and they can scale their demand up and down dynamically in line with their needs. A cloud computing approach allows the company to spend less time managing complex IT resources, investing in world-class customer experience, and differentiating products and services.
Cloud computing is defined by the National Institute of Standards and Technology (NIST) (NIST 2011) as a model for enabling convenient, on-demand network access to a shared pool of configurable computing resources (e.g., networks, servers, storage, applications, products, and services) that can be rapidly provisioned and released with minimal management effort or service provider interaction.
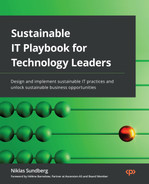
There are three service models, four deployment models, and five essential characteristics of cloud computing, as illustrated in Figure 4.2. They help organizations establish the requirements for transitioning to the cloud and determine the appropriate cloud offering:
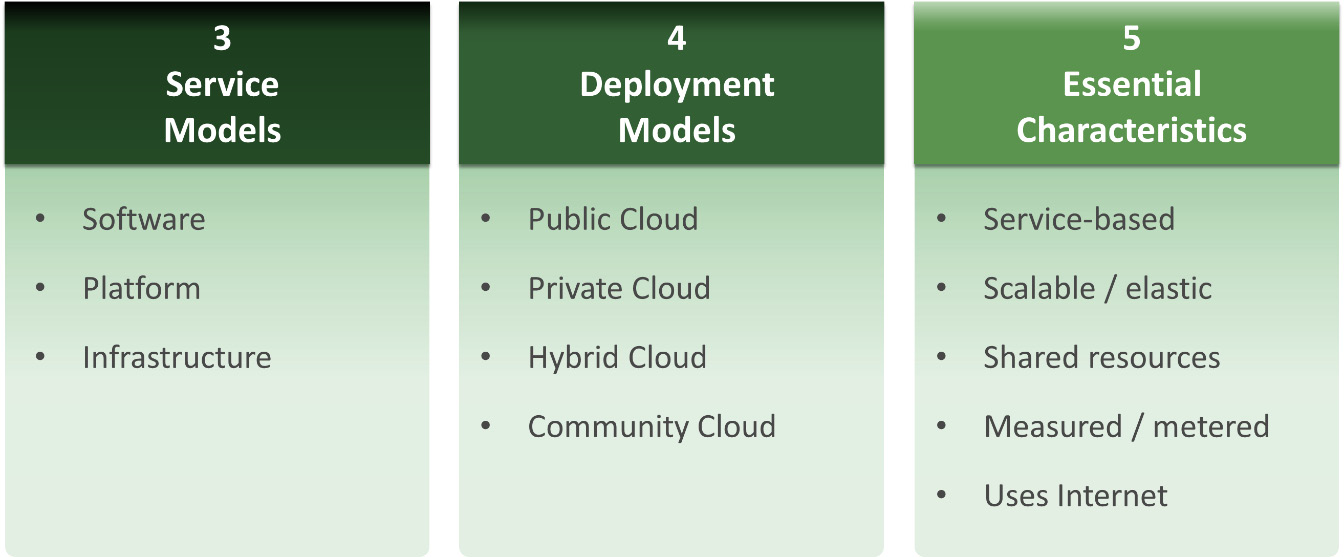
Figure 4.2: Definition of cloud computing (NIST 2011)
We will be referring to these definitions and commonly recognized terminologies to ensure we follow a commonly understood and used vocabulary. For further reading on the definitions of cloud computing, I recommend visiting NIST Special Publication 800-145, The NIST Definition of Cloud Computing, at https://nvlpubs.nist.gov/nistpubs/Legacy/SP/nistspecialpublication800-145.pdf.
Cloud service areas of responsibility
As we now have gone through the definition of cloud computing with its three service models, four deployment models, and five essential characteristics of the cloud, it is also essential to understand the different actors and who is responsible for your impact as a customer as you move from a traditional on-premises IT service to the public cloud. Figure 4.3 highlights the areas of responsibility within hybrid cloud services:
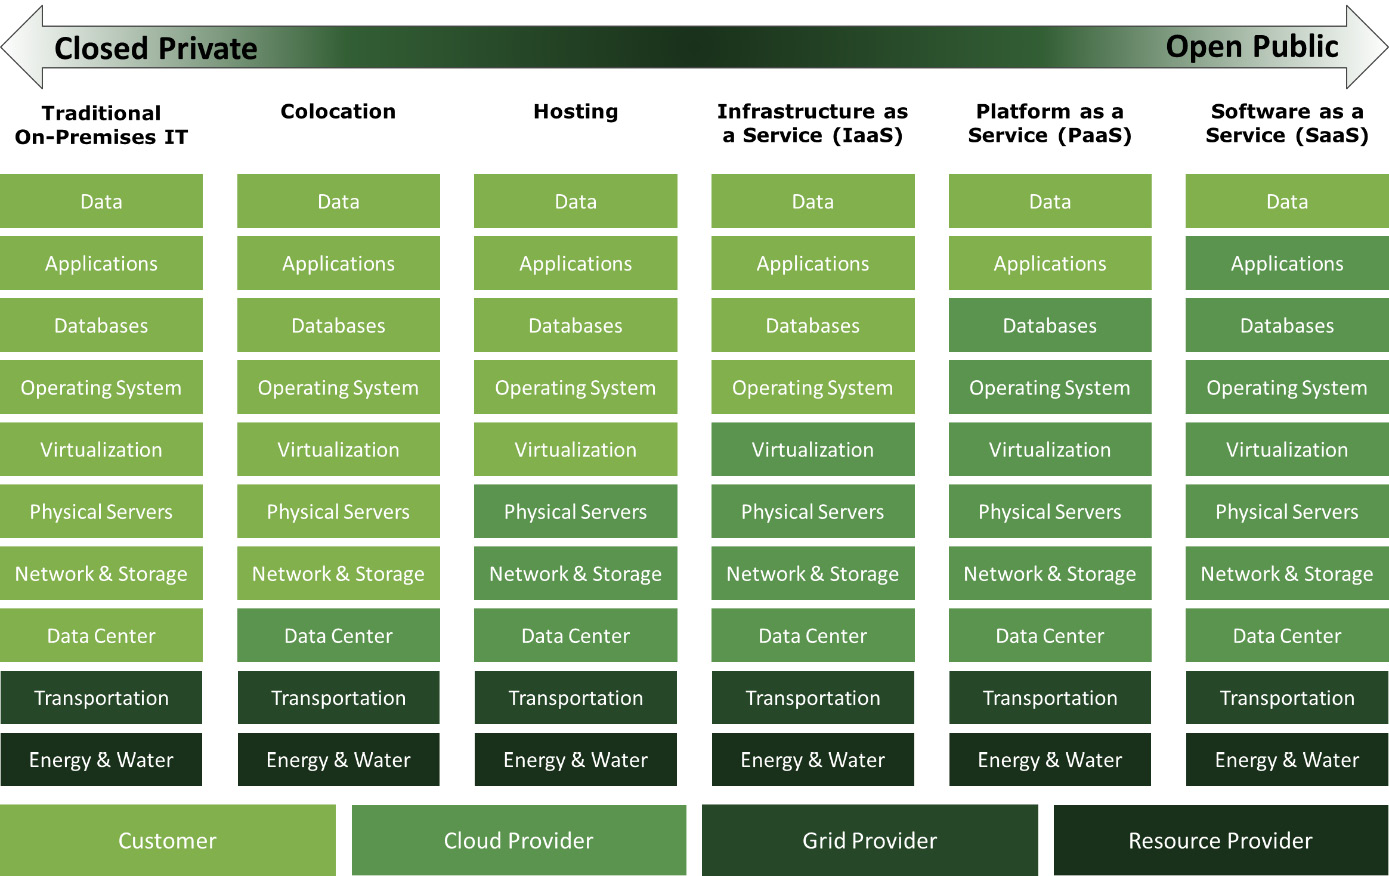
Figure 4.3: Areas of responsibility within the cloud services
Essentially, there are four essential actors: the Customer, Data Center and Cloud Provider, Utility Provider, and Resource Provider. On the left-hand side, we have the traditional on-premises delivery model in a private cloud utilized and managed by only one organization. The more you move to the right-hand side, the more you share resources with other organizations, and the cloud provider takes on more and more responsibility. In a traditional model, the customer is essentially responsible for everything from energy and water resource providers to the data on top of the stack. In the SaaS model, the customer is only responsible for the data. The cloud provider is responsible for selecting the resource providers, along with the data center setup all the way up to the application layer. As increased legislation such as General Data Protection Regulation (GDPR) within the EU has come into effect, managing your data in gathering, profiling, harvesting, and analytics is becoming critical from a data privacy and data security perspective. A data breach can have massive consequences both from a financial and reputational perspective.
Now that we hopefully have a better understanding of the cloud, let us look further into what the value of the cloud can bring, especially from a sustainability perspective. Although you, as the customer, do not have a direct relationship with the resource provider in most of the preceding examples, you can still use your buying power to demand that your cloud should be powered with renewable energy, water should be used responsibly, and waste should be kept to a minimum.
The value of the cloud
The cloud represents a fundamental shift within IT toward commoditization. Cloud computing enables IT systems to be scalable and elastic at a much faster pace than traditional IT models. The cloud computing business model to deliver IT services (software, platform, and infrastructure) presents a compelling opportunity for companies to realize agility, scalability, reliability, resilience, cost optimization, and sustainability benefits:
Figure 4.4: The value that the cloud can bring
Next, we have listed six critical areas along with their associated benefits. They are far from exhaustive and are applicable to all organizations.
Agility:
- Meet customer expectations by deploying new functionality simultaneously
- DevOps: The convergence of development and operations. In Chapter 5, Application and Data, we will go into further detail to explain the DevOps model
- Innovation: Access to the latest technology through cloud providers, including out-of-the-box functions such as database platforms, dynamic storage, API gateways, or AI and machine learning modules and libraries but also access to data centers in locations powered by renewable energy sources
Scalability:
- Deliver digital products and solutions at scale – near instantaneous increase or reduction in capacity
- Access to an array of global geographical deployment alternatives
- Improved asset utilization through more effective sharing and utilization of common hardware
Reliability:
- Meet customer demand of > 99.5% service availability
- Provide a customer experience that is always on with no downtime, no service windows, and a minimal environmental footprint
- Access to specialized hardware that can provide instant fail-over, backup, and disaster recovery
Resilience:
- Provide a consistent way of managing security
- Adhere to complex compulsory regulatory and compliance requirements (that is, ISO27001, HIPAA)
- The opportunity to establish a robust business continuity capability with secure backups and distributed databases
Cost optimization:
- Overhaul the application portfolio and significantly reduce the number of applications while transitioning to the cloud
- Reduce IT infrastructure costs by hardware on demand, reducing capital risk and improving virtualization and asset utilization
- Improve IT staff productivity
Sustainability:
- Decarbonize your IT operations
- Gain access to renewable energy sources and low carbon grids
- Ensure proactive AI monitoring to improve efficiency, and reduce emissions through predictive and prescriptive maintenance
- Offer responsible life cycle management around a data center’s hardware equipment such as servers, storage, routers, and switches to ensure circularity and minimal waste
Now that we have listed the more general benefits of cloud computing, let us look at some of the sustainable IT benefits derived from cloud computing.
Sustainable IT benefits from cloud computing
One way to help businesses reduce CO2 is by shifting inefficient workloads to the cloud. There are significant sustainability benefits that can be unlocked by moving from on-premises to the cloud, such as the following:
- Reductions in energy consumption
- Lower greenhouse gas (GHG) emissions
- Higher utilization of carbon-free energy (CFE)
- Higher asset utilization
- Preservation of water
- Circular IT hardware management
- Better scope-3 management
With meticulous planning and a focus on execution, it can be a critical contribution to environmental sustainability. The analyst organization International Data Corporation (IDC) expects that more than 1 billion metric tons of CO2 from 2021 to 2024 could be prevented by accelerating the shift to the cloud. IDC suggests that “aggregating compute resources generates higher efficiencies, resulting in a substantial reduction in CO2 emissions.” By shifting the workload from inefficient data centers to large-scale data centers, emissions reductions are driven by more efficient power capacity management, optimized cooling, access to the most power-efficient servers, and increased server utilization rates (IDC 2021). Professional services firm Accenture (Nolan and Tsai 2020) predicts that the transition to the public cloud can reduce nearly 60 million tons of CO2 emissions every year, a 5.9% reduction of total IT emissions, which is equivalent to removing 22 million cars off the road (Lacy, et al. 2020).
A report released by Microsoft in partnership with WSP (Microsoft News Center 2018) in May 2018 showed significant energy and carbon emissions reduction potential from the Microsoft Cloud compared to on-premises data centers. As much as 93% more energy-efficient and as high as 98% more carbon-efficient, these gains are due to Microsoft’s extensive IT efficiency investment from chip-to-data center infrastructure and renewable energy. AWS has also incorporated sustainability as a sixth pillar to their Well-Architected Framework, which focuses on minimizing the environmental impacts of running cloud workloads (AWS 2022).
A study by Accenture (Lacy, et al. 2020) suggests that carbon intensity can be reduced to a minimum by applying a specific set of techniques:
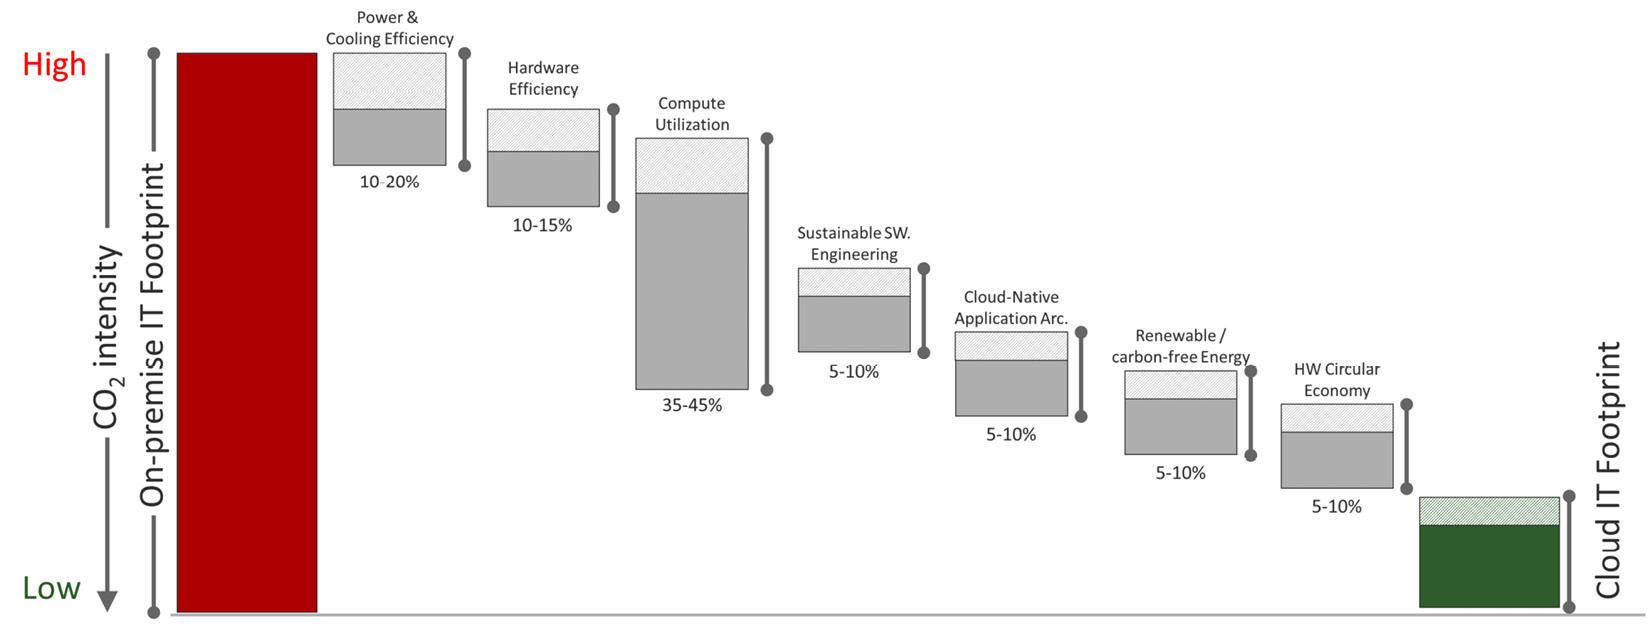
Figure 4.5: Carbon emission reduction potential by moving from on-premises to the cloud (Lacy, et al. 2020)
As illustrated in Figure 4.5, there is a significant potential to reduce carbon intensity by moving from on-premises to the cloud. Several different techniques can be applied to reduce carbon intensity:
- Improved power and cooling efficiency, including surplus heat and water recovery
- Improved hardware utilization through virtualization, serverless computing, and Function as a Service (FaaS)
- Significant gains to be made by optimizing compute utilization
- Sustainable software engineering
- The utilization of cloud-native application architecture
- The usage of renewable energy or CFE
- Circular hardware design, management, and end of use
Let us look at a real-world example of migrating from on-premises to the cloud from one of the global IT service providers, Wipro.
Wipro has a long-standing track record focusing on sustainability, and for 12 consecutive years, they have been included in the Dow Jones Sustainability World Index (DJSI) (Wipro 2021). I had the opportunity to sit down with Lakshmanan “Laks” Vaidyanathan, who is the general manager and global practice head for datacenter and hybrid cloud services at Wipro Limited.
He shared with me that Wipro has helped their clients migrate over 15,000 servers from on-premises data centers to the public cloud in the last 12 months, resulting in more than 14,000 metric tons of carbon emissions being prevented from being released into the atmosphere.
Furthermore, “Laks” shared with me that, as a rule of thumb, 100 racks of workloads being moved from a data center to the cloud results in a reduction of 1,400 tons of CO2 emissions from a baseline of 2,200 tons to a target state of 800 tons in a public cloud data center. That is almost 65% of CO2 emission, which is a significant reduction. The assumption is that each rack consumes 4 kilovolt-amps (KVA) or 4Kilowatt hours (kWh) and 0.63 kg of CO2 emissions per kWh of power generated for traditional data centers and roughly 0.20 kg of CO2 emissions per kWh of power generated for a typical cloud provider.
He did mention that all new-age data center providers that Wipro is partnered with are actively pursuing their facilities’ modernization to “Green DCs,” thereby helping clients achieve PUE ratios that are 40%–50% better than traditional DCs and are also certified by external agencies for green and eco-sustainability. Most of their partners have subscribed to The European Climate Neutral Data Center Pact and are taking urgent measures to meet the sustainability targets. Refer to the The power of alliances section in this chapter for more details.
In another example, he shared specifics of how a storage modernization example for a large retail client in the UK resulted in a 94.7% reduction (from 320 tons of CO2/year to just 17 tons of CO2/year) through the right choice of new-age technology to replace some existing legacy architectures and solutions. This is the equivalent of taking 66 passenger vehicles off the road for a year. It was a combination of the sizing of next-generation hardware, the right tiering, data optimization, and the deployment of new-age technology solutions that resulted in this saving. Figure 4.6 illustrates how this retailer was able to save on their carbon budget but also made a significant saving in terms of costs:
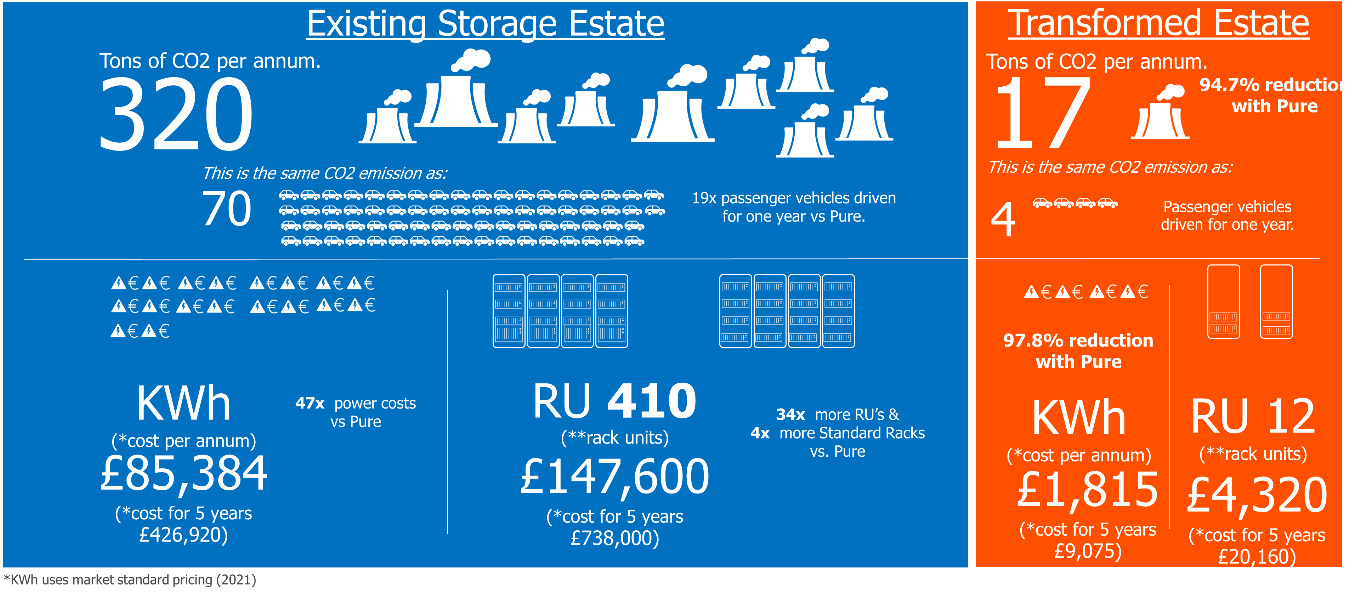
Figure 4.6: Environmental impact through tech modernization
In Part 3, How Do You Accelerate Sustainable IT?, of this book, we will dig further into the calculations of CO2 emissions and how you can establish your emission baseline.
Although shifting workloads from on-premises to the cloud could benefit you, several factors must be considered. The most used KPI to measure the effectiveness of a data center is power usage effectiveness (PUE). However, there are also other vital factors to be considered. For example, what region or country you choose to place your workload in can significantly impact your carbon usage effectiveness and need for cooling and water. Companies such as Microsoft are testing underwater data centers to study their feasibility from a logistical, environmental, and economical perspective (Roach 2020). Some regions or countries emit significantly higher CO2 per kilowatt-hour than others with a higher share of renewable energy. Therefore, it is essential to roughly understand how many grams of CO2 are emitted per kilowatt-hour in your region or country since it can differ by as much as 75, which is why the ability to shift non-critical workloads can help with this. It is equally important to understand energy consumption (carbon usage effectiveness), energy mix (renewable energy), water consumption (water usage effectiveness), and waste management. Later in this chapter, we will dissect these metrics in detail, but it is essential to know several factors to consider when choosing a cloud provider.
Many organizations rely on older, legacy and enterprise data centers and equipment for their data storage and processing needs. Unfortunately, this approach presents several sustainability challenges. Legacy data centers and their equipment use more power and generate more heat than modern state-of-the-art data centers that have been built with sustainability in mind from the start. For example, upgrading from a legacy mainframe to a modern server environment can be the path to a lower carbon footprint. It is also important to be mindful of the hardware refresh cycles since up to 80% of carbon emission is spent during the manufacturing stage. This is usually referred to as embodied carbon and will be covered, in detail, in Chapter 6, IT Hardware Management. Most data centers are still primarily powered using fossil fuels. At 24 gigatons per year, more than one-third of the global total, the power sector is the single largest source of carbon emission. Data centers are an organization’s second-largest energy consumer, with 35% of this energy taken up by cooling equipment.
Their increasing demand has clear implications for our global energy demand going forward, mainly since most of the energy originates from fossil fuels and accounts for one-third of the global emissions total. As we see clear indications that electricity consumption will keep surging, we as technology leaders have an ethical and moral responsibility to meet this demand by supplying solutions that stem from sustainable IT practices. Continuing to run IT as usual is no longer an option. Let us take a closer look at the main factors that impact the carbon footprint within a data center.
Location
The main factor impacting your footprint is the location of your servers due to access to renewable energy. However, with the rapid growth of renewable energy options around the world, this picture is likely to change rapidly in the coming years, although admittedly, not as fast as we need it to. The same algorithm will emit 32 times more CO2e if the workload is run in India than in Québec (Canada) or Sweden. As illustrated in Figure 4.7, where you place your workload and draw your energy from has a massive impact on your CO2e:
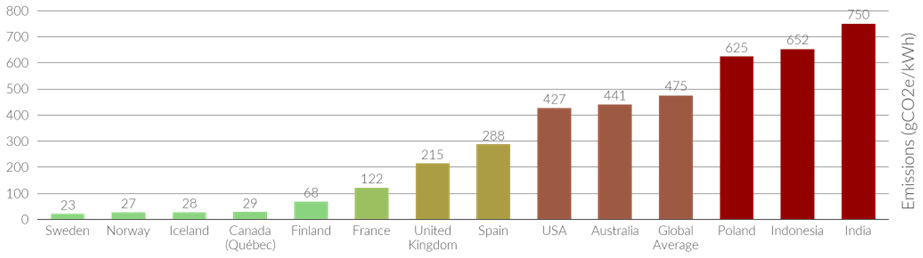
Figure 4.7: Placement of the workload impacts your CO2e significantly (Electricitymap 2022)
Why is that the case, you might wonder? Well, the share of renewable energy sources such as solar, wind, and hydro (water) are available to a higher degree in countries such as Canada, Norway, and Sweden. According to the Cushman/Wakefield Data Center Risk Index, Iceland has been ranked as one of the safest locations in the world for data centers due to its favorable political climate, predictable renewable energy supply, and competitive pricing. This does not mean that renewable energy sources are not available in intense carbon countries. In the United States, there are already several energy grids available where you can get down to as low as 24g CO2e/kWh. Also, with the war on Ukraine, the European Union has taken decisive steps to end the dependency on Russian gas and has introduced the REPowerEU plan (European Commission 2022). The plan is to reduce dependency on fossil fuels and fast forward the green transition.
Still, you need to choose carefully and put those requirements on your energy providers or cloud vendors to ensure that they deliver their products and services from renewable energy sources. It is critical to send a clear message to the providers about your intentions to fulfill your net-zero commitments. However, building the necessary infrastructure for renewable energy sources takes time and resources. Some of the materials, minerals, and their processing take place in remote countries such as China or Russia. Given the current geopolitical situation, this is likely to affect the ability to scale up renewable sources.
What are your physical power mix and coal intensity?
If you are interested in understanding your physical power mix and your coal intensity in a particular region or country where you run and operate your data centers, visit the ElectricityMap (https://app.electricitymap.org/map) for more details.
Although it is not always the case, many cloud providers offer the option to select the location of data centers. This is primarily due to the Schrems II decision in July 2020. The Court of Justice of the European Union (CJEU) declared that Privacy Shield for the EU–US personal data was no longer lawful. You can move workflows across cloud regions depending on access to renewable energy consumption and store your data within a specific region or country. This is not only fueled by environmental purposes but mainly due to data privacy concerns and the need to have better visibility and control of what continent or what country your data is stored and processed in.
Energy consumption
The second-largest factor contributing to your carbon emission is the data center’s energy consumption. Energy consumption is a closely watched indicator of environmental sustainability.
Primarily, energy consumption within data centers stems from three factors:
- Servers
- Cooling
- Power distribution and uninterruptable power supply (UPS)
Memory power draw is a huge source of waste because the energy consumption depends on the memory available, not the actual usage; only requesting the necessary memory is a painless way to reduce GHG emissions.
The Green Grid organization has introduced a few key benchmarks, and the most used is PUE (Brady, et al. 2013). PUE can be defined as the total electrical power supplied to the data center divided by the power consumed by IT equipment:

The lower the value of PUE, the more efficient the data center is. The lowest theoretical number should be as close to zero, that is, as little overhead as possible. A PUE close to 1.0 is ideal. However, some argue that if the heat can be recovered and used for heating nearby households, a PUE number as close to 1.0 is not crucial since it replaces other energy sources such as coal and gas. Later in the chapter, we will look at a case study from EcoDataCenter, which recovers the heat and sends it back out on the grid for district heating. As illustrated in Figure 4.8, the average enterprise data center sits around a PUE of 1.65%, which means that 65% is overhead. In an average small data center, the PUE sits at 2.0, which means a staggering 100% overhead will be wasted (Khaliq uz Zaman, et al. January 2019). However, the problem primarily centers around the utilization of the data center and not so much around the energy being spent. Therefore, a data center with a poor PUE could improve its numbers by optimizing the existing workload or adding additional workloads. Utilizing the cloud hyperscalers only generates an overhead of between 1.10 and 1.15 PUE, which means only 10%–15% of the energy will go to waste:
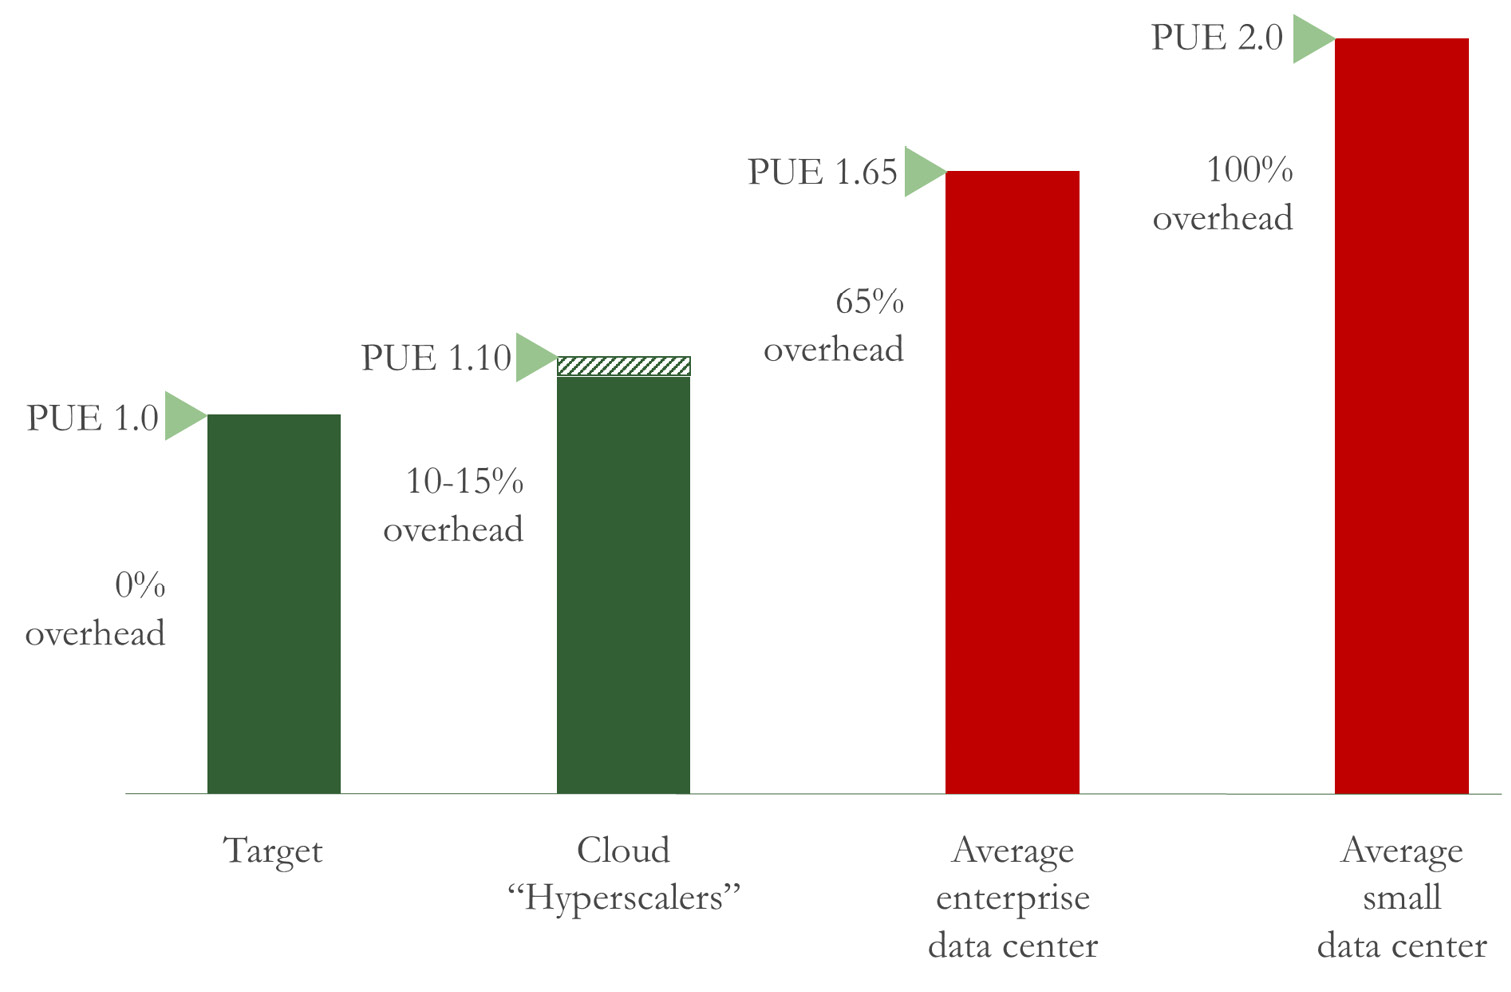
Figure 4.8: PUE comparison
We are all going to have different starting points. If you are a large global enterprise with thousands of servers, you have probably gone through a consolidation phase several times. Your PUE will probably be around the industry average of 1.65. This means that you still have a significant opportunity for improvement to drive down your PUE closer to 1. The PUE gives us a clear indicator of where we sit on this scale and what actions we can take. In some cases, such as edge data centers, which are small data centers located close to the edge of the network, where latency and portability are more important than economies of scale, a higher PUE than the industry average might be acceptable.
If you are a start-up company, your default option is probably to partner with one of the cloud vendors from day one instead of investing in your infrastructure. Fortunately, this means that your PUE will be low right out of the gate no matter what cloud vendor you choose; therefore, your PUE should be closer to 1.10. Remember, where you place your workload can still significantly impact your carbon intensity.
Moving to the cloud is not an option for some workloads due to legacy, privacy, security, or legislative reasons. Therefore, you need to work with your existing infrastructure estate to improve the energy overhead. Regardless, it is essential to track your PUE over time to ensure that you make stepwise improvements to reduce your overall overhead.
Moving from on-premises infrastructure to cloud computing offers significant energy savings and reduced carbon costs. The energy-efficient data centers and optimized servers are where utilization is high. That will immediately reduce the impact on your workload by a factor of 2, 3, 4, and maybe even more, says Urs Hölzle, Senior Vice President, Technical Infrastructure at Google (Google 2021).
Table 4.1 illustrates the PUE value of some of the “tech giants” such as Google, Microsoft, HP, and Facebook, all in the range of 1.08–1.19. Amazon does not disclose its PUE; therefore, that data point is unfortunately not available for comparison:
|
Organization |
PUE value |
|
|
1.12 |
|
Microsoft |
1.12 |
|
HP |
1.19 |
|
|
1.08 |
|
Yahoo! |
1.08 |
|
eBay |
1.45 |
|
Alibaba |
1.08 |
|
Tencent |
1.12 |
|
IBM |
1.53 |
Table 4.1: The PUE values of different companies (Khaliq uz Zaman, et al. January 2019) (IBM 2021)
Here is a word of caution regarding the PUE values from the preceding table: the vendors themselves report these numbers, so in most cases, they have not been verified by an independent outside auditor.
Life cycle assessment
The third-largest factor contributing to your carbon emission is managing the life cycle from the cradle to the grave. This is mainly for data center facilities but especially IT hardware equipment such as servers, routers, and switches. We have dedicated an entire Chapter 6, IT Hardware Management to this topic.. Still, in this section, Sophia Flucker, director at Operational Intelligence Ltd, shares her perspective on data center life cycle impacts. Sophia is a data center expert whose experience includes low energy cooling designs, commissioning, risk and energy assessments, capacity management, and training. She has authored several research papers. For additional reading, some of her work has been cited in the Further reading section of this chapter.
An Introduction to Data Center Lifecycle Impacts
Sophia Flucker, Director at Operational Intelligence Ltd
The high-energy consumption of data centers is well known. In recent years, their design and operation have become more energy-efficient due to increasing awareness of best practices, energy costs, and corporate targets around sustainability. Although important, the energy consumption of power, cooling, and IT equipment is only part of their environmental impact. Many organizations also look at the carbon impact of their energy consumption, but this is still not the whole picture.
Life cycle assessment (LCA) is a tool for assessing a product, process, or service’s holistic impact on the environment. An LCA looks at the systems’ products and processes from the cradle to the grave, from the extraction of raw materials through manufacturing, transportation, operation, and eventual subsequent lives and disposal. The international standards BS EN 14040 and 14044 set out the principles and framework, requirements, and life cycle assessment guidelines.
The embodied impacts of the data center include the extraction and transformation of raw materials to fabricate the IT equipment, infrastructure (building services and network), and construction of the building itself, usually comprising tons of steel and concrete. The embodied impacts also include the end-of-life phase; in many cases, these impacts are high due to unsafe and polluting disposal practices and low recycling levels. The embodied impact of IT equipment is exceptionally high due to the specific materials and processes involved in the manufacturing and disposing of electronics and their frequent refresh rate. The embodied impact of the infrastructure is also relatively high compared to that of the building. Considering the environmental impact more widely, we, therefore, also need to take into account the embodied carbon from IT equipment.
However, environmental impacts include water consumption, air and water pollution, global warming, and damage to ecology; there are thousands of parameters that can be measured. These are grouped into damage categories in LCA, typically resource use, human health, and ecosystem quality. A standard unit is required to compare carbon dioxide emissions with other impacts. Eco-indicator points are one example of this, which equates to an average European person’s impact during a year. In the case of a data center, a functional unit of points/kW IT/year may be used.
Part of the difficulty with considering the embodied phases and impacts beyond energy consumption is the availability of data and the level of analysis required. A high variability of results can be achieved depending on assumptions. With the application of any metrics, there is a balance between accuracy and ease of use.
The problem with only considering operational energy consumption, for example, is the risk of burden shift. To save energy, older, less efficient equipment may be replaced. This may not improve the total impact due to an increased embodied impact (it could even make things worse). Without having the tools and data to measure the trade-offs, decisions are not made in an informed way.
Research shows that depending on location and source energy, the embodied environmental impact may be a similar order of magnitude or even exceed the operational environmental impact. Using renewable energy makes a big difference. Although not easy to measure, dematerialization in design reduces embodied impact. This involves designing out unnecessary components and has the added advantage that simpler designs tend to be more reliable, easier to operate and have reduced CAPEX and maintenance costs.
The industry is becoming more aware that data center sustainability goes beyond energy consumption. However, making the business case for other sustainability improvements is more complicated. Intangibles such as reputation and brand are drivers, but their value is hard to quantify.
Data center sustainability score card
Finally, as we have not gone through the different levers you can use to reduce your carbon intensity, let us look at how we can summarize these critical metrics in a data center sustainability score card:
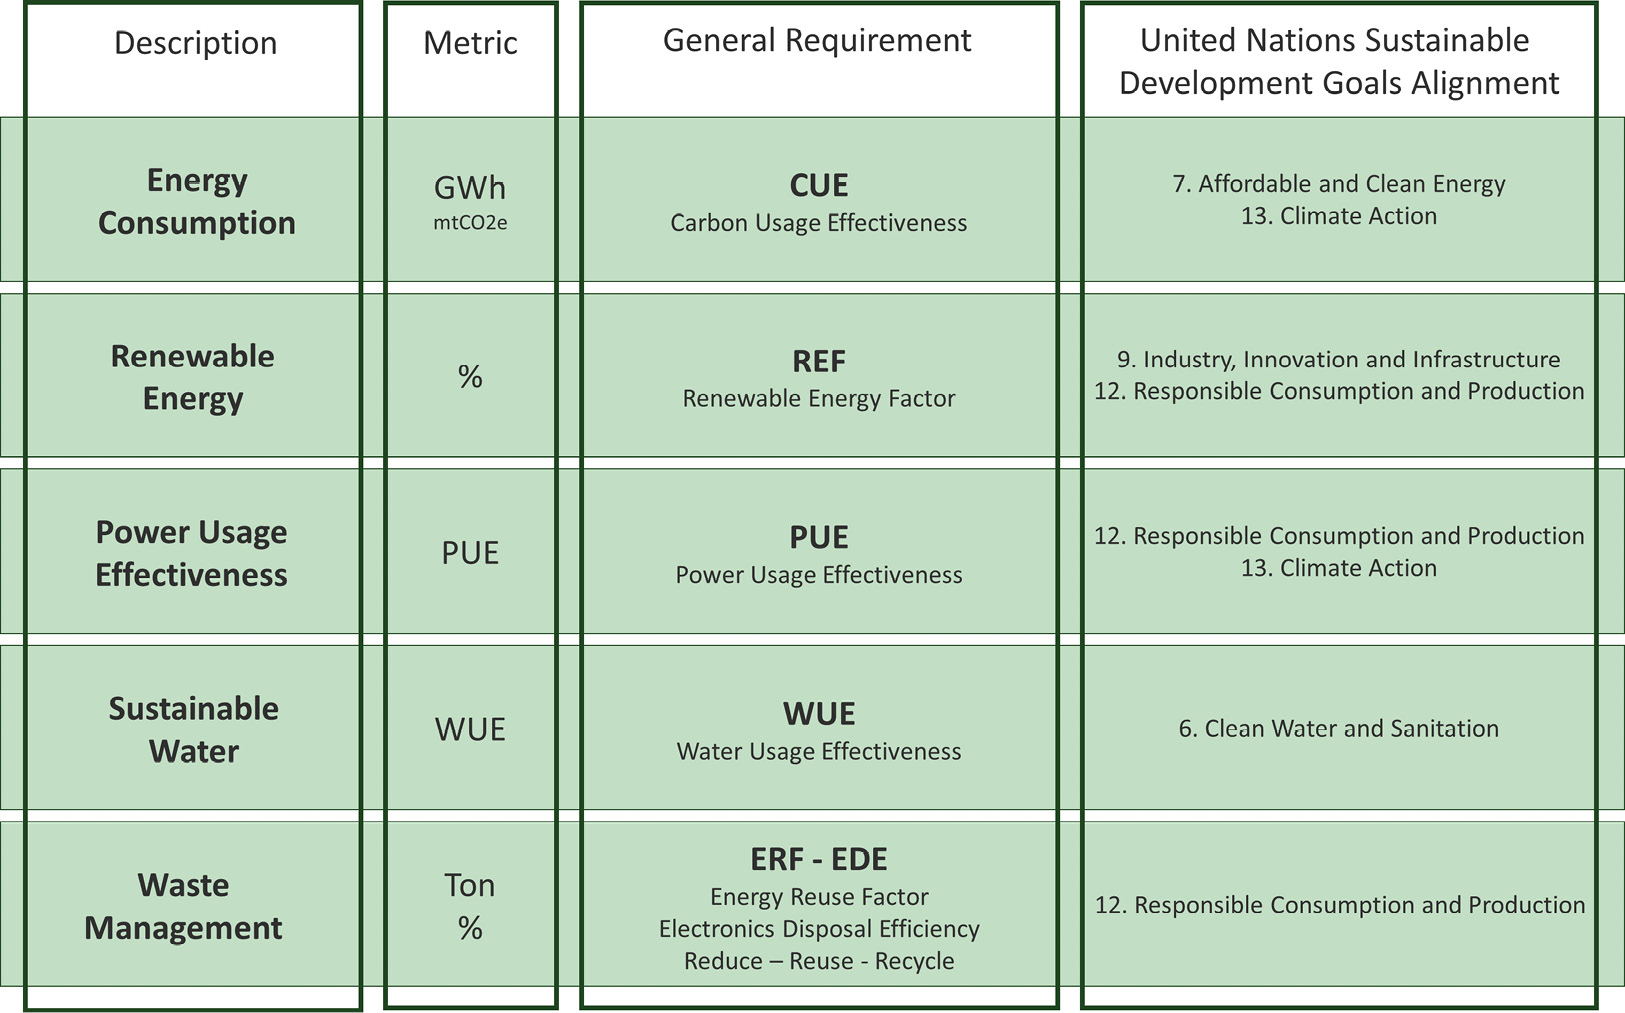
Figure 4.9: A data center sustainability score card
You should be aware of five key areas and six critical KPIs for managing your energy, water, and waste. These standardized KPIs are ISO certified (ISO/IEC 30134 2027/8 EN 506001-3). The right-hand side of the preceding figure also highlights how each key area is connected to the United Nations’ 17 Sustainable Development Goals (SDGs). This will enable you to track and follow up on your progress toward a sustainable IT practice. These are the essential requirements you should put on your IT service provider or cloud provider to disclose.
Now that we have learned about the ins and outs of the cloud, let us look at how you can choose a sustainable cloud service provider to achieve your goals.
The rise of the net-positive cloud
As we set a high and ambitious goal toward a net-zero future, some companies are taking an even bolder stance and setting a net-positive ambition for their data center business, including companies such as Equinix, atNorth, EcoDataCenter, and Bahnhof from data center infrastructure providers such as Schneider Electric and Alfa Laval. Together with utility providers such as Stockholm Exergi, Vattenfall, and other utility providers, excess heat and wastewater are captured from data centers and pushed back to the utility provider who can then pass it on to the district heating network for heating residential, commercial, and industrial facilities, creating a net-positive equation. Let us take a closer look at the Swedish data center provider EcoDataCenter, which has paired up with the municipality of Falun and the Falun district heating and cooling supplier to create a net-favorable ecosystem:
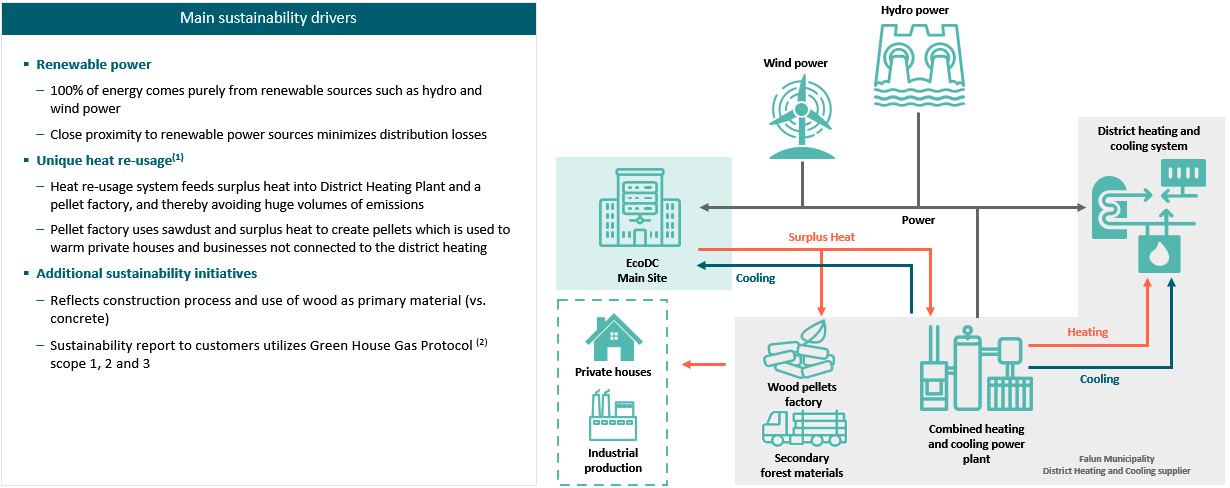
Figure 4.10: The EcoDataCenter ecosystem with Falun municipality district heating and cooling (Image courtesy of EcoDataCenter)
The data center has been placed strategically adjacent to the district heating and cooling system facilities and a wood pellet factory to create a net-positive ecosystem. A similar premium location would be in a more densely populated area where the excess heat could be captured and funneled into the district heating network for heating. EcoDataCenter already has two data centers in production and is building a third one in the same location.
The data centers are built with the following critical design principles:
- The construction of data centers should be built sustainably from land, design, materials, construction, connectivity, technology installations, and life cycle management including end-of-life circular practices.
- The data centers should be powered with 100% renewable energy.
- There should be a responsible use of resources by capturing surplus heat and water.
- Captured surplus heat should be fed back to the heating and cooling plant to be redistributed to private houses or industrial production or be used to power the nearby wood pellet factory. For existing data centers, it is unfortunately not that simple to rearchitect a building to be able to funnel back excess heat through additional piping. Also, depending on the location, the data center needs to be in a densely populated area for it to make sense to capture the excess heat and redistribute it into the district heating network. In Boden, in the northern part of Sweden, where the population density is scarce, they are experimenting with building a giant 300-square-meter greenhouse to increase food production from crops in the north by leveraging excess heat from local data centers (SVT Nyheter 2022).
So, how can this ecosystem be net-positive, you might ask? Let us look at EcoDataCenter’s emission flow and the numbers behind it that encapsulate the entire life cycle:
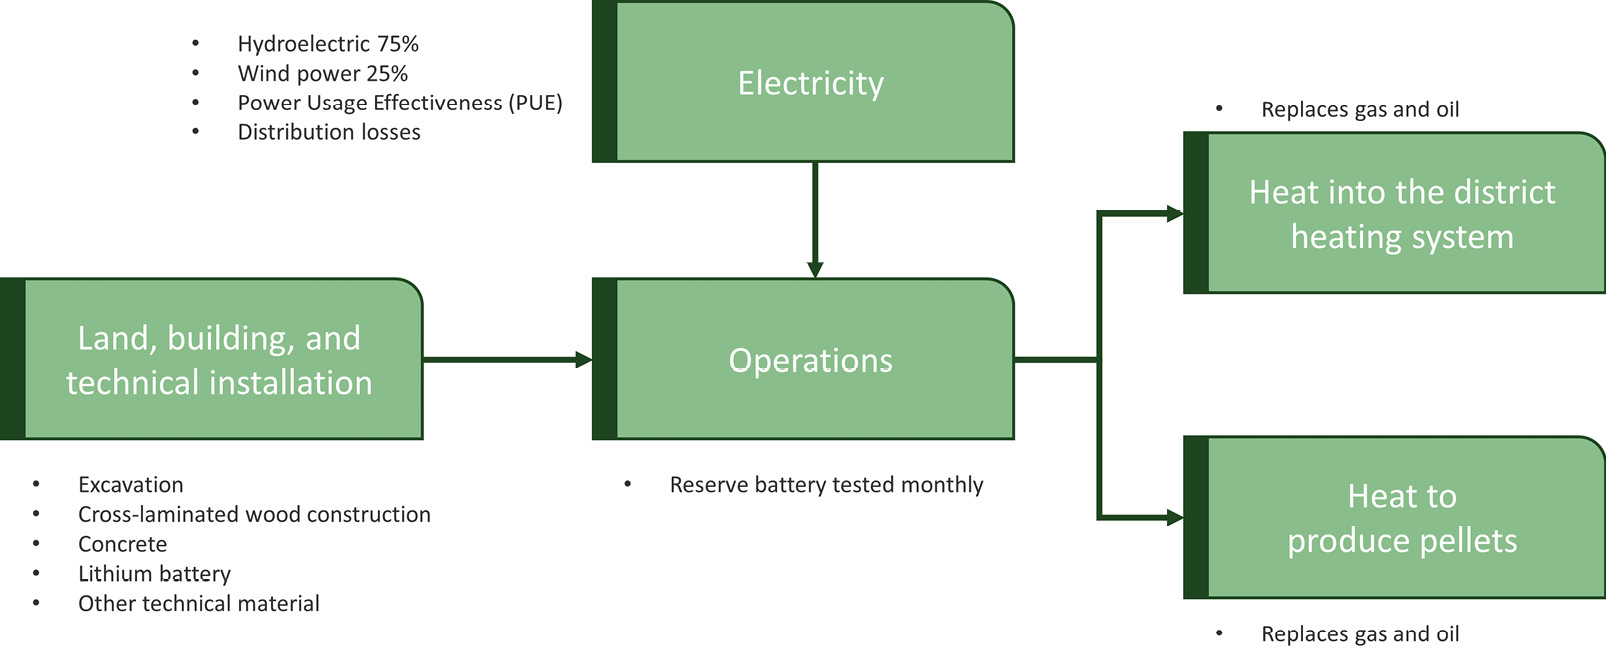
Figure 4.11: EcoDataCenter’s emissions flow
Let us briefly discuss each point:
- Land, building, and technical installation: Let us start from the left-hand side with the construction of the data center. In EcoDataCenter’s calculations, everything is accounted for in their CO2 emission calculation by seeking out land, excavation, building materials such as cross-laminated wood, concrete, lithium batteries for backup, and other technical materials.
- Electricity: Once the data center is operational, EcoDataCenter’s data centers are powered by renewable energy sources with a grid mix of 75% hydroelectric and 25% wind power. The PUE is monitored continuously to ensure the effective use of the energy overhead. Since the surplus heat is captured, having as low a PUE as possible is not necessarily an absolute target since downstream actors are dependent on the excess heat.
- Operations: Operations are responsible for running the data center to ensure an optimal grid mix of renewable energy. There is monthly testing of reserve power generators to ensure business continuity in a grid failure. They ensure that the inbound flow of energy and cooling and the outbound flow of surplus heat and cooling are optimal. Reserve power consists of diesel generators, which are part of the overall calculation.
- Downstream actors: The surplus heat is either fed back to the district heating and cooling system or the nearby wood pellet factory. The surplus heat is fed back into the district heating system and pushed out to the grid to private houses or industrial production. If the grid is saturated, the surplus heat is fed into the wood pellet factory to power the production of wood pellets. Capturing the excess heat significantly reduces the cost of electricity since it can be regenerated and resold for a second use, avoiding fossil fuels such as oil and gas.
Now that we have walked through each of the different actors, let us look at how this translates into numbers and how they play out between scopes 1, 2, 3, and 4. Table 4.2 illustrates the CO2 equivalent calculation per kilowatt-hour consumed. This includes all phases of the data center life cycle:
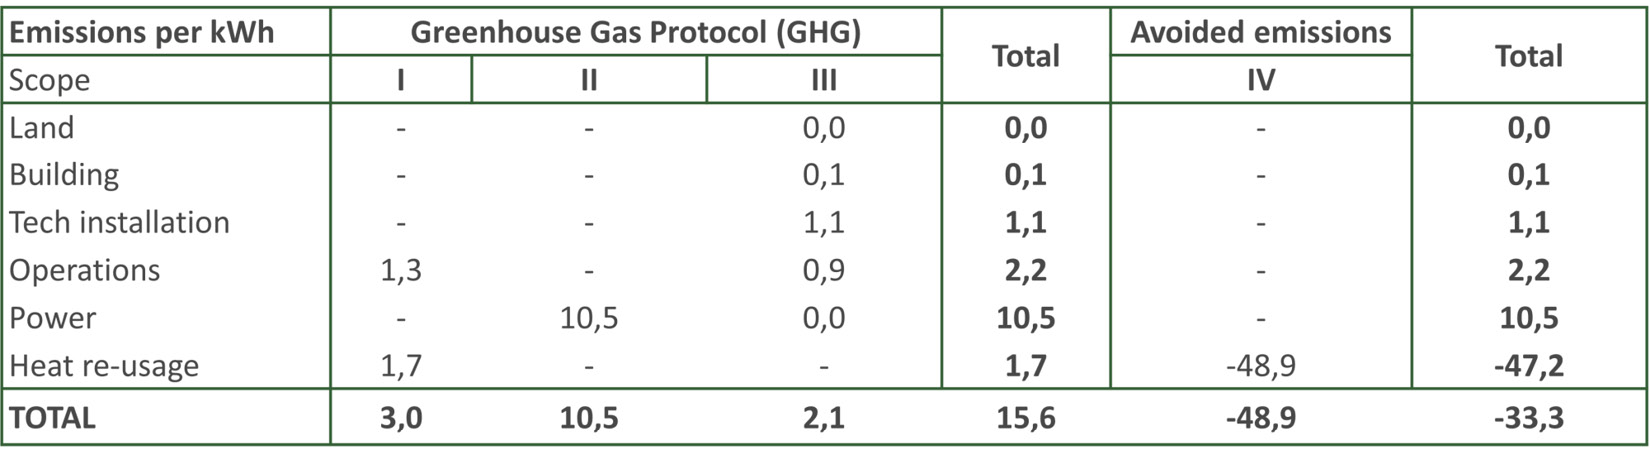
Table 4.2: The CO2 equivalent calculation
In the preceding table, only Operations and Heat re-usage fall under scope 1. The electricity used to power the data center falls under scope 2, and land, building, technology installations, and third-party operations fall under scope 3. The construction of the building is made from wood instead of concrete and cement, which also results in a low emission value for the building itself.
These categories sum up to a CO2 emission of 15.6 grams per kilowatt-hour. If you remember from Figure 4.7, the average, in Sweden, to power one kilowatt hour amounts to 27 grams of CO2 emission. So, in this case, our emissions are close to half of the average. So, where does the net-positive effect come in, you might ask? It comes in under scope 4, which is best known as avoided emissions. Scope 4 is not formally part of the GHG protocol, but it is under review. Since the surplus heat is fed back to the power grid and reused to power private houses, industrial production, and the wood pellet factory, using coal and gas for heating is not needed, resulting in avoided emissions.
This methodology has been audited by Carbon 3 IT Ltd, a UK-based sustainable IT consultancy firm.
So, what can we learn from this example? Achieving net-positive from your data center and cloud operations requires forward-looking and meticulous planning. It begins long before you start construction on your data center to ensure that the inbound and outbound flow of scarce resources such as energy and water has been carefully planned. It is possible to retrofit an existing data center to capture surplus heat and cooling, but it might be very costly.
As mentioned earlier, there are other data center providers that leverage the same technique to capture excess heating and feed it back to the district heating network. So far, at the time of writing, I have not seen any official communication from any of the hyperscalers taking full advantage of this process – although some hyperscalers’ co-location parts Equinix, leverage this technique where it is feasible (Equinix 2022). They primarily focus on optimizing energy and water use for cooling and ensuring access to renewable energy. This is a lost opportunity to not capture the surplus heat and ensure it is being regenerated and fed back into the grid for a second use.
Choosing a sustainable cloud service provider
While organizations worldwide adopt cloud computing, few are aware of its environmental impacts. Choosing a hyperscaler with a proven track record in IT operational efficiency, IT equipment efficiency, data center efficiency, and renewable electricity gives you significant environmental benefits. When organizations choose low-carbon cloud computing, they take an essential step forward on sustainability. Sustainable digital transformation, powered by a cleaner cloud, enables the creation of a sustainable and thriving economy that works for people and the planet in the long term. Lance Pierce, president of Carbon Disclosure Project, North America (Microsoft News Center 2018).
Some of the world’s largest cloud hyperscalers have taken significant steps toward becoming more sustainable, but is it enough? It is, however, important that there are differences in their offering, and you should dissect the subtle differences that exist.
If you are already using or planning to choose cloud vendors, you should put forth several vital requirements.
Here is a list of essential sustainability requirements for cloud providers:
- Breadth and depth of sustainability strategy
- Percentage of renewable energy
- Number of locations that guarantee 100% renewable energy
- Choosing a vendor that can guarantee 100% renewable energy by 2025 across its entire estate
- PUEs specific to your services
- Committed to preserving scarce resources such as water and rare minerals
- A commitment toward circularity practices such as zero waste and the responsible use of IT equipment
- Climate adaptation measures
- Promotes biodiversity and curbs deforestation during new constructions
- GHG emission reporting from the utilization of services
- Ability to mitigate your scope 3 emission liability
Let us look at the main hyperscalers – Microsoft Azure, Google Cloud, AWS, Alibaba Cloud, Oracle, Tencent Cloud, and IBM – including what public commitments they have made and how they stack up against our sustainability requirements.
Microsoft Azure
Microsoft is one of the biggest companies globally, with a market cap of roughly 2 trillion USD, which makes them in the run for the most valued company in the world. Founded in 1975 by Bill Gates and Paul Allen, Microsoft has grown to be one of the giants in the tech sector and the world. In 2000, Bill Gates stepped down as the CEO of Microsoft, and together with his wife Melinda, he formed the Bill and Melinda Gates Foundation in the same year, focusing on fighting poverty, disease, and inequity worldwide. With this philanthropic ore running through the company, it should be no surprise that Microsoft is making big bets on sustainability. In October 2020, CEO Satya Nadella and Brad Smith, Executive President, announced some ambitious sustainability goals.
At the time of writing, Microsoft has made the following public commitments:
- They are planning to become carbon negative by 2030, effectively committing themselves to remove more carbon from the atmosphere than they emit.
- To use 100% renewable energy by 2025. The goal for 2023 is that 70% of Microsoft’s data centers should be powered by renewable energy.
- Water positive by 2030.
- Zero waste by 2030.
- By 2050, remove all historical emissions since the inception of the company.
Microsoft set its first carbon reduction goal in 2009 and became carbon neutral in 2012 by investing in “high-quality carbon offsets” to offset its carbon emission. To engage internal employees, in 2012, an internal carbon fee was instituted, and in 2019, the carbon fee was raised to $15 per metric ton of carbon emissions to encourage its departments to be as sustainable as possible. In June 2022, that figure was raised to $100 per metric ton of carbon emission. For example, a round-trip flight between Boston and London generates 1.9 metric tons of CO2 equivalent per passenger and costs a Microsoft employee an additional $190 that goes into an internal innovation fund. This fund is dedicated to sustainable innovation and projects internally.
An example of Microsoft’s climate innovation is the three data centers in Sweden that have been constructed, which are the first of their kind from a sustainability perspective. There is a commitment from Microsoft that the data centers in Sweden should be zero-emission facilities including its operations and full life cycle management. To start, the buildings are LEED Gold standard certified (Wingren 202). The ambition is to run the facilities with 100% renewable energy, and there is also a 24/7 renewable energy matching mechanism in place with the Swedish utility provider Vattenfall to match any fossil fuel emission on an hourly basis. The backup power generators will be mainly powered with Preem Evolution Diesel Plus, the world’s first Nordic Ecolabelled diesel (“Svanen märkt”), which contains at least 50% renewable raw material and almost a corresponding reduction in net CO2 emissions compared to standard fossil diesel blends.
Microsoft’s sustainability reports are available online at https://www.microsoft.com/sustainability, and if you are interested in their sustainability work regarding their Azure services and Data Center and Cloud services, visit https://azure.microsoft.com/global-infrastructure/sustainability.
Google Cloud
Google Cloud Platform (GCP) is one of the global leaders in the cloud space. Google is a company that prides itself on its unofficial motto, “Don’t Be Evil,” and corporate social responsibility runs through the company’s veins. Within the tech sector, Google was one of the first major players to become carbon neutral in 2007. Not from its operations but by investing in “high-quality carbon offsets” such as Power Purchase Agreements (PPA). In 2021, Google was the sixth largest buyer worldwide of PPA (BloombergNEF 2021).
At the time of writing, Google has made the following public commitments:
- Use 100% CFE by 2030.
- Google also aims to run its data centers on CFE by 2030 (BBC 2020).
- Replenish 120% of Google’s water usage by 2030.
- Maximize the reuse of resources across Google’s companies by 2030.
At the time of writing, Google offers 10 low-carbon regions primarily centered in Europe and North America (Google 2022). According to Google, to be classified as a low-carbon region, the region must have a CFE percentage of at least 75%, or if CFE% is not available, a grid carbon intensity of 200 gCO2eq/kWh. Google already has the capability to dynamically shift workloads to locations where renewable sources are being used (Moss 2021). Google offers their customers to take a low-carbon policy driven approach to only allow for workload to be set up in regions tagged as low-carbon regions.
You can find out more about Google’s sustainability work online at https://sustainability.google/commitments and https://cloud.google.com/sustainability.
Amazon Web Services
The ambitions of AWS are reasonably like those of Microsoft and Google, but they are not as ambitious in their time scale to reach them.
At the time of writing, AWS has made the following public commitments:
- Amazon is committed to being carbon neutral by 2040.
- Utilize 100% renewable energy by 2025 for all of Amazon’s businesses.
- 50% of all shipments should be carbon neutral by 2030.
Although Amazon has made some bold statements on future commitments, it is currently falling short of its promises. Currently, Amazon only offers five carbon-neutral regions, which are listed as follows:
- US West (Oregon)
- European Union (Frankfurt)
- European Union (Ireland)
- AWS Govcloud (United States)
- Montreal (Canada)
Being one of the market leaders in the cloud space, this is not good enough from a sustainability perspective. For example, when you sign up for an AWS account and do not actively choose a region, it will direct you to US East, which is powered by non-renewable energy. If you are an existing customer, you can move your workload into any of these regions if your setup allows you to do so. Please bear in mind the legal challenges and data privacy while contemplating moving workloads cross-border.
Does this mean you should choose vendors such as Google and Microsoft over Amazon from a sustainability perspective? Not necessarily, but it does make it easier to choose a sustainable alternative over a non-sustainable one. As mentioned earlier, AWS has added sustainability, published in December 2021, as their sixth pillar within their AWS Well-Architected Framework, so they are taking important steps to both become more sustainable but also to enable their customers to run more sustainably (AWS 2022).
At this point, they are a long way from meeting their sustainability targets but do not count AWS out just yet. They are continuously investing in new sustainable ways to manage energy and water. They have already invested in 6.5 GW of wind and solar projects – to power their AWS data centers and fulfillment centers. In 2021, Amazon was the biggest buyer worldwide of PPE, closely followed by Microsoft and Meta/Facebook (BloombergNEF 2021). In 2019, Amazon also co-founded The Climate Pledge – a commitment to be net-zero carbon across the business by 2040, 10 years ahead of the Paris Agreement. They are also inviting others to sign up to this new level of ambition, and so far, 319 other businesses have also committed to The Climate Pledge.
To read more on Amazon’s sustainability work, visit https://sustainability.aboutamazon.com/governance, https://aws.amazon.com/sustainability/, https://docs.aws.amazon.com/wellarchitected/latest/sustainability-pillar/sustainability-pillar.html or https://www.theclimatepledge.com/.
Alibaba Cloud
Sprung out of the Chinese e-commerce giant, Alibaba Cloud (also known as Aliyun in Chinese) has emerged as a contender against US-based companies. Alibaba Cloud has a leadership position in China and its surrounding countries. Alibaba Cloud has emerged as a prime contender for Microsoft Azure and AWS for Chinese companies and companies operating in China. Google Cloud is not available in China.
At the time of writing, Alibaba Cloud has made the following public commitment:
- Alibaba Group, including Alibaba Cloud, has committed to achieving carbon neutrality by 2030 (Ferguson 2022).
Compared to Microsoft, Google, and Amazon, Alibaba has made very few public commitments and statements about its sustainability targets and development. Only achieving carbon neutrality by 2030 is a weak commitment in comparison to the frontrunners in the sustainability space. However, China has made a pledge to extend the country’s total wind and solar capacity to at least 1,200 GW by 2030 (Reuters 2022). Therefore, the tables can turn quickly and domestic companies such as Alibaba and Tencent will be able to power their data centers with renewable energy and surely be able to revise and make more aggressive commitments and achieve more sustainable results soon.
The Alibaba Cloud Sustainability Report 2021 can be found at https://www.alibabacloud.com/blog/alibaba-cloud-sustainability-report-2021_598055.
Oracle
Rising out of the database business with the ever-so-colorful founder and CTO Larry Ellison, Oracle is one of the world’s largest providers of software business applications. Within the cloud service provider space, in terms of the size and breadth of the service portfolio, Oracle is trailing the three major hyperscalers, AWS, Microsoft, and Google. Oracle Cloud Infrastructure (OCI) primarily focuses on lift and shift and hybrid workloads.
At the time of writing, Oracle Cloud has made the following public sustainability commitments:
- 100% renewable energy by 2025 to power Oracle Cloud.
- By 2025, reduce potable water per square foot by 33%.
- By 2025, reduce waste by diverting it to landfill per square foot by 33%.
- The net-zero target is to halve GHG emissions across operations and the supply chain by 2030 relative to the 2020 baseline and achieve net-zero by 2050.
In 2020, 56% of Oracle Cloud was powered by renewable energy, and only 34% of real estate and facilities. Just like Amazon, Oracle only offers a few regions that provide 100% renewable energy. They are, at the time of writing, listed as follows:
- Frankfurt
- London
- Amsterdam
- Stockholm
Having only four regions in Europe seems modest in contrast to the goal that by 2025, all of Oracle Cloud should be powered by 100% renewable energy. Even the water and waste goals seem modest compared to their peers.
Oracle’s 2025 sustainability goals can be found at https://www.oracle.com/corporate/citizenship/sustainability/operations.html.
Tencent Cloud
Tencent Cloud is a subsidiary of Tencent, a global internet-based platform company and one of the largest multimedia companies in the world based on revenue. Tencent Cloud primarily focuses on China and Chinese multinationals looking to expand overseas. Until 2021, there was limited material available regarding Tencent’s sustainability work. In 2021, Tencent undertook an internal review of its GHG emissions, resulting in the Tencent Carbon Neutrality Target and Roadmap Report. This report will act as a foundation for the company’s carbon neutrality goals.
At the time of writing, Tencent has made the following public sustainability commitments:
- Achieve carbon neutrality in its operations and supply chain by 2030 (Tencent 2022)
- Consume 100% green power by 2030 (Tencent 2022)
Since Tencent’s commitment to achieving carbon neutrality in its operations and supply chain and using 100% renewable energy by 2030 are new targets announced during quarter 1 of 2022, there is very little history of its progress. It has provided an indicative timeline for 2030 to reach its goal, but it is too early to say how it matches up against it. The company’s roadmap report focuses on three key initiatives to achieve net-zero emissions via energy efficiency, renewable energy, and carbon offsets. At the time of writing, I could not identify any data centers powered by renewable energy, but given Tencent’s recent commitment, that should hopefully change in the foreseeable future. As mentioned earlier, similarly to Alibaba, Tencent should also be able to leverage the Chinese government’s aggressive transition to renewable energy from fossil fuels.
Read more about and track Tencent’s progress at https://www.tencent.com/en-us/responsibility/reports.html.
IBM
Like Oracle, IBM is a challenger within the cloud service provider space, primarily focusing on lift and shift use cases and large- and medium-enterprise customers. IBM Cloud prides itself on offering an open and secure hybrid multi-cloud platform, OpenShift, for greater agility and continuity. The OpenShift technology came with the acquisition of Red Hat in the summer of 2019. On the subject of sustainability, IBM has a long-standing posture on the environmental policy, which dates to 1971, when the first corporate environmental policy was issued one year before the first UN climate conference in Stockholm.
At the time of writing, IBM has made the following public sustainability commitments:
- By 2025, 75% of electricity in IBM Cloud data centers should be renewable, and 90% by 2030 (Sethi 2021)
- Ambition to reach net-zero by 2030, covering scope 1 and scope 2 emissions along with the scope 3 emissions associated with co-location data centers (IBM 2021)
- Divert 90% (by weight) of non-hazardous waste from landfills and incineration by 2025 (IBM 2021)
At the time of writing, IBM Cloud’s Multizone Regions in London & Sao Paolo provide 100% renewable energy and IBM Cloud is working to significantly increase its procurement of renewable electricity across its other regions in alignment with IBM's corporate goals.
Although IBM has 50 years of environmental leadership and several of IBM Cloud’s data centers are 100% renewable, at the time of writing it offers two IBM Cloud Multizone Regions with 100% renewable energy which seems like a meager ambition level. Comparing the share of renewable energy purchased between 2017 and 2021, IBM has moved from 39.0% to 64.2%, making steady progress toward its 2025 goal of having 75% procured renewable energy. Unlike Google, Microsoft, and Amazon, IBM does not purchase nature-based carbon offsets to claim emissions reductions.
Read more about IBM’s sustainability journey at https://www.ibm.com/se-en/impact/sustainability.
Cloud vendor report cards
Now that we have walked through each cloud service provider, let us look at how they stack up against each other regarding their sustainability commitments:
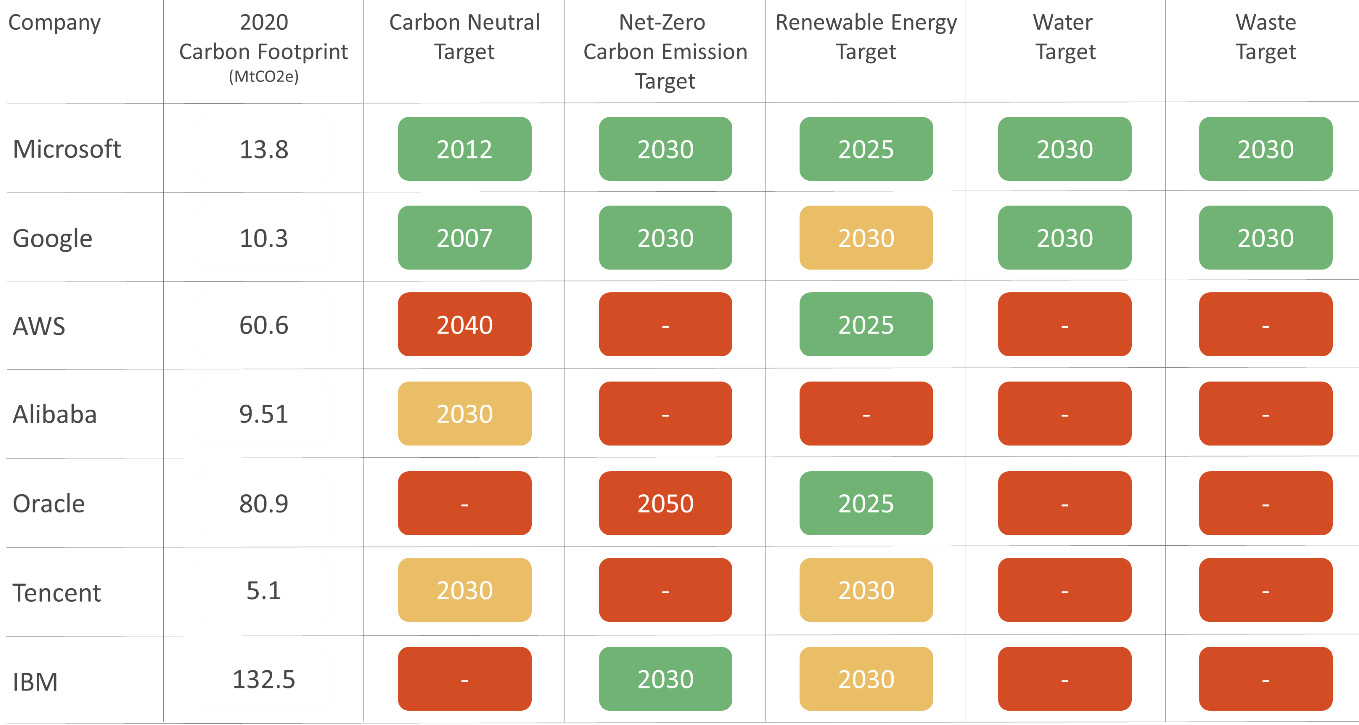
Figure 4.12: Cloud service provider sustainability commitment comparison
Out of the seven cloud service providers, Microsoft and Google stick out as the pack leaders regarding actions and commitment. Google and Microsoft have been carbon neutral since 2007 and 2012, respectively, and they have both set targets to be at net zero no later than 2030. All the vendors, at the very least, have a target to reach carbon neutral or net zero but lack the ambition of when they will do so. Most of them also still lack clear and tangible water and waste targets.
You might be wondering what the difference between carbon-neutral and net-zero carbon emissions is. Carbon neutral means that any CO2 emission released into the atmosphere from a company’s activities is balanced by removing an equivalent amount. This means that Microsoft and Google invest in “high-quality carbon offsets” to offset their emissions. Being at net-zero emissions balances the whole amount of GHG released and the amount being removed from the atmosphere.
The power of alliances
As digital transformation is rapidly reshaping our society and our industries, we are becoming increasingly dependent on digital infrastructure. This chapter shows that the cloud is primarily shaped by seven large global providers based in either the United States or China. As society becomes increasingly dependent on utilizing products and services powered by the cloud, it is essential to ensure that they run sustainably. As a single enterprise, organization, or government, it might not be that easy to raise your sustainability concerns to the major tech giants such as Microsoft, Google, and AWS. This is where the power of alliances comes in:
Figure 4.13: Examples of external green and eco-sustainability agencies
The following is a brief description of each external green and eco-sustainability agency:
- European Commission (EC) – Addressing the issue of growing energy consumption and the expansion of cloud services in Europe, the EC conducted a study on green cloud and green data centers, exploring ways to improve energy efficiency and circular economy performance. The study concluded that data centers need to become more energy efficient, increase the share of renewable energy sources, and reuse waste energy such as heat (https://digital-strategy.ec.europa.eu/en/policies/green-cloud).
- U.S. Green Building Council (USGBC) – Custodian of LEED (Leadership in Energy and Environmental Design), the most widely used green building rating system in the world (https://www.usgbc.org).
- Building and Construction Authority (BCA) – Custodian of the BCA Green Mark rating system designed to evaluate a building’s environmental impact and performance (https://www1.bca.gov.sg/).
- European Battery Alliance (EBA) – An alliance launched in 2017 by the industry, the scientific community, EC, and EU countries as a response to Europe’s ambition to make Europe a global leader in sustainable battery production and use (https://single-market-economy.ec.europa.eu/industry/strategy/industrial-alliances/european-battery-alliance_en).
- ISO 50001 Energy Management – ISO Standard with a focus on conserving resources and improving the bottom line through efficient energy management (https://www.iso.org/iso-50001-energy-management.html).
- Center for Resource Solutions’ Green-e – A global certification program in clean energy certifications (https://www.green-e.org/).
- Energy Star – Program run by the U.S. Department of Energy that promotes energy efficiency. Using standardized methods, Energy Star provides information on the energy consumption of products and devices (https://www.energystar.gov/).
If you are looking for more specific independent data center alliances, Climate Neutral Data Center Pact and Sustainable Digital Infrastructure Alliance (SDIA) are two excellent places to start.
Climate Neutral Data Centre Pact
The EU is committed to making Europe the first climate-neutral continent by 2050 (CNDCP 2020). The Climate Neutral Data Center Pact sprung out of the EU’s European Green Deal. With the ambition to leverage technology and digitization to become climate neutral, it is widely recognized that data centers are an integral part of the sustainable future of Europe. Therefore, the Climate Neutral Data Center Pact aims to make data centers climate-neutral by 2030. Data center operators and trade associations that join the alliance are committing to the European Green Deal. However, the alliance is a self-regulatory initiative, so there is no oversight committee.
The Climate Neutral Data Center Pact has defined five critical objectives:
- Energy efficiency: High standard for energy efficiency needs to be met for data centers and server rooms with ambitious PUE targets.
- Clean energy: Electricity supply for data centers and server rooms must be matched with clean energy procurement.
- Water: Ambitions for water conservation targets must be set and met.
- Circular economy: Data center operators must ensure responsible use of servers and electrical equipment to ensure they are reused, repaired, and recycled.
- Circular energy system: Recovering surplus heat and passing it back into district heating systems and other heat users is an excellent opportunity for scope 4, avoiding carbon emissions. Each data center operator needs to explore the opportunity if it is environmentally sound and cost-effective.
Read more at https://www.climateneutraldatacentre.net/.
Sustainable Digital Infrastructure Alliance
The Sustainable Digital Infrastructure Alliance (SDIA) is an independent alliance focusing on measuring the environmental impact of the digital economy, decarbonizing society, and reducing the environmental impact by executing the roadmap to sustainable digital infrastructure by 2030.
The roadmap has been divided into six impact categories:
- Emissions (CO2-eq): CO2-eq – CO2 equivalents measure the global warming potential of a substance
- Energy consumption (kWh): kWh, that is, kilowatt-hour
- Electronic waste (WEEE): Waste from Electrical and Electronic Equipment
- Resource consumption (ADP): Abiotic Depletion Potential of resources such as fossil fuels, minerals, clay, and peat
- Pollution and socioeconomic (the cost of digital power).
Each impact category has several priorities with a clear objective, estimated timeframe, and link to the UN Sustainable Development Goals. Several steering groups have been formed to advance the roadmap to address critical challenges and identify solutions, initiatives, and areas for further research. Read more at https://sdialliance.org/.
Summary
In this chapter, you have learned about how we can make data centers and clouds run more sustainably. As an introduction to the topic, you have learned about the definition of the cloud, its service models, deployment models, and cloud characteristics, and the areas of responsibility from a customer, cloud provider, and resource provider perspective.
By now, you should understand the value the cloud can bring from an agility, scalability, reliability, resilience, cost optimization, and sustainability perspective. We introduced a set of sustainable metrics that you can apply to create your own data center sustainability score card.
Furthermore, you should better understand how sustainable and what public commitments the seven global cloud service providers, that is, Microsoft Azure, Google Cloud, AWS, Alibaba Cloud, Oracle, Tencent Cloud, and IBM, have made along with what their overall report card looks like.
We looked at a few use cases from Wipro and EcoDataCenter. Hopefully, you have gained insights into how to transfer from on-premises to the cloud and how it is possible to set up a net-positive data center by involving the right ecosystem players. Finally, you will better understand the Climate Neutral Data Centre Pact and Sustainable Digital Infrastructure Alliance and how you could get involved.
Here are a few key recommendations:
- Select data center operations and facilities that have demonstrable sustainability practices where practical.
- Review your entire application estate and consider removing redundant and duplicate applications. There is more about this in Chapter 5, Application and Data.
- Start shifting out resource-intensive and inefficient legacy applications in your application portfolio to enterprise cloud solutions that can power your ERP, CRM, SCM, and e-commerce.
- Utilize or shift to providers utilizing low carbon grids.
- Utilize or shift to energy-efficient equipment (servers, network equipment, etc.) and architecture in your data center operations.
- Monitor energy consumption down to the rack level.
- Move workflows across cloud regions depending on renewable energy consumption.
- Minimize data amounts wherever possible
- Use AI/ML to optimize data center utilization and improve cooling solutions.
- Consider the possibility of leveraging the ability to recover surplus heat and water and feedback to a local district heating and cooling provider to create a net-favorable ecosystem.
We have just scratched the surface as we reached the chapter’s end. Still, as a technology leader, you should understand the broad perspective, enabling you to start asking your vendors tough questions and identifying your direction of travel in the future in broad strokes. Suppose you are, for example, a data center manager or an infrastructure manager and want to dig deeper into these concepts. In that case, there are some recommendations in the Further reading section that will set you on the right track.
In the next chapter, Chapter 5, Application and Data, we will look at how you can start optimizing and decarbonizing your entire application portfolio down to a single application.
Further reading
- NIST Definition of Cloud Computing: https://nvlpubs.nist.gov/nistpubs/Legacy/SP/nistspecialpublication800-145.pdf
- Minimising Data Centre Environmental Impact – Beyond Energy Efficiency, Flucker et al. CIBSE
- Data Center Sustainability Index, Tozer et al. ASHRAE 2018
- Ecodesign Regulation on servers and data storage products:
- Code of Conduct for Energy Efficiency in Data Centres: https://joint-research-centre.ec.europa.eu/energy-efficiency/energy-efficiency-products/code-conduct-ict/code-conduct-energy-efficiency-data-centres_en
- Development of the EU Green Public Procurement (GPP) Criteria for Data Centres, Server Rooms, and Cloud Services:
https://publications.jrc.ec.europa.eu/repository/handle/JRC118558
- Data Center Handbook: Plan, Design, Build, and Operations of a Smart Data Center, Hwaiyu Geng, April 2021: https://www.wiley.com/en-us/Data+Center+Handbook%3A+Plan%2C+Design%2C +Build%2C +and+Operations+of+a+Smart+Data+Center%2C+2nd+Edition-p-9781119597551
- Stockholm Innovates District Heating with New Solutions and Renewable Sources: https://smartcitysweden.com/best-practice/401/stockholm-innovates-district-heating-with-new-solutions-and-renewable-sources/
- EcoDataCenter, CO2 equivalent calculation: http://www.ecodatacenter.se/
- Climate Neutral Data Centre Pact: https://www.climateneutraldatacentre.net/
- The European platform for the creation of a sustainable digital economy: https://sdialliance.org/
- The Open Computer Project Foundation (OCP): https://www.opencompute.org/
Bibliography
- Andrae, Anders S.G. 2020. “New perspectives on internet electricity use in 2030.” ResearchGate. June. Använd den 10 April 2022. https://www.researchgate.net/publication/342643762_New_perspectives_on_internet_electricity_use_in_2030.
- 2018. Apple. den 9 April. https://www.apple.com/newsroom/2018/04/apple-now-globally-powered-by-100-percent-renewable-energy/.
- AWS. 2022. https://aws.amazon.com/architecture/well-architected/?wa-lens-whitepapers.sort-by=item.additionalFields.sortDate&wa-lens-whitepapers.sort-order=desc. Använd den 25 July 2022. https://aws.amazon.com/architecture/well-architected/?wa-lens-whitepapers.sort-by=item.additionalFields.sortDate&wa-lens-whitepapers.sort-order=desc.
- Bala, Raj, Bob Gill, Smith Dennis, och David Wright. 2021. “Magic Quadrant for Cloud Infrastructure and Platform Services.” Gartner. July. Använd den 21 04 2022. https://www.gartner.com/doc/reprints?id=1-271OE4VR&ct=210802&st=sb.
- 2020. BBC. den 14 September. https://www.bbc.com/news/technology-54141899.
- BloombergNEF. 2021. 2H 2021 Corporate Energy Market Outlook. Använd den 01 April 2022. https://about.bnef.com/new-energy-outlook/.
- Brady, G., N. Kapur, J. Summers, och H. M. Thomson. 2013. “A case study and critical assessment in calculating power usage effectiveness for a data centre.” Energy Conversion and Management 76 155–161.
- CNDCP. 2020. “Home Page.” Climate Neutral Data Centre Pact. Använd den 23 April 2022. https://www.climateneutraldatacentre.net/.
- Condon, Stephanie. 2022. Record-breaking heatwave causes cloud-computing problems. den 19 July. Använd den 29 July 2022. https://www-zdnet-com.cdn.ampproject.org/c/s/www.zdnet.com/google-amp/article/the-uk-heat-wave-brings-down-some-oracle-and-google-cloud-data-centers/.
- Electricitymap. 2022. Climate impact per region. den 29 July. Använd den 29 July 2022. https://app.electricitymaps.com/map.
- Equinix. 2022. Green by design. Använd den 25 July 2022. https://www.equinix.com/data-centers/design/green-data-centers?ls=Advertising%20-%20Web&lsd=22q1_enterprise_digital-infrastructure+digital-infrastructure_/data-centers/design/green-data-centers_dm_obility_paid-search_google_us-en_AMER_Brand_demand-gen&utm.
- European Commission. 2022. REPowerEU: A plan to rapidly reduce dependence on Russian fossil fuels and fast forward the green transition. den 18 May. Använd den 29 July 2022. https://ec.europa.eu/commission/presscorner/detail/en/IP_22_3131.
- Ferguson, Iain. 2022. Going Green with Cloud: How to Achieve Your Sustainability Objective. Alibaba Cloud. den 26 January. Använd den 31 January 2022. https://www.alibabacloud.com/blog/going-green-with-cloud-how-to-achieve-your-sustainability-objectives_598517.
- Gartner. 2021. Gartner Says Four Trends Are Shaping the Future of Public Cloud. Gartner Inc. den 2 August. Använd den 31 January 2022. https://www.gartner.com/en/newsroom/press-releases/2021-08-02-gartner-says-four-trends-are-shaping-the-future-of-public-cloud?spm=a2c65.11461447.0.0.964e28c6a8EcQ2#:~:text=Gartner%20forecasts%20end-user%20spending,less%20than%2017%25%20in%202021.
- Google. 2022. Carbon free energy for Google Cloud regions. Använd den 26 07 2022. https://cloud.google.com/sustainability/region-carbon.
- —. 2021. Google Masterclass. Använd den 25 07 2022. https://sustainableitdecoded.withgoogle.com/en-gb/dashboard.
- IBM. 2021. “2021 ESG Report.” IBM. Använd den 22 April 2022. https://www.ibm.com/impact/files/reports-policies/2021/IBM_2021_ESG_Report.pdf.
- IDC. 2021. Cloud Computing Could Eliminate a Billion Metric tons of CO2 Emission Over the Next Four Years, and Possibly More, According to a New IDC Forecast. IDC. den 08 March. Använd den 31 January 2022. https://www.idc.com/getdoc.jsp?spm=a2c65.11461447.0.0.964e28c6a8EcQ2&containerId=prUS47513321.
- 2020. IoT Growth Demands Rethink of Long-Term Storage Strategies. IDC. den 20 July. https://www.idc.com/getdoc.jsp?containerId=prAP46737220.
- Kamiya, George. 2021. Data Centres and Data Transmission Networks. November. Använd den 1 April 2022. https://www.iea.org/reports/data-centres-and-data-transmission-networks.
- Khaliq uz Zaman, Sardar, Atta ur Rehman Khan, Junaid Shuja, Tahir Maqsood, Faisal Rehman, och Saad Mustafa. January 2019. “A Systems Overview of Commercial Data Centers: Initial Energy and Cost Analysis.” International Journal of Information Technology and Web Engineering.
- Khan, A. R., M. Othman, och A. N. Khan. 2013. “A Novel Application Licensing Framework for Mobile Cloud.” International Conference on Future Trends in Computing and Communication Technologies 127-131.
- Lacy, Peter, Paul Daugherty, Pavel Ponomarev, och Kishore Durg. 2020. The green behind the cloud. Accenture. den 22 September. Använd den 31 January 2022. https://www.accenture.com/_acnmedia/PDF-135/Accenture-Strategy-Green-Behind-Cloud-POV.pdf.
- Microsoft News Center. 2018. The Microsoft Cloud can save customers 93 percent and more in energy and carbon efficiency. Microsoft. den 17 May. Använd den 27 January 2022. https://news.microsoft.com/2018/05/17/the-microsoft-cloud-can-save-customers-93-percent-and-more-in-energy-and-carbon-efficiency/#:~:text=%E2%80%94%20May%2017%2C%202018%20%E2%80%94%20A,issued%20Thursday%20by%20Microsoft%20Corp.&text=These%20gains%2C%20as%.
- Moss, Sebastian. 2021. Google shifts “moveable” compute tasks between data centers to use regional renewable energy. den 21 May. Använd den 25 07 2022. https://www.datacenterdynamics.com/en/news/google-shifts-moveable-compute-tasks-between-data-centers-to-use-regional-renewable-energy/.
- NIST. 2011. “The NIST Definition of Cloud.” National Institute of Standards and Technology. September. Använd den 10 April 2022. https://nvlpubs.nist.gov/nistpubs/legacy/sp/nistspecialpublication800-145.pdf.
- Nolan, Maggie, och Mylissa Tsai. 2020. Cloud Migrations Can Reduce CO2 Emissions by Nearly 60 Million tons a Year, According to New Research from Accenture. Accenture. den 22 September. Använd den 31 January 2022. https://newsroom.accenture.com/news/cloud-migrations-can-reduce-co2-emissions-by-nearly-60-million-tons-a-year-according-to-new-research-from-accenture.htm?spm=a2c65.11461447.0.0.964e28c6a8EcQ2#:~:text=22%2C%202020%20%E2%80%93%20Migration%20to%20the,Accen.
- Reuters. 2022. China aims to build 450 GW of solar, wind power on Gobi desert. den 05 March. Använd den 26 July 2022. https://www.reuters.com/world/china/china-aims-build-450-gw-solar-wind-power-gobi-desert-2022-03-05/.
- Ritchie, Hannah, och Max Roser. 2020. Electricity Mix. ourworldindata.org. Använd den 26 May 2022. https://ourworldindata.org/electricity-mix#citation.
- Roach, John. 2020. Microsoft finds underwater datacenters are reliable, practical and use energy sustainably. den 14 September. Använd den 25 July 2022. https://news.microsoft.com/innovation-stories/project-natick-underwater-datacenter/.
- Sethi, Satinder. 2021. Advancing Sustainability Objectives with IBM Cloud. IBM. den 4 November. Använd den 31 January 2022. https://www.ibm.com/cloud/blog/advancing-sustainability-objectives-with-ibm-cloud.
- Smart City Sweden. 2022. Stockholm Innovates District Heating with New Solutions and Renewable Sources. Använd den 25 July 2022. https://smartcitysweden.com/best-practice/401/stockholm-innovates-district-heating-with-new-solutions-and-renewable-sources/.
- SVT Nyheter. 2022. I Boden ska man odla i spillvärme från datacenter – mitt i smällkalla vintern. den 2 July. Använd den 25 July 2022. https://www.svt.se/nyheter/lokalt/norrbotten/ett-steg-narmare-att-odla-i-spillvarme-fran-datacenter.
- Tencent. 2022. “Tencent Carbon Neutrality Target and Roadmap Report.” Tencent. February. Använd den 21 April 2022. https://static.www.tencent.com/attachments/TencentCarbonNeutralityTargetandRoadmapReport.pdf.
- Verdict. 2022. Data centers must adapt to climate crisis. den 20 July. Använd den 29 July 2022. https://www.verdict.co.uk/data-centers-global-warming/.
- Wingren, Anrdeas. 202. Idag öppnar Microsofts hållbara datacenter i Sverige – skapar nya möjligheter för Sverige genom hållbar digitalisering. den 21 November. Använd den 26 07 2022. https://news.microsoft.com/sv-se/2021/11/16/idag-oppnar-microsofts-hallbara-datacenter-i-sverige-skapar-nya-mojligheter-for-sverige-genom-hallbar-digitalisering/.
- Wipro. 2021. “Wipro Selected as Dow Jones Sustainability World Index (DJSI) Member for the 12th Consecutive Year.” Wipro.com. den 23 November. Använd den 23 April 2022. https://www.wipro.com/newsroom/press-releases/2021/wipro-selected-as-dow-jones-sustainability-world-index-djsi-member-for-the-12th-consecutive-year/.
- Andrae, Anders S.G. 2020. “New perspectives on internet electricity use in 2030.” ResearchGate. June. Använd den 10 April 2022. https://www.researchgate.net/publication/342643762_New_perspectives_on_internet_electricity_use_in_2030.
- 2018. Apple. den 9 April. https://www.apple.com/newsroom/2018/04/apple-now-globally-powered-by-100-percent-renewable-energy/.
- Bala, Raj, Bob Gill, Smith Dennis, och David Wright. 2021. “Magic Quadrant for Cloud Infrastructure and Platform Services.” Gartner. July. Använd den 21 04 2022. https://www.gartner.com/doc/reprints?id=1-271OE4VR&ct=210802&st=sb.
- 2020. BBC. den 14 September. https://www.bbc.com/news/technology-54141899.
- Brady, G., N. Kapur, J. Summers, och H. M. Thomson. 2013. “A case study and critical assessment in calculating power usage effectiveness for a data centre.” Energy Conversion and Management 76 155–161.
- CNDCP. 2020. “Home Page.” Climate Neutral Data Centre Pact. Använd den 23 April 2022. https://www.climateneutraldatacentre.net/.
- Ferguson, Iain. 2022. Going Green with Cloud: How to Achieve Your Sustainability Objective. Alibaba Cloud. den 26 January. Använd den 31 January 2022. https://www.alibabacloud.com/blog/going-green-with-cloud-how-to-achieve-your-sustainability-objectives_598517.
- Gartner. 2021. Gartner Says Four Trends Are Shaping the Future of Public Cloud. Gartner Inc. den 2 August. Använd den 31 January 2022. https://www.gartner.com/en/newsroom/press-releases/2021-08-02-gartner-says-four-trends-are-shaping-the-future-of-public-cloud?spm=a2c65.11461447.0.0.964e28c6a8EcQ2#:~:text=Gartner%20forecasts%20end-user%20spending,less%20than%2017%25%20in%202021.
- IBM. 2021. “2021 ESG Report.” IBM. Använd den 22 April 2022. https://www.ibm.com/impact/files/reports-policies/2021/IBM_2021_ESG_Report.pdf.
- IDC. 2021. Cloud Computing Could Eliminate a Billion Metric tons of CO2 Emission Over the Next Four Years, and Possibly More, According to a New IDC Forecast. IDC. den 08 March. Använd den 31 January 2022. https://www.idc.com/getdoc.jsp?spm=a2c65.11461447.0.0.964e28c6a8EcQ2&containerId=prUS47513321.
- 2020. IoT Growth Demands Rethink of Long-Term Storage Strategies. IDC. den 20 July. https://www.idc.com/getdoc.jsp?containerId=prAP46737220.
- Kamiya, George. 2021. Data Centres and Data Transmission Networks. November. Använd den 1 April 2022. https://www.iea.org/reports/data-centres-and-data-transmission-networks.
- Khan, A. R., M. Othman, och A. N. Khan. 2013. “A Novel Application Licensing Framework for Mobile Cloud.” International Conference on Future Trends in Computing and Communication Technologies 127–131.
- Lacy, Peter, Paul Daugherty, Pavel Ponomarev, och Kishore Durg. 2020. The green behind the cloud. Accenture. den 22 September. Använd den 31 January 2022. https://www.accenture.com/_acnmedia/PDF-135/Accenture-Strategy-Green-Behind-Cloud-POV.pdf.
- Méndez-Villamil, Marta Mu¨noz. 2021. Google Masterclass
- Microsoft News Center. 2018. The Microsoft Cloud can save customers 93 percent and more in energy and carbon efficiency. Microsoft. den 17 May. Använd den 27 January 2022. https://news.microsoft.com/2018/05/17/the-microsoft-cloud-can-save-customers-93-percent-and-more-in-energy-and-carbon-efficiency/#:~:text=%E2%80%94%20May%2017%2C%202018%20%E2%80%94%20A,issued%20Thursday%20by%20Microsoft%20Corp.&text=These%20gains%2C%20as%.
- NIST. 2011. “The NIST Definition of Cloud.” National Institute of Standards and Technology. September. Använd den 10 April 2022. https://nvlpubs.nist.gov/nistpubs/legacy/sp/nistspecialpublication800-145.pdf.
- Nolan, Maggie, och Mylissa Tsai. 2020. Cloud Migrations Can Reduce CO2 Emissions by Nearly 60 Million tons a Year, According to New Research from Accenture. Accenture. den 22 September. Använd den 31 January 2022. https://newsroom.accenture.com/news/cloud-migrations-can-reduce-co2-emissions-by-nearly-60-million-tons-a-year-according-to-new-research-from-accenture.htm?spm=a2c65.11461447.0.0.964e28c6a8EcQ2#:~:text=22%2C%202020%20%E2%80%93%20Migration%20to%20the,Accen.
- Sethi, Satinder. 2021. Advancing Sustainability Objectives with IBM Cloud. IBM. den 4 November. Använd den 31 January 2022. https://www.ibm.com/cloud/blog/advancing-sustainability-objectives-with-ibm-cloud.
- Tencent. 2022. “Tencent Carbon Neutrality Target and Roadmap Report.” Tencent. February. Använd den 21 April 2022. https://static.www.tencent.com/attachments/TencentCarbonNeutralityTargetandRoadmapReport.pdf.
- Wipro. 2021. “Wipro Selected as Dow Jones Sustainability World Index (DJSI) Member for the 12th Consecutive Year.” Wipro.com. den 23 November. Använd den 23 April 2022. https://www.wipro.com/newsroom/press-releases/2021/wipro-selected-as-dow-jones-sustainability-world-index-djsi-member-for-the-12th-consecutive-year/.